Zip Codes with the Highest Percentage of Population with a Degree in Social Sciences in San Diego, CA
RELATED REPORTS & OPTIONS
Social Sciences
San Diego
Compare Zip Codes
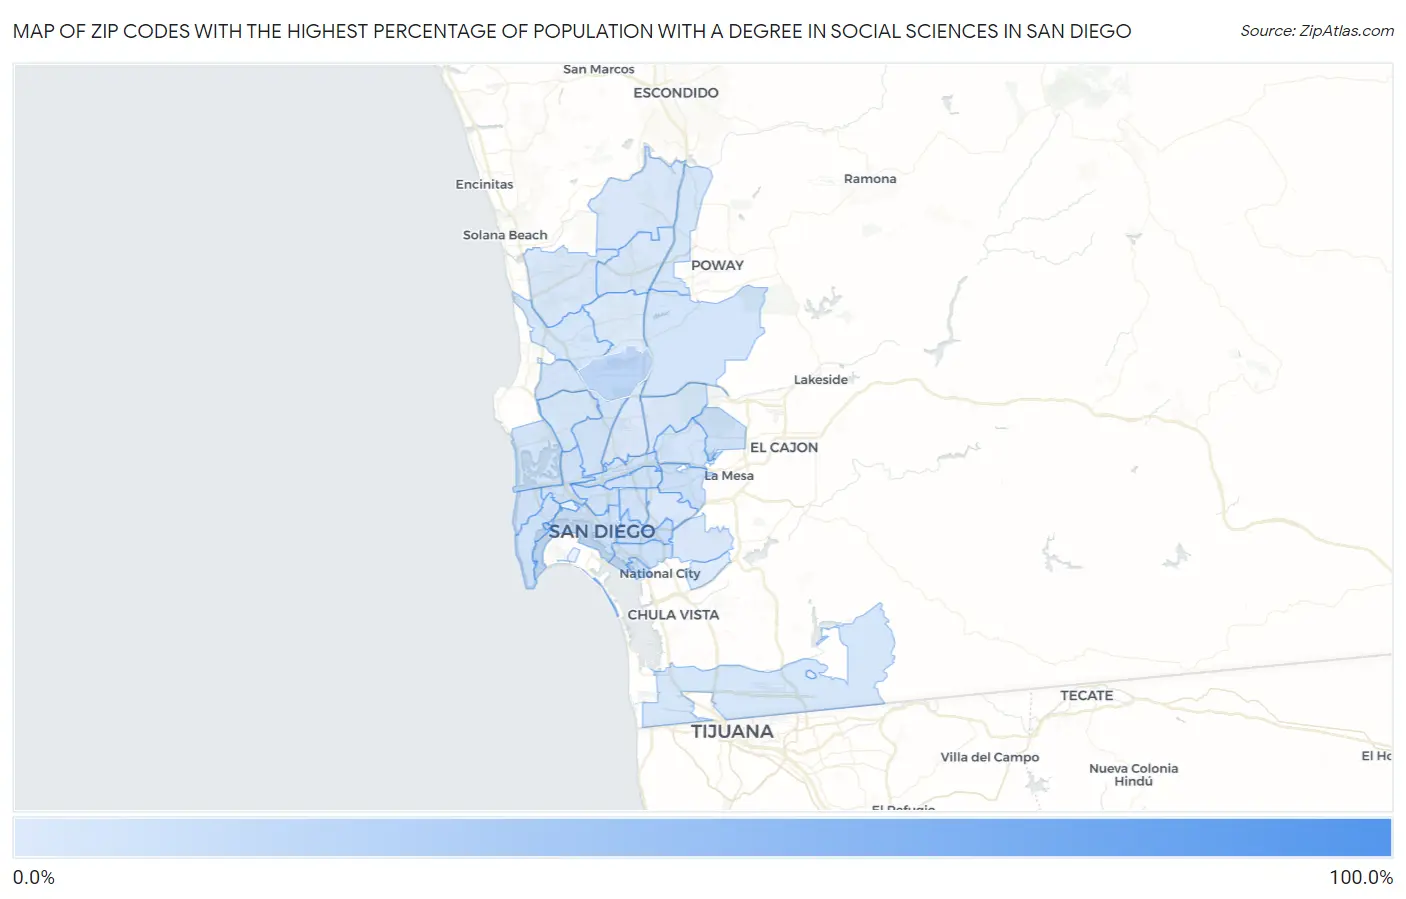
Map of Zip Codes with the Highest Percentage of Population with a Degree in Social Sciences in San Diego
6.2%
100.0%
Zip Codes with the Highest Percentage of Population with a Degree in Social Sciences in San Diego, CA
| Zip Code | % Graduates | vs State | vs National | |
| 1. | 92134 | 100.0% | 10.4%(+89.6)#4 | 8.1%(+91.9)#23 |
| 2. | 92155 | 50.0% | 10.4%(+39.6)#12 | 8.1%(+41.9)#149 |
| 3. | 92145 | 22.0% | 10.4%(+11.6)#74 | 8.1%(+13.9)#817 |
| 4. | 92102 | 16.4% | 10.4%(+6.00)#169 | 8.1%(+8.29)#1,545 |
| 5. | 92136 | 16.1% | 10.4%(+5.78)#180 | 8.1%(+8.08)#1,593 |
| 6. | 92115 | 13.5% | 10.4%(+3.16)#316 | 8.1%(+5.46)#2,580 |
| 7. | 92101 | 13.1% | 10.4%(+2.70)#346 | 8.1%(+5.00)#2,795 |
| 8. | 92116 | 12.9% | 10.4%(+2.51)#357 | 8.1%(+4.81)#2,898 |
| 9. | 92103 | 12.5% | 10.4%(+2.17)#384 | 8.1%(+4.47)#3,094 |
| 10. | 92106 | 12.5% | 10.4%(+2.17)#385 | 8.1%(+4.46)#3,099 |
| 11. | 92119 | 12.5% | 10.4%(+2.16)#387 | 8.1%(+4.46)#3,102 |
| 12. | 92113 | 12.3% | 10.4%(+1.91)#423 | 8.1%(+4.20)#3,304 |
| 13. | 92108 | 12.0% | 10.4%(+1.62)#454 | 8.1%(+3.92)#3,509 |
| 14. | 92110 | 11.9% | 10.4%(+1.56)#460 | 8.1%(+3.86)#3,551 |
| 15. | 92107 | 11.6% | 10.4%(+1.23)#490 | 8.1%(+3.52)#3,834 |
| 16. | 92111 | 11.4% | 10.4%(+1.07)#517 | 8.1%(+3.36)#3,964 |
| 17. | 92104 | 11.2% | 10.4%(+0.793)#547 | 8.1%(+3.09)#4,208 |
| 18. | 92120 | 10.8% | 10.4%(+0.384)#611 | 8.1%(+2.68)#4,637 |
| 19. | 92122 | 10.7% | 10.4%(+0.376)#612 | 8.1%(+2.67)#4,644 |
| 20. | 92109 | 10.6% | 10.4%(+0.190)#643 | 8.1%(+2.49)#4,864 |
| 21. | 92131 | 10.5% | 10.4%(+0.087)#666 | 8.1%(+2.38)#4,990 |
| 22. | 92121 | 9.9% | 10.4%(-0.484)#775 | 8.1%(+1.81)#5,708 |
| 23. | 92154 | 9.8% | 10.4%(-0.601)#789 | 8.1%(+1.69)#5,855 |
| 24. | 92128 | 9.4% | 10.4%(-0.996)#853 | 8.1%(+1.30)#6,402 |
| 25. | 92117 | 9.2% | 10.4%(-1.15)#876 | 8.1%(+1.15)#6,592 |
| 26. | 92114 | 8.6% | 10.4%(-1.74)#985 | 8.1%(+0.555)#7,560 |
| 27. | 92130 | 8.5% | 10.4%(-1.84)#1,006 | 8.1%(+0.455)#7,752 |
| 28. | 92127 | 8.5% | 10.4%(-1.88)#1,013 | 8.1%(+0.412)#7,835 |
| 29. | 92129 | 7.9% | 10.4%(-2.43)#1,099 | 8.1%(-0.135)#8,876 |
| 30. | 92105 | 7.5% | 10.4%(-2.84)#1,155 | 8.1%(-0.544)#9,717 |
| 31. | 92123 | 7.3% | 10.4%(-3.12)#1,189 | 8.1%(-0.821)#10,326 |
| 32. | 92124 | 7.1% | 10.4%(-3.25)#1,210 | 8.1%(-0.954)#10,660 |
| 33. | 92139 | 6.6% | 10.4%(-3.73)#1,263 | 8.1%(-1.44)#11,770 |
| 34. | 92126 | 6.2% | 10.4%(-4.12)#1,310 | 8.1%(-1.82)#12,776 |
1
Common Questions
What are the Top 10 Zip Codes with the Highest Percentage of Population with a Degree in Social Sciences in San Diego, CA?
Top 10 Zip Codes with the Highest Percentage of Population with a Degree in Social Sciences in San Diego, CA are:
What zip code has the Highest Percentage of Population with a Degree in Social Sciences in San Diego, CA?
92134 has the Highest Percentage of Population with a Degree in Social Sciences in San Diego, CA with 100.0%.
What is the Percentage of Population with a Degree in Social Sciences in San Diego, CA?
Percentage of Population with a Degree in Social Sciences in San Diego is 10.3%.
What is the Percentage of Population with a Degree in Social Sciences in California?
Percentage of Population with a Degree in Social Sciences in California is 10.4%.
What is the Percentage of Population with a Degree in Social Sciences in the United States?
Percentage of Population with a Degree in Social Sciences in the United States is 8.1%.