Cities with the Highest Percentage of Population with a Degree in Social Sciences in Iowa
RELATED REPORTS & OPTIONS
Social Sciences
Iowa
Compare Cities
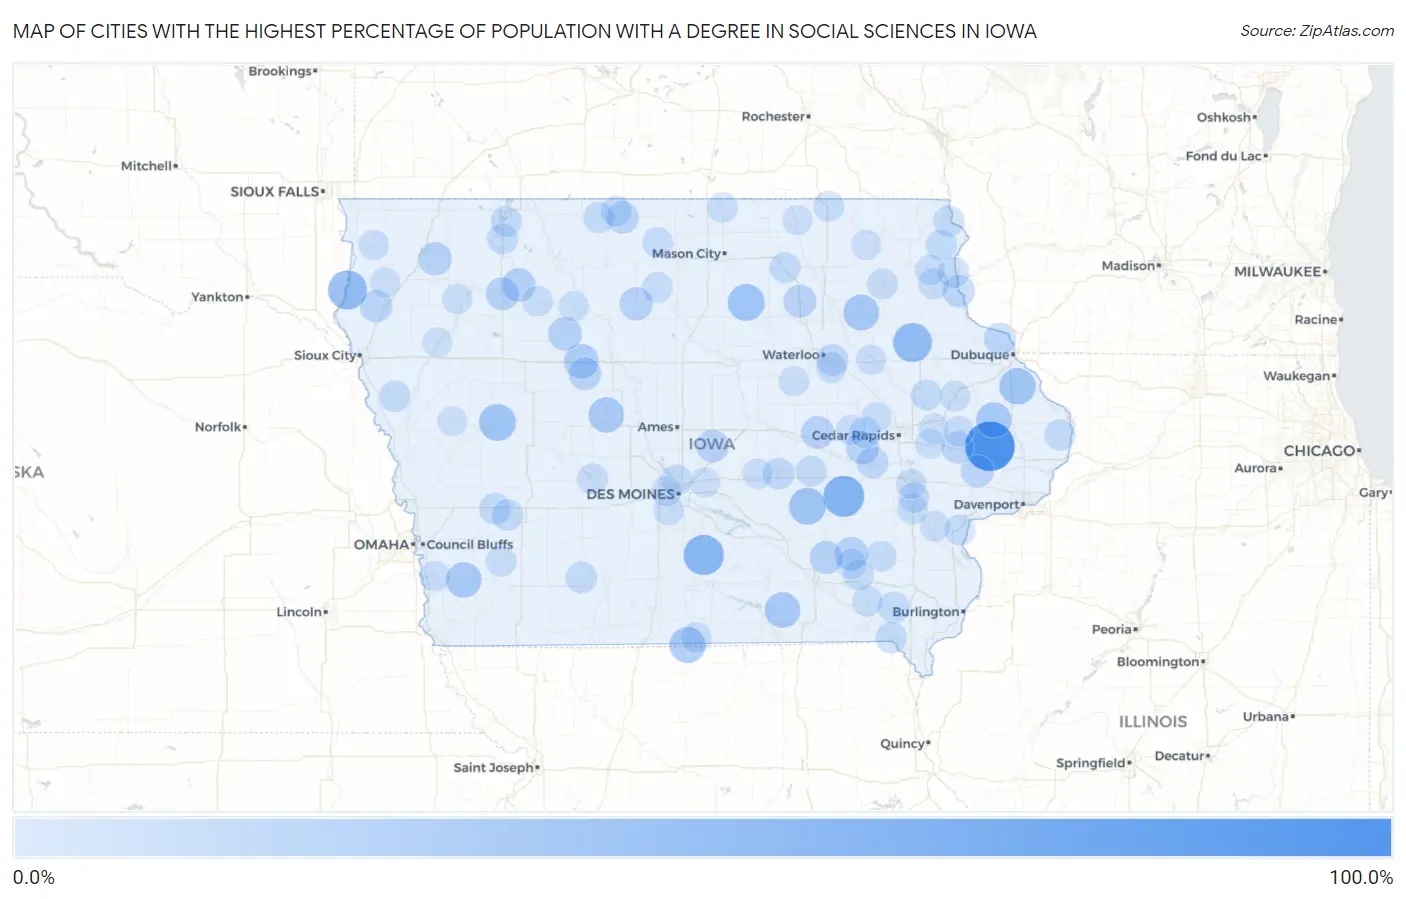
Map of Cities with the Highest Percentage of Population with a Degree in Social Sciences in Iowa
0.0%
100.0%
Cities with the Highest Percentage of Population with a Degree in Social Sciences in Iowa
| City | % Graduates | vs State | vs National | |
| 1. | Toronto | 100.0% | 5.7%(+94.3)#1 | 8.1%(+91.9)#42 |
| 2. | Millersburg | 59.5% | 5.7%(+53.8)#2 | 8.1%(+51.4)#120 |
| 3. | Lacona | 56.1% | 5.7%(+50.4)#3 | 8.1%(+48.0)#140 |
| 4. | Dundee | 50.0% | 5.7%(+44.3)#4 | 8.1%(+41.9)#181 |
| 5. | Chatsworth | 50.0% | 5.7%(+44.3)#5 | 8.1%(+41.9)#202 |
| 6. | Vail | 40.0% | 5.7%(+34.3)#6 | 8.1%(+31.9)#304 |
| 7. | Barnes City | 40.0% | 5.7%(+34.3)#7 | 8.1%(+31.9)#315 |
| 8. | Aredale | 40.0% | 5.7%(+34.3)#8 | 8.1%(+31.9)#320 |
| 9. | La Motte | 38.1% | 5.7%(+32.4)#9 | 8.1%(+30.0)#344 |
| 10. | Lineville | 36.2% | 5.7%(+30.5)#10 | 8.1%(+28.1)#379 |
| 11. | Westgate | 35.3% | 5.7%(+29.6)#11 | 8.1%(+27.2)#396 |
| 12. | Baldwin | 33.3% | 5.7%(+27.6)#12 | 8.1%(+25.3)#440 |
| 13. | Hastings | 33.3% | 5.7%(+27.6)#13 | 8.1%(+25.3)#443 |
| 14. | Unionville | 33.3% | 5.7%(+27.6)#14 | 8.1%(+25.3)#446 |
| 15. | Dana | 33.3% | 5.7%(+27.6)#15 | 8.1%(+25.3)#458 |
| 16. | Knierim | 30.0% | 5.7%(+24.3)#16 | 8.1%(+21.9)#544 |
| 17. | Fairport | 25.8% | 5.7%(+20.1)#17 | 8.1%(+17.7)#752 |
| 18. | Ollie | 25.0% | 5.7%(+19.3)#18 | 8.1%(+16.9)#821 |
| 19. | Webb | 25.0% | 5.7%(+19.3)#19 | 8.1%(+16.9)#827 |
| 20. | Palmer | 25.0% | 5.7%(+19.3)#20 | 8.1%(+16.9)#828 |
| 21. | Archer | 24.0% | 5.7%(+18.3)#21 | 8.1%(+15.9)#895 |
| 22. | Renwick | 23.8% | 5.7%(+18.1)#22 | 8.1%(+15.7)#905 |
| 23. | Hedrick | 23.2% | 5.7%(+17.5)#23 | 8.1%(+15.1)#948 |
| 24. | Watkins | 23.1% | 5.7%(+17.4)#24 | 8.1%(+15.0)#961 |
| 25. | Sioux Rapids | 22.8% | 5.7%(+17.1)#25 | 8.1%(+14.7)#981 |
| 26. | Plainfield | 22.6% | 5.7%(+16.9)#26 | 8.1%(+14.5)#996 |
| 27. | Vining | 22.2% | 5.7%(+16.5)#27 | 8.1%(+14.2)#1,050 |
| 28. | Collins | 21.7% | 5.7%(+16.1)#28 | 8.1%(+13.7)#1,090 |
| 29. | Somers | 21.4% | 5.7%(+15.7)#29 | 8.1%(+13.4)#1,134 |
| 30. | Bennett | 20.6% | 5.7%(+14.9)#30 | 8.1%(+12.5)#1,233 |
| 31. | Swedesburg | 20.6% | 5.7%(+14.9)#31 | 8.1%(+12.5)#1,235 |
| 32. | Lakota | 20.0% | 5.7%(+14.3)#32 | 8.1%(+11.9)#1,309 |
| 33. | Brunsville | 20.0% | 5.7%(+14.3)#33 | 8.1%(+11.9)#1,324 |
| 34. | Clayton | 20.0% | 5.7%(+14.3)#34 | 8.1%(+11.9)#1,339 |
| 35. | Stanwood | 19.0% | 5.7%(+13.4)#35 | 8.1%(+11.0)#1,468 |
| 36. | Sherrill | 18.6% | 5.7%(+12.9)#36 | 8.1%(+10.5)#1,548 |
| 37. | Elk Run Heights | 17.9% | 5.7%(+12.3)#37 | 8.1%(+9.88)#1,659 |
| 38. | Middle Amana | 17.6% | 5.7%(+11.9)#38 | 8.1%(+9.54)#1,721 |
| 39. | Grinnell | 16.8% | 5.7%(+11.1)#39 | 8.1%(+8.70)#1,892 |
| 40. | Hillsboro | 16.7% | 5.7%(+11.0)#40 | 8.1%(+8.60)#1,955 |
| 41. | Cromwell | 16.7% | 5.7%(+11.0)#41 | 8.1%(+8.60)#1,961 |
| 42. | Walnut | 16.2% | 5.7%(+10.5)#42 | 8.1%(+8.08)#2,062 |
| 43. | Farmington | 16.0% | 5.7%(+10.3)#43 | 8.1%(+7.93)#2,108 |
| 44. | Hornick | 15.4% | 5.7%(+9.70)#44 | 8.1%(+7.31)#2,277 |
| 45. | Marne | 15.4% | 5.7%(+9.70)#45 | 8.1%(+7.31)#2,290 |
| 46. | Newhall | 15.2% | 5.7%(+9.49)#46 | 8.1%(+7.10)#2,344 |
| 47. | Lansing | 15.0% | 5.7%(+9.31)#47 | 8.1%(+6.93)#2,394 |
| 48. | Swea City | 15.0% | 5.7%(+9.31)#48 | 8.1%(+6.93)#2,397 |
| 49. | Saylorville | 14.9% | 5.7%(+9.17)#49 | 8.1%(+6.78)#2,448 |
| 50. | Mcgregor | 14.7% | 5.7%(+9.04)#50 | 8.1%(+6.66)#2,484 |
| 51. | Prairieburg | 14.3% | 5.7%(+8.60)#51 | 8.1%(+6.21)#2,660 |
| 52. | Waterville | 14.3% | 5.7%(+8.60)#52 | 8.1%(+6.21)#2,664 |
| 53. | Andover | 14.3% | 5.7%(+8.60)#53 | 8.1%(+6.21)#2,670 |
| 54. | Ledyard | 14.3% | 5.7%(+8.60)#54 | 8.1%(+6.21)#2,676 |
| 55. | Charles City | 14.2% | 5.7%(+8.54)#55 | 8.1%(+6.15)#2,689 |
| 56. | Arnolds Park | 14.2% | 5.7%(+8.49)#56 | 8.1%(+6.10)#2,701 |
| 57. | Brooklyn | 14.0% | 5.7%(+8.31)#57 | 8.1%(+5.93)#2,764 |
| 58. | Fostoria | 14.0% | 5.7%(+8.27)#58 | 8.1%(+5.88)#2,780 |
| 59. | Fruitland | 13.6% | 5.7%(+7.92)#59 | 8.1%(+5.53)#2,931 |
| 60. | Kanawha | 13.6% | 5.7%(+7.88)#60 | 8.1%(+5.50)#2,946 |
| 61. | Washburn | 13.3% | 5.7%(+7.65)#61 | 8.1%(+5.26)#3,063 |
| 62. | Farmersburg | 13.3% | 5.7%(+7.65)#62 | 8.1%(+5.26)#3,066 |
| 63. | Brighton | 13.2% | 5.7%(+7.47)#63 | 8.1%(+5.09)#3,159 |
| 64. | Elliott | 13.0% | 5.7%(+7.36)#64 | 8.1%(+4.97)#3,219 |
| 65. | Lime Springs | 13.0% | 5.7%(+7.36)#65 | 8.1%(+4.97)#3,220 |
| 66. | Panora | 13.0% | 5.7%(+7.30)#66 | 8.1%(+4.92)#3,247 |
| 67. | Birmingham | 12.8% | 5.7%(+7.08)#67 | 8.1%(+4.69)#3,368 |
| 68. | Riverside | 12.8% | 5.7%(+7.07)#68 | 8.1%(+4.69)#3,375 |
| 69. | Laurens | 12.7% | 5.7%(+7.03)#69 | 8.1%(+4.64)#3,402 |
| 70. | Hills | 12.7% | 5.7%(+7.00)#70 | 8.1%(+4.61)#3,413 |
| 71. | West Union | 12.6% | 5.7%(+6.89)#71 | 8.1%(+4.50)#3,469 |
| 72. | Crystal Lake | 12.5% | 5.7%(+6.81)#72 | 8.1%(+4.43)#3,540 |
| 73. | Clio | 12.5% | 5.7%(+6.81)#73 | 8.1%(+4.43)#3,567 |
| 74. | Maharishi Vedic City | 12.4% | 5.7%(+6.76)#74 | 8.1%(+4.38)#3,588 |
| 75. | Monticello | 12.3% | 5.7%(+6.64)#75 | 8.1%(+4.25)#3,654 |
| 76. | Glenwood | 12.1% | 5.7%(+6.46)#76 | 8.1%(+4.07)#3,743 |
| 77. | Olin | 12.0% | 5.7%(+6.31)#77 | 8.1%(+3.93)#3,825 |
| 78. | Conesville | 11.8% | 5.7%(+6.08)#78 | 8.1%(+3.69)#3,955 |
| 79. | University Heights | 11.7% | 5.7%(+5.99)#79 | 8.1%(+3.60)#4,028 |
| 80. | Shellsburg | 11.7% | 5.7%(+5.96)#80 | 8.1%(+3.58)#4,038 |
| 81. | Van Horne | 11.7% | 5.7%(+5.96)#81 | 8.1%(+3.58)#4,040 |
| 82. | Rock Valley | 11.5% | 5.7%(+5.86)#82 | 8.1%(+3.47)#4,116 |
| 83. | Kellogg | 11.5% | 5.7%(+5.79)#83 | 8.1%(+3.40)#4,165 |
| 84. | Northwood | 11.5% | 5.7%(+5.77)#84 | 8.1%(+3.39)#4,179 |
| 85. | Monona | 11.4% | 5.7%(+5.69)#85 | 8.1%(+3.31)#4,239 |
| 86. | Independence | 11.4% | 5.7%(+5.67)#86 | 8.1%(+3.29)#4,252 |
| 87. | Norwalk | 11.2% | 5.7%(+5.53)#87 | 8.1%(+3.14)#4,353 |
| 88. | Packwood | 11.1% | 5.7%(+5.43)#88 | 8.1%(+3.04)#4,440 |
| 89. | Larrabee | 11.1% | 5.7%(+5.43)#89 | 8.1%(+3.04)#4,469 |
| 90. | Reinbeck | 11.0% | 5.7%(+5.29)#90 | 8.1%(+2.91)#4,571 |
| 91. | Rolfe | 10.9% | 5.7%(+5.22)#91 | 8.1%(+2.84)#4,621 |
| 92. | Mitchellville | 10.6% | 5.7%(+4.93)#92 | 8.1%(+2.55)#4,875 |
| 93. | Windsor Heights | 10.5% | 5.7%(+4.86)#93 | 8.1%(+2.48)#4,937 |
| 94. | Martelle | 10.5% | 5.7%(+4.84)#94 | 8.1%(+2.46)#4,968 |
| 95. | Maurice | 10.5% | 5.7%(+4.84)#95 | 8.1%(+2.46)#4,971 |
| 96. | Washta | 10.5% | 5.7%(+4.84)#96 | 8.1%(+2.46)#4,979 |
| 97. | Spillville | 10.4% | 5.7%(+4.73)#97 | 8.1%(+2.35)#5,063 |
| 98. | Riceville | 10.1% | 5.7%(+4.45)#98 | 8.1%(+2.06)#5,332 |
| 99. | Lisbon | 10.1% | 5.7%(+4.39)#99 | 8.1%(+2.01)#5,376 |
| 100. | Charter Oak | 10.0% | 5.7%(+4.31)#100 | 8.1%(+1.93)#5,448 |
Common Questions
What are the Top 10 Cities with the Highest Percentage of Population with a Degree in Social Sciences in Iowa?
Top 10 Cities with the Highest Percentage of Population with a Degree in Social Sciences in Iowa are:
#1
100.0%
#2
59.5%
#3
56.1%
#4
50.0%
#5
50.0%
#6
40.0%
#7
40.0%
#8
40.0%
#9
38.1%
#10
36.2%
What city has the Highest Percentage of Population with a Degree in Social Sciences in Iowa?
Toronto has the Highest Percentage of Population with a Degree in Social Sciences in Iowa with 100.0%.
What is the Percentage of Population with a Degree in Social Sciences in the State of Iowa?
Percentage of Population with a Degree in Social Sciences in Iowa is 5.7%.
What is the Percentage of Population with a Degree in Social Sciences in the United States?
Percentage of Population with a Degree in Social Sciences in the United States is 8.1%.