Cities with the Highest Percentage of Population with a Degree in Social Sciences in Indiana
RELATED REPORTS & OPTIONS
Social Sciences
Indiana
Compare Cities
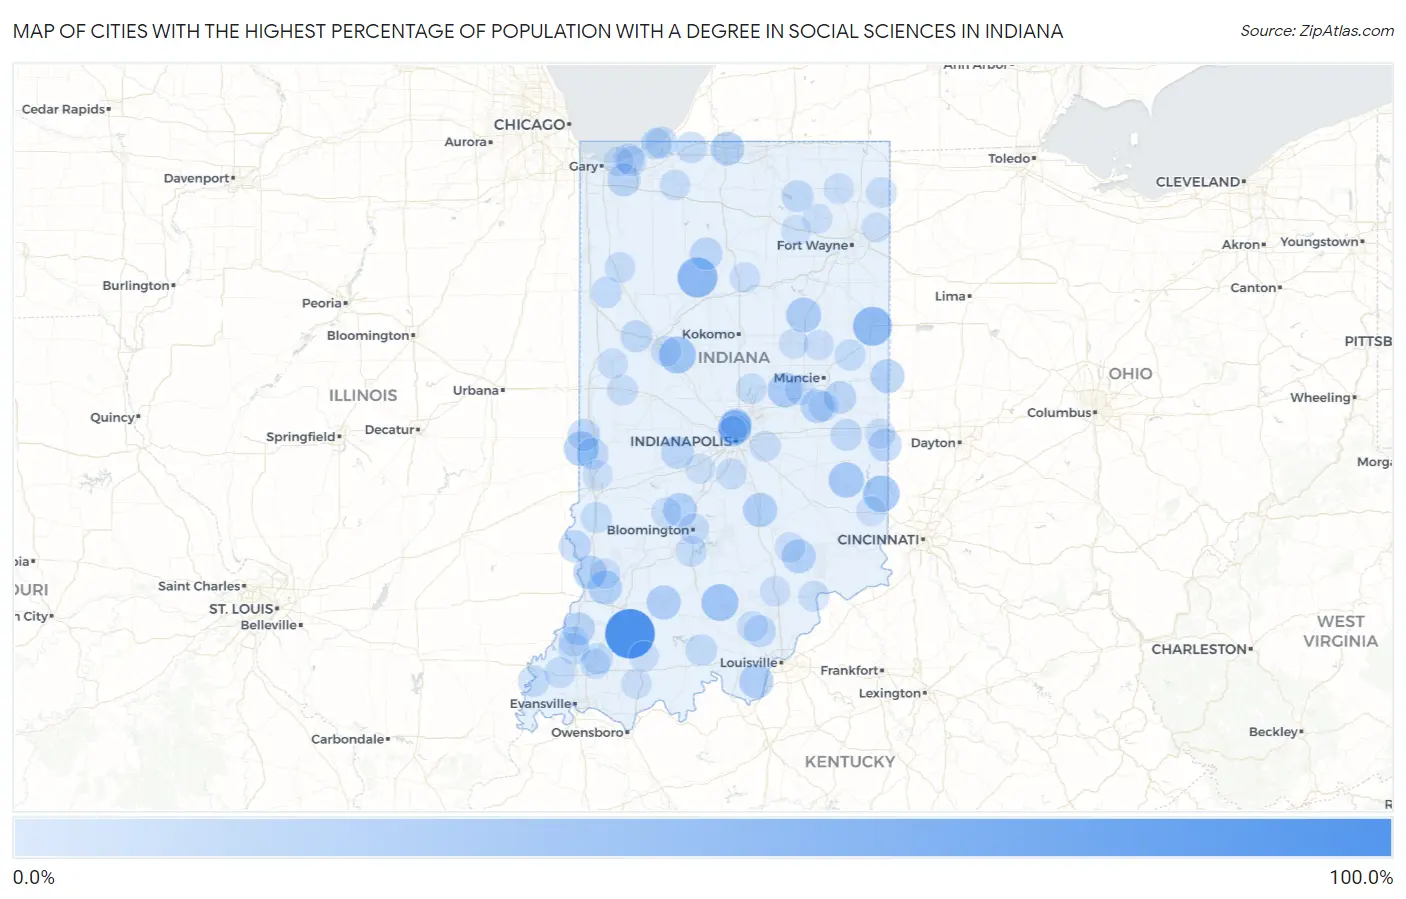
Map of Cities with the Highest Percentage of Population with a Degree in Social Sciences in Indiana
0.0%
100.0%
Cities with the Highest Percentage of Population with a Degree in Social Sciences in Indiana
| City | % Graduates | vs State | vs National | |
| 1. | Otwell | 100.0% | 5.4%(+94.6)#1 | 8.1%(+91.9)#12 |
| 2. | Cloverland | 100.0% | 5.4%(+94.6)#2 | 8.1%(+91.9)#19 |
| 3. | Royal Center | 54.0% | 5.4%(+48.5)#3 | 8.1%(+45.9)#154 |
| 4. | Bryant | 50.0% | 5.4%(+44.6)#4 | 8.1%(+41.9)#179 |
| 5. | Glezen | 50.0% | 5.4%(+44.6)#5 | 8.1%(+41.9)#180 |
| 6. | Libertyville | 50.0% | 5.4%(+44.6)#6 | 8.1%(+41.9)#186 |
| 7. | Hillsdale | 44.2% | 5.4%(+38.7)#7 | 8.1%(+36.1)#257 |
| 8. | Saltillo | 40.0% | 5.4%(+34.6)#8 | 8.1%(+31.9)#312 |
| 9. | Mulberry | 39.7% | 5.4%(+34.3)#9 | 8.1%(+31.7)#321 |
| 10. | Mount Carmel | 38.5% | 5.4%(+33.0)#10 | 8.1%(+30.4)#341 |
| 11. | Philadelphia | 34.8% | 5.4%(+29.4)#11 | 8.1%(+26.7)#405 |
| 12. | Laurel | 33.3% | 5.4%(+27.9)#12 | 8.1%(+25.3)#427 |
| 13. | Nineveh | 32.1% | 5.4%(+26.6)#13 | 8.1%(+24.0)#474 |
| 14. | Landess | 31.2% | 5.4%(+25.8)#14 | 8.1%(+23.2)#494 |
| 15. | St Bernice | 30.0% | 5.4%(+24.6)#15 | 8.1%(+21.9)#535 |
| 16. | River Forest | 30.0% | 5.4%(+24.6)#16 | 8.1%(+21.9)#547 |
| 17. | Elizabeth | 28.0% | 5.4%(+22.6)#17 | 8.1%(+19.9)#636 |
| 18. | Taylorsville | 27.6% | 5.4%(+22.2)#18 | 8.1%(+19.5)#653 |
| 19. | Shoals | 27.1% | 5.4%(+21.6)#19 | 8.1%(+19.0)#679 |
| 20. | Snow Lake | 27.0% | 5.4%(+21.6)#20 | 8.1%(+18.9)#683 |
| 21. | Bicknell | 26.7% | 5.4%(+21.2)#21 | 8.1%(+18.6)#697 |
| 22. | Union City | 26.6% | 5.4%(+21.2)#22 | 8.1%(+18.6)#709 |
| 23. | Stinesville | 26.4% | 5.4%(+21.0)#23 | 8.1%(+18.3)#719 |
| 24. | Vernon | 26.3% | 5.4%(+20.9)#24 | 8.1%(+18.2)#725 |
| 25. | Indian Village | 25.6% | 5.4%(+20.1)#25 | 8.1%(+17.5)#764 |
| 26. | Sulphur Springs | 25.4% | 5.4%(+19.9)#26 | 8.1%(+17.3)#776 |
| 27. | Oaktown | 25.0% | 5.4%(+19.6)#27 | 8.1%(+16.9)#793 |
| 28. | Mariah Hill | 23.7% | 5.4%(+18.2)#28 | 8.1%(+15.6)#914 |
| 29. | Hartz Lake | 23.6% | 5.4%(+18.2)#29 | 8.1%(+15.6)#917 |
| 30. | Crows Nest | 23.5% | 5.4%(+18.1)#30 | 8.1%(+15.5)#927 |
| 31. | North Crows Nest | 22.6% | 5.4%(+17.2)#31 | 8.1%(+14.6)#989 |
| 32. | Boston | 22.2% | 5.4%(+16.8)#32 | 8.1%(+14.2)#1,041 |
| 33. | Salt Creek Commons | 21.6% | 5.4%(+16.1)#33 | 8.1%(+13.5)#1,112 |
| 34. | Hazleton | 21.1% | 5.4%(+15.6)#34 | 8.1%(+13.0)#1,175 |
| 35. | Kewanna | 20.6% | 5.4%(+15.2)#35 | 8.1%(+12.6)#1,222 |
| 36. | Coatesville | 20.6% | 5.4%(+15.1)#36 | 8.1%(+12.5)#1,232 |
| 37. | Blountsville | 20.0% | 5.4%(+14.6)#37 | 8.1%(+11.9)#1,333 |
| 38. | Gilmer Park | 19.0% | 5.4%(+13.5)#38 | 8.1%(+10.9)#1,479 |
| 39. | Dana | 18.8% | 5.4%(+13.3)#39 | 8.1%(+10.7)#1,514 |
| 40. | Prairieton | 18.6% | 5.4%(+13.2)#40 | 8.1%(+10.5)#1,546 |
| 41. | Merom | 18.2% | 5.4%(+12.7)#41 | 8.1%(+10.1)#1,625 |
| 42. | Cromwell | 17.9% | 5.4%(+12.4)#42 | 8.1%(+9.79)#1,670 |
| 43. | Fairview Park | 17.5% | 5.4%(+12.1)#43 | 8.1%(+9.47)#1,735 |
| 44. | Montmorenci | 17.5% | 5.4%(+12.0)#44 | 8.1%(+9.40)#1,748 |
| 45. | Borden | 17.2% | 5.4%(+11.8)#45 | 8.1%(+9.17)#1,789 |
| 46. | Michiana Shores | 16.7% | 5.4%(+11.2)#46 | 8.1%(+8.60)#1,936 |
| 47. | Mount Auburn | 16.7% | 5.4%(+11.2)#47 | 8.1%(+8.60)#1,958 |
| 48. | English | 15.4% | 5.4%(+9.94)#48 | 8.1%(+7.31)#2,270 |
| 49. | New Harmony | 15.1% | 5.4%(+9.65)#49 | 8.1%(+7.03)#2,365 |
| 50. | Hudson Lake | 15.0% | 5.4%(+9.55)#50 | 8.1%(+6.93)#2,392 |
| 51. | Princeton | 14.9% | 5.4%(+9.45)#51 | 8.1%(+6.83)#2,437 |
| 52. | Rocky Ripple | 14.7% | 5.4%(+9.22)#52 | 8.1%(+6.60)#2,504 |
| 53. | Farmersburg | 14.5% | 5.4%(+9.04)#53 | 8.1%(+6.42)#2,563 |
| 54. | Goodland | 14.4% | 5.4%(+9.00)#54 | 8.1%(+6.37)#2,581 |
| 55. | Somerville | 14.3% | 5.4%(+8.84)#55 | 8.1%(+6.21)#2,651 |
| 56. | Redkey | 14.2% | 5.4%(+8.70)#56 | 8.1%(+6.08)#2,705 |
| 57. | Long Beach | 14.0% | 5.4%(+8.51)#57 | 8.1%(+5.88)#2,773 |
| 58. | Cynthiana | 13.7% | 5.4%(+8.28)#58 | 8.1%(+5.65)#2,875 |
| 59. | Harrodsburg | 13.4% | 5.4%(+7.98)#59 | 8.1%(+5.36)#3,004 |
| 60. | Rensselaer | 13.2% | 5.4%(+7.70)#60 | 8.1%(+5.08)#3,166 |
| 61. | Hanover | 13.0% | 5.4%(+7.60)#61 | 8.1%(+4.97)#3,207 |
| 62. | Hillsboro | 13.0% | 5.4%(+7.60)#62 | 8.1%(+4.97)#3,216 |
| 63. | New Palestine | 12.9% | 5.4%(+7.49)#63 | 8.1%(+4.87)#3,280 |
| 64. | Bennetts Switch | 12.8% | 5.4%(+7.33)#64 | 8.1%(+4.71)#3,358 |
| 65. | New Pekin | 12.8% | 5.4%(+7.32)#65 | 8.1%(+4.69)#3,366 |
| 66. | Butler | 12.7% | 5.4%(+7.27)#66 | 8.1%(+4.65)#3,400 |
| 67. | Kingsford Heights | 12.5% | 5.4%(+7.05)#67 | 8.1%(+4.43)#3,512 |
| 68. | Bargersville | 12.5% | 5.4%(+7.05)#68 | 8.1%(+4.42)#3,570 |
| 69. | Dune Acres | 12.3% | 5.4%(+6.82)#69 | 8.1%(+4.20)#3,675 |
| 70. | Bloomington | 12.2% | 5.4%(+6.78)#70 | 8.1%(+4.16)#3,703 |
| 71. | Cicero | 12.1% | 5.4%(+6.63)#71 | 8.1%(+4.01)#3,781 |
| 72. | Dayton | 12.0% | 5.4%(+6.55)#72 | 8.1%(+3.93)#3,823 |
| 73. | Gentryville | 11.8% | 5.4%(+6.32)#73 | 8.1%(+3.69)#3,962 |
| 74. | Mackey | 11.8% | 5.4%(+6.32)#74 | 8.1%(+3.69)#3,974 |
| 75. | Kendallville | 11.7% | 5.4%(+6.27)#75 | 8.1%(+3.64)#4,001 |
| 76. | Chesterfield | 11.7% | 5.4%(+6.23)#76 | 8.1%(+3.61)#4,023 |
| 77. | Austin | 11.6% | 5.4%(+6.12)#77 | 8.1%(+3.50)#4,100 |
| 78. | Duneland Beach | 11.5% | 5.4%(+6.09)#78 | 8.1%(+3.47)#4,132 |
| 79. | Meridian Hills | 11.5% | 5.4%(+6.02)#79 | 8.1%(+3.39)#4,175 |
| 80. | Porter | 11.4% | 5.4%(+5.98)#80 | 8.1%(+3.36)#4,202 |
| 81. | Country Squire Lakes | 11.4% | 5.4%(+5.92)#81 | 8.1%(+3.29)#4,247 |
| 82. | Spencer | 11.3% | 5.4%(+5.82)#82 | 8.1%(+3.20)#4,304 |
| 83. | Attica | 11.2% | 5.4%(+5.76)#83 | 8.1%(+3.13)#4,365 |
| 84. | Patoka | 11.1% | 5.4%(+5.66)#84 | 8.1%(+3.04)#4,423 |
| 85. | Denver | 11.1% | 5.4%(+5.66)#85 | 8.1%(+3.04)#4,432 |
| 86. | Shamrock Lakes | 11.1% | 5.4%(+5.66)#86 | 8.1%(+3.04)#4,451 |
| 87. | Huntingburg | 10.9% | 5.4%(+5.46)#87 | 8.1%(+2.84)#4,620 |
| 88. | Freelandville | 10.9% | 5.4%(+5.42)#88 | 8.1%(+2.80)#4,649 |
| 89. | Mount Summit | 10.7% | 5.4%(+5.27)#89 | 8.1%(+2.64)#4,792 |
| 90. | Spring Hill | 10.5% | 5.4%(+5.08)#90 | 8.1%(+2.46)#4,982 |
| 91. | Richmond | 10.5% | 5.4%(+5.02)#91 | 8.1%(+2.39)#5,015 |
| 92. | Tri Lakes | 10.1% | 5.4%(+4.64)#92 | 8.1%(+2.02)#5,368 |
| 93. | St. Wendel | 10.1% | 5.4%(+4.62)#93 | 8.1%(+2.00)#5,384 |
| 94. | Larwill | 10.0% | 5.4%(+4.55)#94 | 8.1%(+1.93)#5,453 |
| 95. | Ogden Dunes | 10.0% | 5.4%(+4.54)#95 | 8.1%(+1.92)#5,500 |
| 96. | Fairmount | 9.9% | 5.4%(+4.49)#96 | 8.1%(+1.87)#5,545 |
| 97. | North Terre Haute | 9.9% | 5.4%(+4.49)#97 | 8.1%(+1.87)#5,547 |
| 98. | St Leon | 9.9% | 5.4%(+4.47)#98 | 8.1%(+1.85)#5,566 |
| 99. | Harlan | 9.8% | 5.4%(+4.37)#99 | 8.1%(+1.74)#5,659 |
| 100. | Monrovia | 9.7% | 5.4%(+4.21)#100 | 8.1%(+1.59)#5,824 |
Common Questions
What are the Top 10 Cities with the Highest Percentage of Population with a Degree in Social Sciences in Indiana?
Top 10 Cities with the Highest Percentage of Population with a Degree in Social Sciences in Indiana are:
#1
100.0%
#2
54.0%
#3
50.0%
#4
40.0%
#5
39.7%
#6
38.5%
#7
33.3%
#8
31.2%
#9
30.0%
#10
30.0%
What city has the Highest Percentage of Population with a Degree in Social Sciences in Indiana?
Otwell has the Highest Percentage of Population with a Degree in Social Sciences in Indiana with 100.0%.
What is the Percentage of Population with a Degree in Social Sciences in the State of Indiana?
Percentage of Population with a Degree in Social Sciences in Indiana is 5.4%.
What is the Percentage of Population with a Degree in Social Sciences in the United States?
Percentage of Population with a Degree in Social Sciences in the United States is 8.1%.