Cities with the Highest Percentage of Population with a Degree in Social Sciences in Maryland
RELATED REPORTS & OPTIONS
Social Sciences
Maryland
Compare Cities
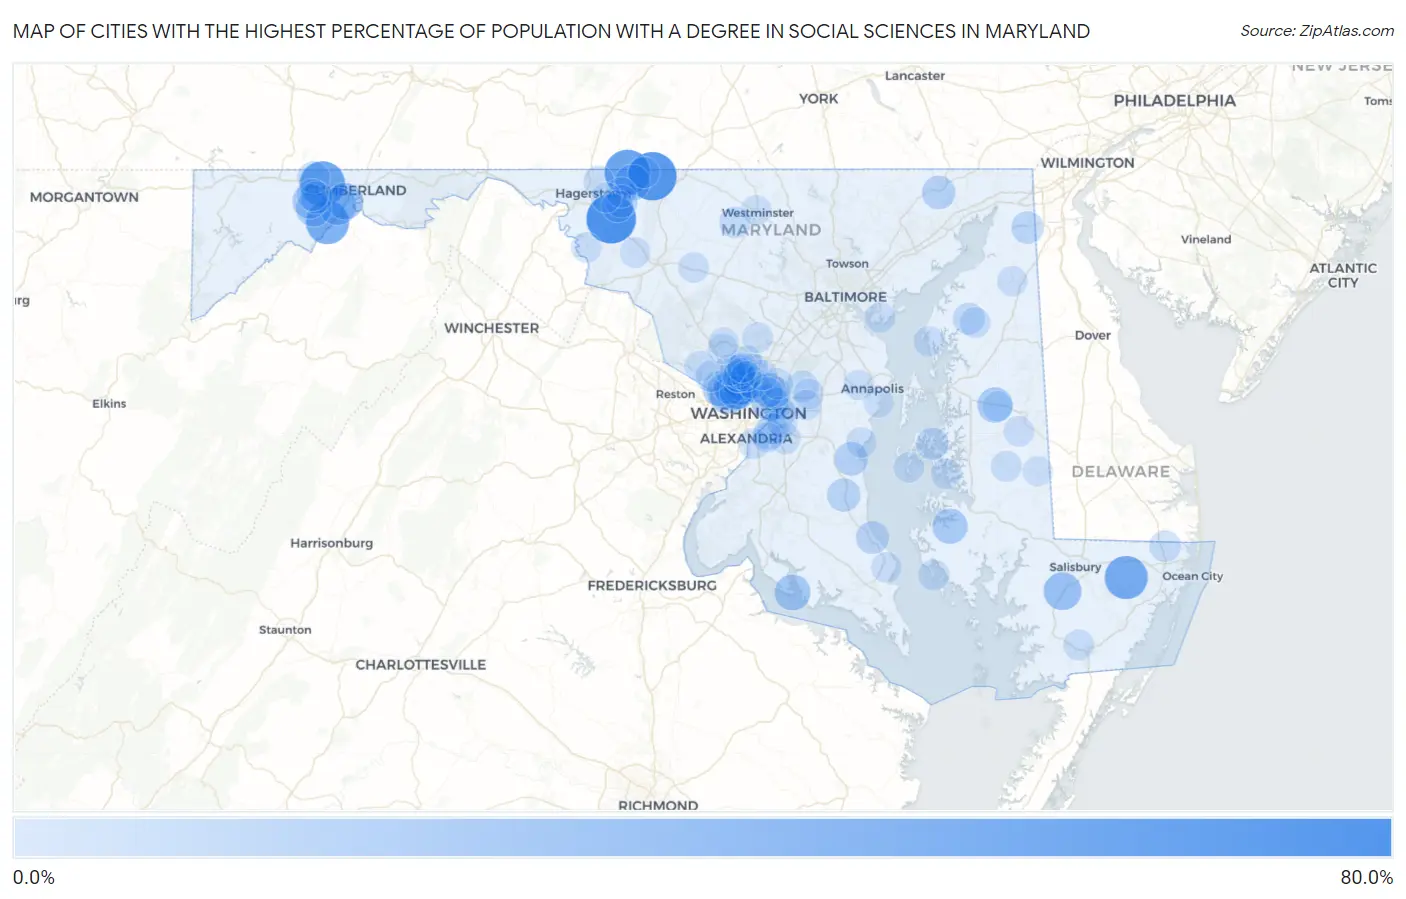
Map of Cities with the Highest Percentage of Population with a Degree in Social Sciences in Maryland
0.0%
80.0%
Cities with the Highest Percentage of Population with a Degree in Social Sciences in Maryland
| City | % Graduates | vs State | vs National | |
| 1. | San Mar | 68.4% | 10.7%(+57.8)#1 | 8.1%(+60.3)#87 |
| 2. | Sabillasville | 64.7% | 10.7%(+54.0)#2 | 8.1%(+56.6)#102 |
| 3. | Ringgold | 57.1% | 10.7%(+46.5)#3 | 8.1%(+49.1)#132 |
| 4. | Zihlman | 55.7% | 10.7%(+45.1)#4 | 8.1%(+47.7)#141 |
| 5. | Rawlings | 50.0% | 10.7%(+39.3)#5 | 8.1%(+41.9)#174 |
| 6. | Powellville | 50.0% | 10.7%(+39.3)#6 | 8.1%(+41.9)#193 |
| 7. | Chevy Chase Section Five | 36.3% | 10.7%(+25.6)#7 | 8.1%(+28.2)#378 |
| 8. | Somerset | 34.6% | 10.7%(+23.9)#8 | 8.1%(+26.5)#409 |
| 9. | Eden | 34.5% | 10.7%(+23.8)#9 | 8.1%(+26.4)#412 |
| 10. | Cresaptown | 34.1% | 10.7%(+23.4)#10 | 8.1%(+26.0)#421 |
| 11. | Potomac Park | 31.4% | 10.7%(+20.7)#11 | 8.1%(+23.3)#487 |
| 12. | Colmar Manor | 31.0% | 10.7%(+20.3)#12 | 8.1%(+22.9)#498 |
| 13. | Rock Point | 29.2% | 10.7%(+18.5)#13 | 8.1%(+21.1)#579 |
| 14. | Edgemont | 29.0% | 10.7%(+18.4)#14 | 8.1%(+21.0)#582 |
| 15. | Martin S Additions | 28.9% | 10.7%(+18.3)#15 | 8.1%(+20.8)#588 |
| 16. | Chevy Chase Village | 28.5% | 10.7%(+17.8)#16 | 8.1%(+20.4)#617 |
| 17. | Midland | 28.1% | 10.7%(+17.5)#17 | 8.1%(+20.1)#627 |
| 18. | Glen Echo | 28.0% | 10.7%(+17.3)#18 | 8.1%(+19.9)#638 |
| 19. | Queen Anne | 27.8% | 10.7%(+17.1)#19 | 8.1%(+19.7)#646 |
| 20. | Brookmont | 27.7% | 10.7%(+17.1)#20 | 8.1%(+19.7)#648 |
| 21. | Church Creek | 27.3% | 10.7%(+16.6)#21 | 8.1%(+19.2)#673 |
| 22. | Klondike | 27.0% | 10.7%(+16.3)#22 | 8.1%(+18.9)#684 |
| 23. | Cabin John | 26.6% | 10.7%(+15.9)#23 | 8.1%(+18.5)#713 |
| 24. | North Chevy Chase | 26.2% | 10.7%(+15.5)#24 | 8.1%(+18.1)#732 |
| 25. | Chevy Chase Section Three | 25.5% | 10.7%(+14.8)#25 | 8.1%(+17.4)#770 |
| 26. | University Park | 24.4% | 10.7%(+13.8)#26 | 8.1%(+16.4)#865 |
| 27. | Chevy Chase | 23.8% | 10.7%(+13.1)#27 | 8.1%(+15.7)#907 |
| 28. | Friendship | 23.2% | 10.7%(+12.6)#28 | 8.1%(+15.2)#945 |
| 29. | Darlington | 22.6% | 10.7%(+12.0)#29 | 8.1%(+14.5)#990 |
| 30. | Bethesda | 22.6% | 10.7%(+11.9)#30 | 8.1%(+14.5)#998 |
| 31. | Huntingtown | 22.2% | 10.7%(+11.6)#31 | 8.1%(+14.2)#1,030 |
| 32. | Friendship Heights Village | 21.9% | 10.7%(+11.2)#32 | 8.1%(+13.8)#1,074 |
| 33. | St Leonard | 21.4% | 10.7%(+10.7)#33 | 8.1%(+13.3)#1,140 |
| 34. | Jugtown | 20.5% | 10.7%(+9.85)#34 | 8.1%(+12.4)#1,242 |
| 35. | Chevy Chase View | 20.2% | 10.7%(+9.50)#35 | 8.1%(+12.1)#1,277 |
| 36. | Chesapeake City | 19.6% | 10.7%(+8.96)#36 | 8.1%(+11.6)#1,378 |
| 37. | Finzel | 19.4% | 10.7%(+8.78)#37 | 8.1%(+11.4)#1,402 |
| 38. | St Michaels | 19.4% | 10.7%(+8.75)#38 | 8.1%(+11.3)#1,407 |
| 39. | Shaft | 19.1% | 10.7%(+8.47)#39 | 8.1%(+11.1)#1,452 |
| 40. | Silver Spring | 19.0% | 10.7%(+8.37)#40 | 8.1%(+11.0)#1,474 |
| 41. | Mount Aetna | 18.7% | 10.7%(+8.03)#41 | 8.1%(+10.6)#1,532 |
| 42. | Midlothian | 18.5% | 10.7%(+7.86)#42 | 8.1%(+10.4)#1,566 |
| 43. | Chestertown | 18.2% | 10.7%(+7.59)#43 | 8.1%(+10.2)#1,600 |
| 44. | Garrett Park | 17.9% | 10.7%(+7.22)#44 | 8.1%(+9.81)#1,666 |
| 45. | Cheverly | 17.8% | 10.7%(+7.17)#45 | 8.1%(+9.76)#1,684 |
| 46. | Kemp Mill | 17.8% | 10.7%(+7.16)#46 | 8.1%(+9.75)#1,685 |
| 47. | South Kensington | 17.7% | 10.7%(+7.03)#47 | 8.1%(+9.62)#1,708 |
| 48. | Marlow Heights | 17.5% | 10.7%(+6.81)#48 | 8.1%(+9.41)#1,746 |
| 49. | Glenmont | 17.4% | 10.7%(+6.74)#49 | 8.1%(+9.33)#1,760 |
| 50. | Glenn Dale | 17.1% | 10.7%(+6.46)#50 | 8.1%(+9.06)#1,820 |
| 51. | North Kensington | 17.1% | 10.7%(+6.41)#51 | 8.1%(+9.00)#1,832 |
| 52. | Seat Pleasant | 17.1% | 10.7%(+6.40)#52 | 8.1%(+8.99)#1,833 |
| 53. | Bishopville | 17.0% | 10.7%(+6.32)#53 | 8.1%(+8.91)#1,849 |
| 54. | Kensington | 17.0% | 10.7%(+6.32)#54 | 8.1%(+8.91)#1,852 |
| 55. | Takoma Park | 16.9% | 10.7%(+6.28)#55 | 8.1%(+8.87)#1,862 |
| 56. | New Windsor | 16.9% | 10.7%(+6.26)#56 | 8.1%(+8.86)#1,865 |
| 57. | Riverdale Park | 16.8% | 10.7%(+6.12)#57 | 8.1%(+8.71)#1,890 |
| 58. | Highfield Cascade | 16.7% | 10.7%(+6.00)#58 | 8.1%(+8.60)#1,915 |
| 59. | Berwyn Heights | 16.6% | 10.7%(+5.96)#59 | 8.1%(+8.55)#1,972 |
| 60. | Hyattsville | 16.4% | 10.7%(+5.73)#60 | 8.1%(+8.33)#2,006 |
| 61. | Potomac | 16.3% | 10.7%(+5.66)#61 | 8.1%(+8.25)#2,021 |
| 62. | Cedar Heights | 15.9% | 10.7%(+5.26)#62 | 8.1%(+7.85)#2,128 |
| 63. | North Bethesda | 15.8% | 10.7%(+5.14)#63 | 8.1%(+7.74)#2,149 |
| 64. | Fishing Creek | 15.8% | 10.7%(+5.13)#64 | 8.1%(+7.72)#2,158 |
| 65. | Andrews Afb | 15.7% | 10.7%(+5.08)#65 | 8.1%(+7.67)#2,175 |
| 66. | Travilah | 15.6% | 10.7%(+4.94)#66 | 8.1%(+7.53)#2,212 |
| 67. | West Pocomoke | 15.6% | 10.7%(+4.89)#67 | 8.1%(+7.48)#2,225 |
| 68. | Paramount Long Meadow | 15.5% | 10.7%(+4.88)#68 | 8.1%(+7.47)#2,228 |
| 69. | Silver Hill | 15.5% | 10.7%(+4.88)#69 | 8.1%(+7.47)#2,229 |
| 70. | Oxford | 15.4% | 10.7%(+4.69)#70 | 8.1%(+7.28)#2,298 |
| 71. | National Harbor | 15.3% | 10.7%(+4.64)#71 | 8.1%(+7.24)#2,307 |
| 72. | Preston | 15.3% | 10.7%(+4.61)#72 | 8.1%(+7.21)#2,316 |
| 73. | Kingstown | 15.3% | 10.7%(+4.60)#73 | 8.1%(+7.19)#2,320 |
| 74. | Middletown | 15.0% | 10.7%(+4.29)#74 | 8.1%(+6.88)#2,416 |
| 75. | Ashton Sandy Spring | 14.9% | 10.7%(+4.22)#75 | 8.1%(+6.81)#2,439 |
| 76. | Fairwood | 14.9% | 10.7%(+4.20)#76 | 8.1%(+6.79)#2,445 |
| 77. | Williston | 14.8% | 10.7%(+4.15)#77 | 8.1%(+6.74)#2,466 |
| 78. | Sharpsburg | 14.7% | 10.7%(+4.04)#78 | 8.1%(+6.63)#2,492 |
| 79. | Parole | 14.7% | 10.7%(+4.04)#79 | 8.1%(+6.63)#2,498 |
| 80. | Tilghman Island | 14.7% | 10.7%(+4.00)#80 | 8.1%(+6.60)#2,506 |
| 81. | District Heights | 14.7% | 10.7%(+3.99)#81 | 8.1%(+6.59)#2,508 |
| 82. | New Market | 14.6% | 10.7%(+3.98)#82 | 8.1%(+6.57)#2,517 |
| 83. | Woodmore | 14.5% | 10.7%(+3.86)#83 | 8.1%(+6.45)#2,554 |
| 84. | Deale | 14.5% | 10.7%(+3.80)#84 | 8.1%(+6.40)#2,568 |
| 85. | Rock Hall | 14.4% | 10.7%(+3.77)#85 | 8.1%(+6.36)#2,587 |
| 86. | Lusby | 14.4% | 10.7%(+3.70)#86 | 8.1%(+6.30)#2,606 |
| 87. | Hillandale | 14.4% | 10.7%(+3.69)#87 | 8.1%(+6.28)#2,607 |
| 88. | Cavetown | 14.3% | 10.7%(+3.62)#88 | 8.1%(+6.21)#2,631 |
| 89. | Hillsboro | 14.3% | 10.7%(+3.62)#89 | 8.1%(+6.21)#2,665 |
| 90. | Galena | 14.2% | 10.7%(+3.54)#90 | 8.1%(+6.14)#2,692 |
| 91. | Temple Hills | 14.2% | 10.7%(+3.49)#91 | 8.1%(+6.08)#2,707 |
| 92. | Edgemere | 14.1% | 10.7%(+3.46)#92 | 8.1%(+6.05)#2,717 |
| 93. | Federalsburg | 14.1% | 10.7%(+3.43)#93 | 8.1%(+6.02)#2,729 |
| 94. | Derwood | 14.1% | 10.7%(+3.42)#94 | 8.1%(+6.01)#2,735 |
| 95. | Forest Glen | 14.1% | 10.7%(+3.42)#95 | 8.1%(+6.01)#2,736 |
| 96. | Highland Beach | 14.0% | 10.7%(+3.29)#96 | 8.1%(+5.88)#2,781 |
| 97. | Redland | 13.9% | 10.7%(+3.24)#97 | 8.1%(+5.83)#2,805 |
| 98. | Wheaton | 13.8% | 10.7%(+3.11)#98 | 8.1%(+5.70)#2,857 |
| 99. | Robinwood | 13.7% | 10.7%(+3.04)#99 | 8.1%(+5.64)#2,880 |
| 100. | Westminster | 13.6% | 10.7%(+2.98)#100 | 8.1%(+5.58)#2,905 |
Common Questions
What are the Top 10 Cities with the Highest Percentage of Population with a Degree in Social Sciences in Maryland?
Top 10 Cities with the Highest Percentage of Population with a Degree in Social Sciences in Maryland are:
#1
68.4%
#2
64.7%
#3
57.1%
#4
55.7%
#5
50.0%
#6
50.0%
#7
36.3%
#8
34.6%
#9
34.5%
#10
34.1%
What city has the Highest Percentage of Population with a Degree in Social Sciences in Maryland?
San Mar has the Highest Percentage of Population with a Degree in Social Sciences in Maryland with 68.4%.
What is the Percentage of Population with a Degree in Social Sciences in the State of Maryland?
Percentage of Population with a Degree in Social Sciences in Maryland is 10.7%.
What is the Percentage of Population with a Degree in Social Sciences in the United States?
Percentage of Population with a Degree in Social Sciences in the United States is 8.1%.