Cities with the Highest Percentage of Population with a Degree in Social Sciences in Ohio
RELATED REPORTS & OPTIONS
Social Sciences
Ohio
Compare Cities
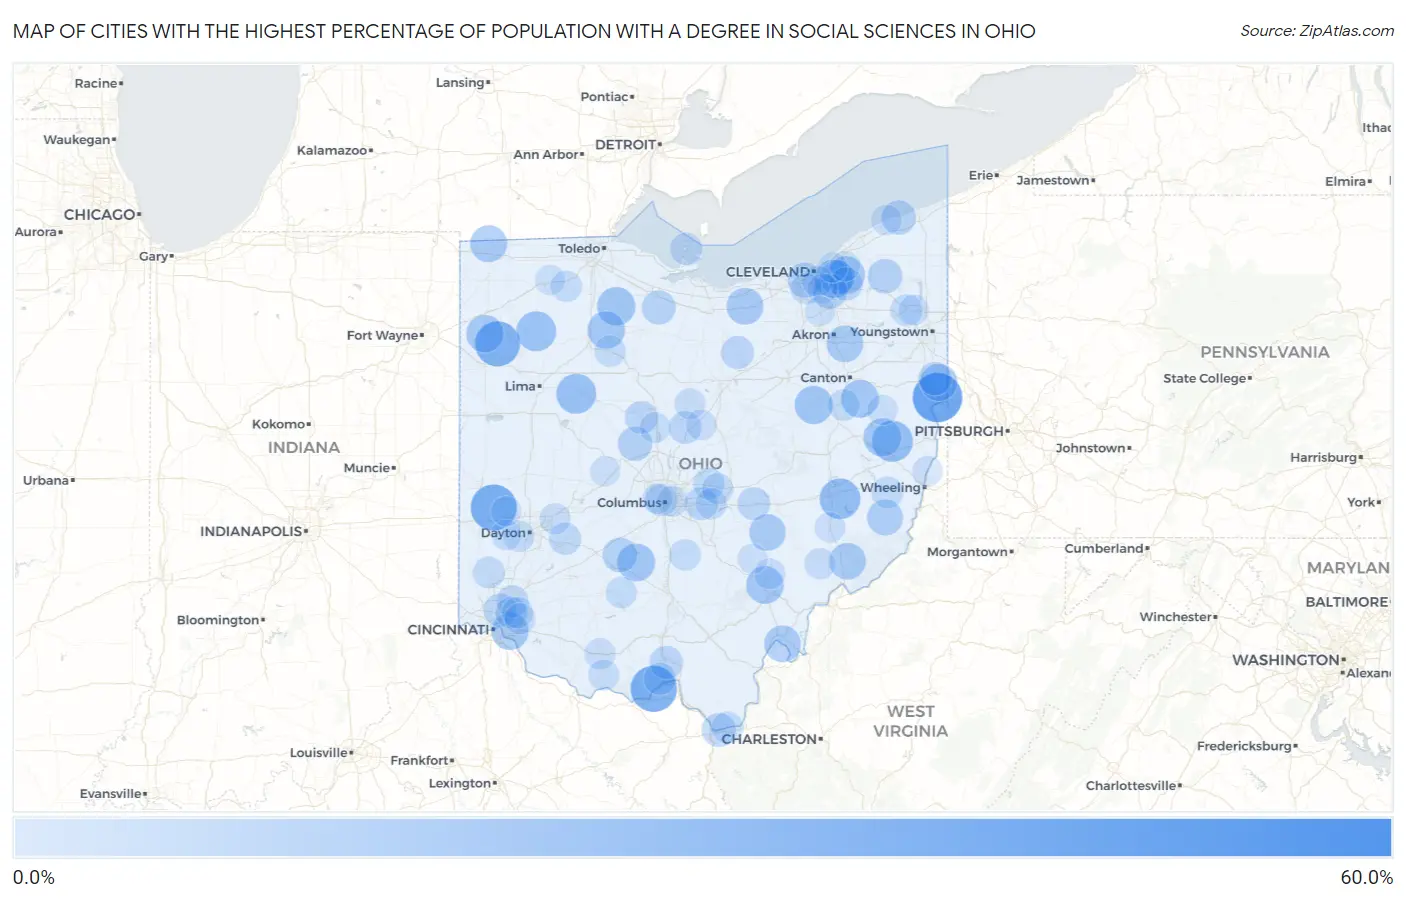
Map of Cities with the Highest Percentage of Population with a Degree in Social Sciences in Ohio
0.0%
60.0%
Cities with the Highest Percentage of Population with a Degree in Social Sciences in Ohio
| City | % Graduates | vs State | vs National | |
| 1. | Madison Place | 58.3% | 6.0%(+52.3)#1 | 8.1%(+50.3)#122 |
| 2. | Glenmoor | 47.6% | 6.0%(+41.6)#2 | 8.1%(+39.5)#229 |
| 3. | Friendship | 41.4% | 6.0%(+35.4)#3 | 8.1%(+33.3)#286 |
| 4. | Gordon | 41.2% | 6.0%(+35.2)#4 | 8.1%(+33.1)#289 |
| 5. | Grover Hill | 39.1% | 6.0%(+33.1)#5 | 8.1%(+31.1)#328 |
| 6. | Jewett | 31.2% | 6.0%(+25.3)#6 | 8.1%(+23.2)#491 |
| 7. | Lore City | 31.0% | 6.0%(+25.0)#7 | 8.1%(+23.0)#497 |
| 8. | Mcguffey | 29.4% | 6.0%(+23.4)#8 | 8.1%(+21.3)#565 |
| 9. | Miller City | 29.2% | 6.0%(+23.2)#9 | 8.1%(+21.1)#578 |
| 10. | Roseland | 28.0% | 6.0%(+22.0)#10 | 8.1%(+20.0)#632 |
| 11. | Highland Hills | 26.7% | 6.0%(+20.7)#11 | 8.1%(+18.6)#699 |
| 12. | Risingsun | 26.7% | 6.0%(+20.7)#12 | 8.1%(+18.6)#702 |
| 13. | Winesburg | 26.2% | 6.0%(+20.2)#13 | 8.1%(+18.1)#730 |
| 14. | Scio | 26.1% | 6.0%(+20.1)#14 | 8.1%(+18.0)#737 |
| 15. | New Holland | 25.6% | 6.0%(+19.6)#15 | 8.1%(+17.5)#760 |
| 16. | Magnolia | 25.5% | 6.0%(+19.5)#16 | 8.1%(+17.4)#768 |
| 17. | Chauncey | 25.4% | 6.0%(+19.4)#17 | 8.1%(+17.3)#778 |
| 18. | Hunting Valley | 25.1% | 6.0%(+19.1)#18 | 8.1%(+17.0)#789 |
| 19. | Arcadia | 25.0% | 6.0%(+19.0)#19 | 8.1%(+16.9)#795 |
| 20. | Latty | 25.0% | 6.0%(+19.0)#20 | 8.1%(+16.9)#825 |
| 21. | Sherwood | 24.6% | 6.0%(+18.6)#21 | 8.1%(+16.6)#854 |
| 22. | Lake Tomahawk | 24.3% | 6.0%(+18.3)#22 | 8.1%(+16.2)#872 |
| 23. | Pioneer | 23.9% | 6.0%(+17.9)#23 | 8.1%(+15.8)#900 |
| 24. | Kipton | 23.8% | 6.0%(+17.8)#24 | 8.1%(+15.7)#906 |
| 25. | Lakemore | 23.6% | 6.0%(+17.6)#25 | 8.1%(+15.5)#918 |
| 26. | Lower Salem | 23.5% | 6.0%(+17.5)#26 | 8.1%(+15.5)#926 |
| 27. | Syracuse | 23.4% | 6.0%(+17.4)#27 | 8.1%(+15.3)#937 |
| 28. | Crooksville | 23.3% | 6.0%(+17.3)#28 | 8.1%(+15.2)#943 |
| 29. | Wilson | 22.2% | 6.0%(+16.2)#29 | 8.1%(+14.2)#1,047 |
| 30. | Roachester | 21.4% | 6.0%(+15.4)#30 | 8.1%(+13.4)#1,126 |
| 31. | Linndale | 20.6% | 6.0%(+14.6)#31 | 8.1%(+12.6)#1,223 |
| 32. | Newport Cdp Washington County | 20.5% | 6.0%(+14.5)#32 | 8.1%(+12.4)#1,246 |
| 33. | Bloomingburg | 20.0% | 6.0%(+14.0)#33 | 8.1%(+11.9)#1,288 |
| 34. | Woodmere | 19.6% | 6.0%(+13.6)#34 | 8.1%(+11.6)#1,377 |
| 35. | Walton Hills | 19.5% | 6.0%(+13.5)#35 | 8.1%(+11.5)#1,386 |
| 36. | Middlefield | 19.5% | 6.0%(+13.5)#36 | 8.1%(+11.4)#1,396 |
| 37. | Magnetic Springs | 19.4% | 6.0%(+13.4)#37 | 8.1%(+11.3)#1,421 |
| 38. | Geneva On The Lake | 19.1% | 6.0%(+13.1)#38 | 8.1%(+11.1)#1,449 |
| 39. | Green Springs | 18.7% | 6.0%(+12.7)#39 | 8.1%(+10.6)#1,533 |
| 40. | Burlington | 18.5% | 6.0%(+12.5)#40 | 8.1%(+10.5)#1,555 |
| 41. | Rogers | 17.6% | 6.0%(+11.6)#41 | 8.1%(+9.58)#1,717 |
| 42. | Miller | 17.6% | 6.0%(+11.6)#42 | 8.1%(+9.51)#1,725 |
| 43. | Lucasville | 17.4% | 6.0%(+11.4)#43 | 8.1%(+9.29)#1,772 |
| 44. | Lockland | 17.2% | 6.0%(+11.2)#44 | 8.1%(+9.10)#1,804 |
| 45. | Savannah | 17.0% | 6.0%(+11.0)#45 | 8.1%(+8.91)#1,851 |
| 46. | Bentleyville | 16.9% | 6.0%(+10.9)#46 | 8.1%(+8.87)#1,861 |
| 47. | Etna | 16.9% | 6.0%(+10.9)#47 | 8.1%(+8.82)#1,871 |
| 48. | Green Camp | 16.7% | 6.0%(+10.7)#48 | 8.1%(+8.60)#1,934 |
| 49. | Gratiot | 16.7% | 6.0%(+10.7)#49 | 8.1%(+8.60)#1,949 |
| 50. | Fulton | 16.2% | 6.0%(+10.2)#50 | 8.1%(+8.15)#2,046 |
| 51. | West Portsmouth | 15.8% | 6.0%(+9.79)#51 | 8.1%(+7.72)#2,152 |
| 52. | Wilberforce | 15.7% | 6.0%(+9.74)#52 | 8.1%(+7.67)#2,176 |
| 53. | Put In Bay | 15.6% | 6.0%(+9.63)#53 | 8.1%(+7.55)#2,206 |
| 54. | Grandview Heights | 15.4% | 6.0%(+9.44)#54 | 8.1%(+7.37)#2,254 |
| 55. | Highpoint | 15.4% | 6.0%(+9.39)#55 | 8.1%(+7.31)#2,273 |
| 56. | Seven Mile | 15.2% | 6.0%(+9.15)#56 | 8.1%(+7.08)#2,352 |
| 57. | Leavittsburg | 15.0% | 6.0%(+9.00)#57 | 8.1%(+6.93)#2,393 |
| 58. | Concorde Hills | 14.9% | 6.0%(+8.93)#58 | 8.1%(+6.86)#2,425 |
| 59. | Belmont | 14.8% | 6.0%(+8.82)#59 | 8.1%(+6.74)#2,465 |
| 60. | Chesapeake | 14.7% | 6.0%(+8.71)#60 | 8.1%(+6.63)#2,490 |
| 61. | North Lima | 14.7% | 6.0%(+8.69)#61 | 8.1%(+6.62)#2,500 |
| 62. | Zoar | 14.6% | 6.0%(+8.58)#62 | 8.1%(+6.51)#2,540 |
| 63. | Alexandria | 14.5% | 6.0%(+8.53)#63 | 8.1%(+6.46)#2,552 |
| 64. | Stoutsville | 14.3% | 6.0%(+8.29)#64 | 8.1%(+6.21)#2,638 |
| 65. | Vanlue | 14.3% | 6.0%(+8.29)#65 | 8.1%(+6.21)#2,648 |
| 66. | Drexel | 13.9% | 6.0%(+7.92)#66 | 8.1%(+5.85)#2,792 |
| 67. | Greenfield | 13.9% | 6.0%(+7.91)#67 | 8.1%(+5.84)#2,798 |
| 68. | Kirkersville | 13.9% | 6.0%(+7.89)#68 | 8.1%(+5.82)#2,811 |
| 69. | Miamiville | 13.8% | 6.0%(+7.85)#69 | 8.1%(+5.78)#2,823 |
| 70. | Granville South | 13.8% | 6.0%(+7.81)#70 | 8.1%(+5.73)#2,837 |
| 71. | Grand Rapids | 13.8% | 6.0%(+7.77)#71 | 8.1%(+5.69)#2,859 |
| 72. | Milford | 13.7% | 6.0%(+7.69)#72 | 8.1%(+5.61)#2,890 |
| 73. | Beverly | 13.6% | 6.0%(+7.62)#73 | 8.1%(+5.55)#2,928 |
| 74. | Seaman | 13.6% | 6.0%(+7.56)#74 | 8.1%(+5.49)#2,951 |
| 75. | Parma Heights | 13.5% | 6.0%(+7.50)#75 | 8.1%(+5.42)#2,977 |
| 76. | Holiday Valley | 13.5% | 6.0%(+7.49)#76 | 8.1%(+5.42)#2,982 |
| 77. | Candlewood Lake | 13.3% | 6.0%(+7.27)#77 | 8.1%(+5.20)#3,097 |
| 78. | West Union | 13.3% | 6.0%(+7.26)#78 | 8.1%(+5.19)#3,105 |
| 79. | Cuyahoga Heights | 13.3% | 6.0%(+7.25)#79 | 8.1%(+5.18)#3,108 |
| 80. | Bexley | 13.1% | 6.0%(+7.10)#80 | 8.1%(+5.03)#3,181 |
| 81. | Waldo | 13.0% | 6.0%(+7.04)#81 | 8.1%(+4.97)#3,222 |
| 82. | Jacksonville | 12.9% | 6.0%(+6.90)#82 | 8.1%(+4.83)#3,299 |
| 83. | Tiltonsville | 12.7% | 6.0%(+6.73)#83 | 8.1%(+4.66)#3,383 |
| 84. | New Haven Cdp Huron County | 12.7% | 6.0%(+6.70)#84 | 8.1%(+4.63)#3,408 |
| 85. | Marble Cliff | 12.5% | 6.0%(+6.54)#85 | 8.1%(+4.47)#3,483 |
| 86. | Chesterville | 12.5% | 6.0%(+6.50)#86 | 8.1%(+4.43)#3,552 |
| 87. | Belle Valley | 12.5% | 6.0%(+6.50)#87 | 8.1%(+4.43)#3,556 |
| 88. | North Madison | 12.5% | 6.0%(+6.46)#88 | 8.1%(+4.39)#3,580 |
| 89. | New Lebanon | 12.3% | 6.0%(+6.33)#89 | 8.1%(+4.26)#3,647 |
| 90. | Warren | 12.2% | 6.0%(+6.23)#90 | 8.1%(+4.16)#3,698 |
| 91. | Carrollton | 12.2% | 6.0%(+6.16)#91 | 8.1%(+4.09)#3,730 |
| 92. | Liberty Center | 12.1% | 6.0%(+6.14)#92 | 8.1%(+4.07)#3,747 |
| 93. | Ridgewood | 11.9% | 6.0%(+5.94)#93 | 8.1%(+3.87)#3,857 |
| 94. | Valley View | 11.9% | 6.0%(+5.94)#94 | 8.1%(+3.86)#3,861 |
| 95. | Gates Mills | 11.8% | 6.0%(+5.85)#95 | 8.1%(+3.78)#3,902 |
| 96. | Richfield | 11.8% | 6.0%(+5.85)#96 | 8.1%(+3.78)#3,903 |
| 97. | South Euclid | 11.8% | 6.0%(+5.82)#97 | 8.1%(+3.75)#3,917 |
| 98. | New Straitsville | 11.8% | 6.0%(+5.77)#98 | 8.1%(+3.69)#3,953 |
| 99. | Phillipsburg | 11.8% | 6.0%(+5.77)#99 | 8.1%(+3.69)#3,959 |
| 100. | Woodstock | 11.8% | 6.0%(+5.77)#100 | 8.1%(+3.69)#3,968 |
Common Questions
What are the Top 10 Cities with the Highest Percentage of Population with a Degree in Social Sciences in Ohio?
Top 10 Cities with the Highest Percentage of Population with a Degree in Social Sciences in Ohio are:
#1
47.6%
#2
41.4%
#3
41.2%
#4
39.1%
#5
31.2%
#6
31.0%
#7
29.4%
#8
29.2%
#9
26.7%
#10
26.7%
What city has the Highest Percentage of Population with a Degree in Social Sciences in Ohio?
Glenmoor has the Highest Percentage of Population with a Degree in Social Sciences in Ohio with 47.6%.
What is the Percentage of Population with a Degree in Social Sciences in the State of Ohio?
Percentage of Population with a Degree in Social Sciences in Ohio is 6.0%.
What is the Percentage of Population with a Degree in Social Sciences in the United States?
Percentage of Population with a Degree in Social Sciences in the United States is 8.1%.