Zip Codes with the Highest Percentage of Population with a Degree in Social Sciences in San Jose, CA
RELATED REPORTS & OPTIONS
Social Sciences
San Jose
Compare Zip Codes
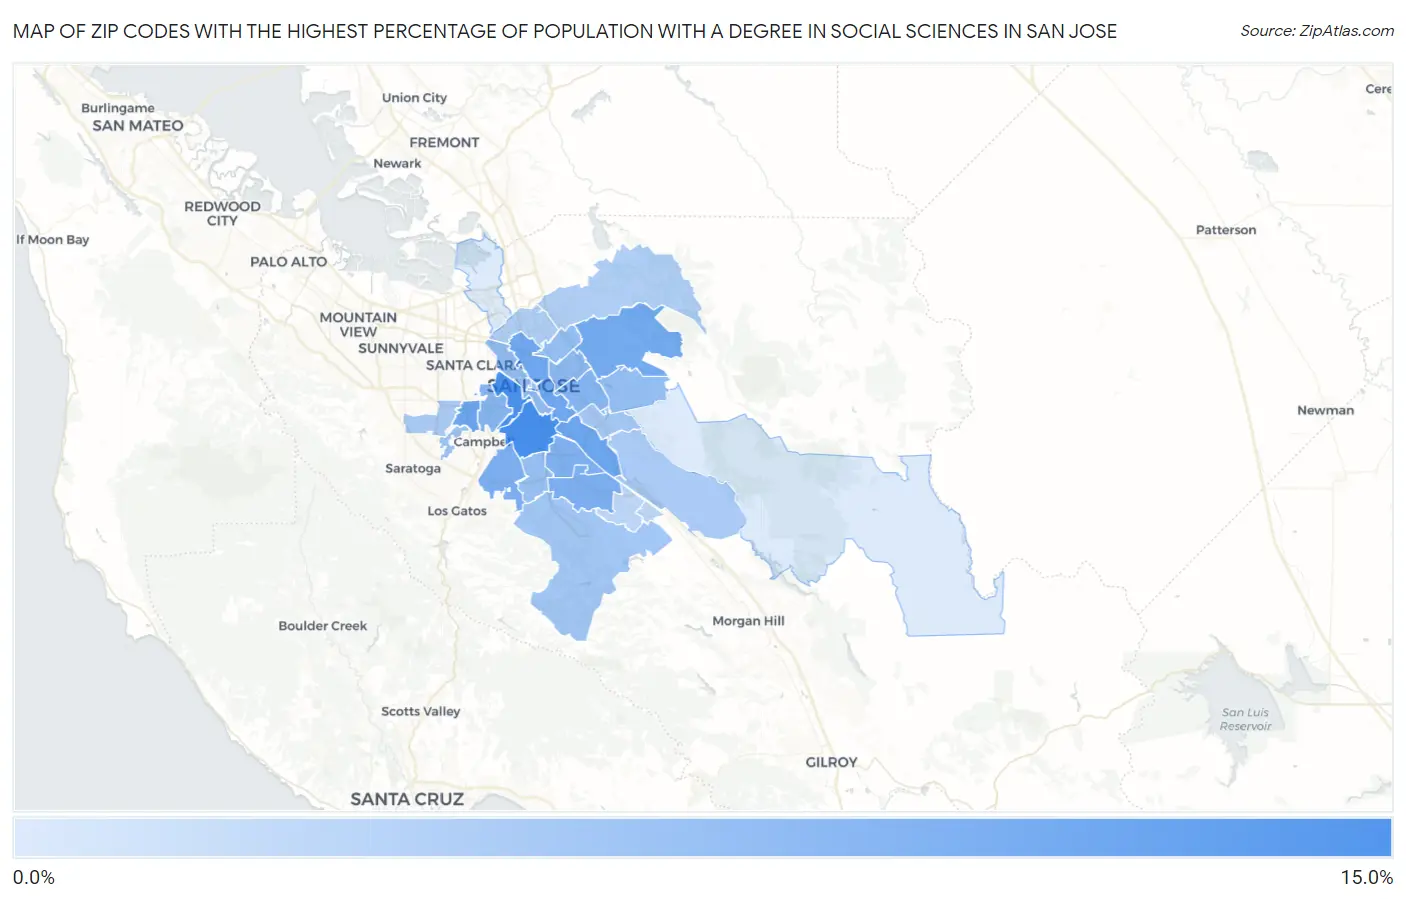
Map of Zip Codes with the Highest Percentage of Population with a Degree in Social Sciences in San Jose
3.9%
10.5%
Zip Codes with the Highest Percentage of Population with a Degree in Social Sciences in San Jose, CA
| Zip Code | % Graduates | vs State | vs National | |
| 1. | 95125 | 10.5% | 10.4%(+0.170)#648 | 8.1%(+2.47)#4,890 |
| 2. | 95126 | 10.3% | 10.4%(-0.081)#694 | 8.1%(+2.22)#5,196 |
| 3. | 95117 | 8.8% | 10.4%(-1.61)#956 | 8.1%(+0.682)#7,343 |
| 4. | 95111 | 8.7% | 10.4%(-1.64)#962 | 8.1%(+0.653)#7,388 |
| 5. | 95112 | 8.7% | 10.4%(-1.67)#969 | 8.1%(+0.627)#7,427 |
| 6. | 95127 | 8.4% | 10.4%(-1.97)#1,032 | 8.1%(+0.331)#7,992 |
| 7. | 95123 | 8.0% | 10.4%(-2.38)#1,092 | 8.1%(-0.089)#8,788 |
| 8. | 95124 | 8.0% | 10.4%(-2.39)#1,093 | 8.1%(-0.093)#8,793 |
| 9. | 95136 | 8.0% | 10.4%(-2.42)#1,096 | 8.1%(-0.119)#8,845 |
| 10. | 95122 | 7.6% | 10.4%(-2.75)#1,141 | 8.1%(-0.449)#9,517 |
| 11. | 95128 | 7.6% | 10.4%(-2.81)#1,149 | 8.1%(-0.511)#9,646 |
| 12. | 95116 | 7.3% | 10.4%(-3.06)#1,182 | 8.1%(-0.760)#10,190 |
| 13. | 95110 | 7.1% | 10.4%(-3.24)#1,207 | 8.1%(-0.940)#10,627 |
| 14. | 95133 | 7.0% | 10.4%(-3.40)#1,228 | 8.1%(-1.10)#10,985 |
| 15. | 95148 | 7.0% | 10.4%(-3.41)#1,229 | 8.1%(-1.12)#11,016 |
| 16. | 95118 | 6.9% | 10.4%(-3.46)#1,234 | 8.1%(-1.16)#11,142 |
| 17. | 95113 | 6.9% | 10.4%(-3.48)#1,238 | 8.1%(-1.18)#11,190 |
| 18. | 95130 | 6.5% | 10.4%(-3.84)#1,281 | 8.1%(-1.54)#12,035 |
| 19. | 95120 | 6.4% | 10.4%(-4.01)#1,300 | 8.1%(-1.71)#12,488 |
| 20. | 95121 | 6.3% | 10.4%(-4.12)#1,307 | 8.1%(-1.82)#12,735 |
| 21. | 95129 | 6.1% | 10.4%(-4.25)#1,320 | 8.1%(-1.95)#13,040 |
| 22. | 95138 | 6.1% | 10.4%(-4.27)#1,325 | 8.1%(-1.97)#13,077 |
| 23. | 95131 | 5.9% | 10.4%(-4.50)#1,343 | 8.1%(-2.20)#13,670 |
| 24. | 95132 | 5.7% | 10.4%(-4.62)#1,348 | 8.1%(-2.33)#13,948 |
| 25. | 95119 | 5.3% | 10.4%(-5.11)#1,373 | 8.1%(-2.82)#15,216 |
| 26. | 95139 | 5.2% | 10.4%(-5.19)#1,379 | 8.1%(-2.89)#15,393 |
| 27. | 95135 | 3.9% | 10.4%(-6.49)#1,438 | 8.1%(-4.19)#18,479 |
| 28. | 95134 | 3.9% | 10.4%(-6.51)#1,440 | 8.1%(-4.21)#18,522 |
1
Common Questions
What are the Top 10 Zip Codes with the Highest Percentage of Population with a Degree in Social Sciences in San Jose, CA?
Top 10 Zip Codes with the Highest Percentage of Population with a Degree in Social Sciences in San Jose, CA are:
What zip code has the Highest Percentage of Population with a Degree in Social Sciences in San Jose, CA?
95125 has the Highest Percentage of Population with a Degree in Social Sciences in San Jose, CA with 10.5%.
What is the Percentage of Population with a Degree in Social Sciences in San Jose, CA?
Percentage of Population with a Degree in Social Sciences in San Jose is 7.2%.
What is the Percentage of Population with a Degree in Social Sciences in California?
Percentage of Population with a Degree in Social Sciences in California is 10.4%.
What is the Percentage of Population with a Degree in Social Sciences in the United States?
Percentage of Population with a Degree in Social Sciences in the United States is 8.1%.