Cities with the Highest Percentage of Population with a Degree in Social Sciences in South Dakota
RELATED REPORTS & OPTIONS
Social Sciences
South Dakota
Compare Cities
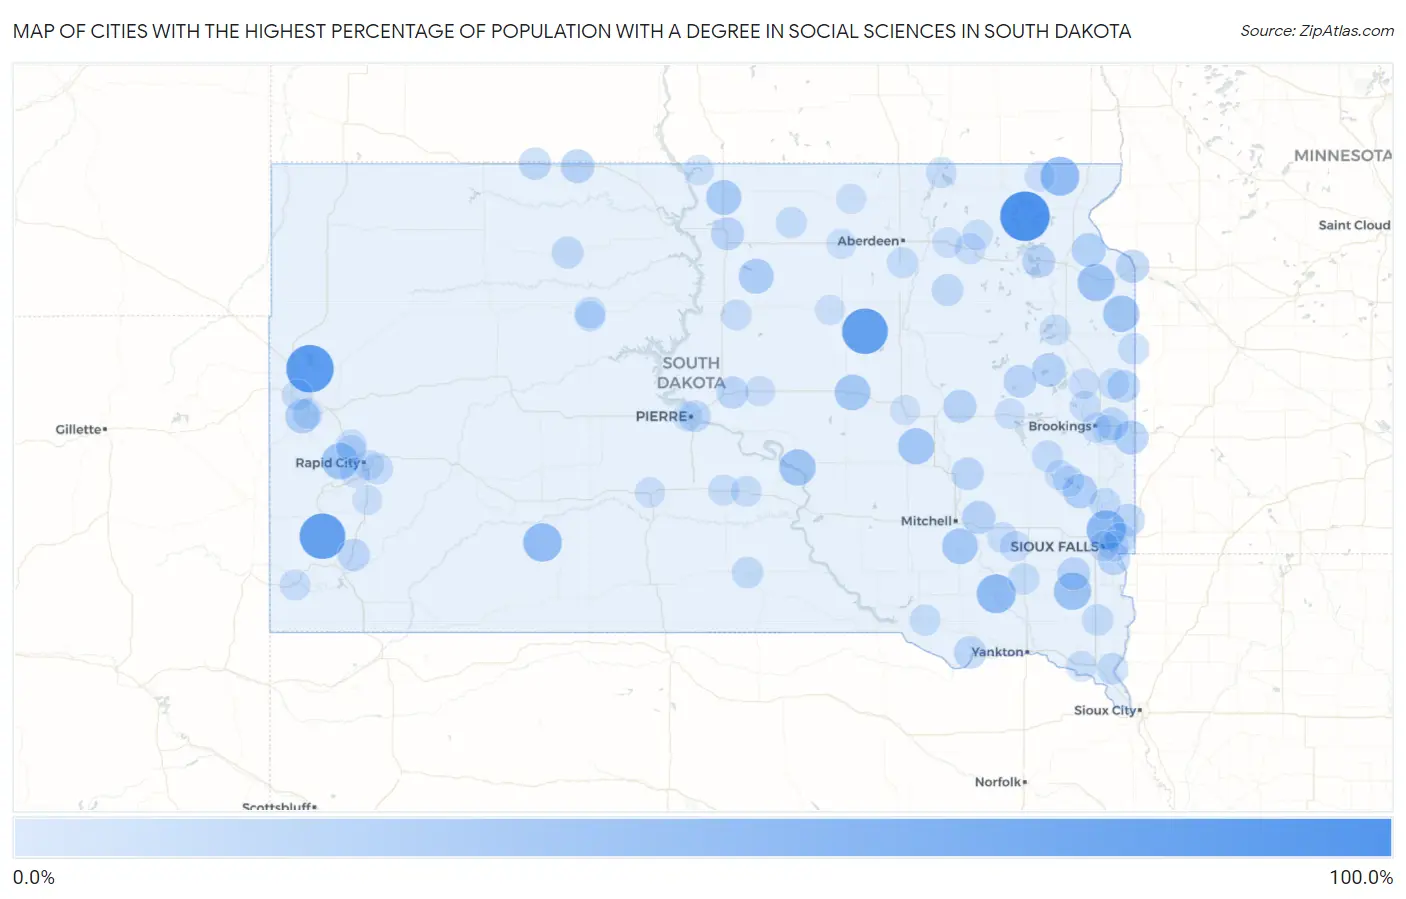
Map of Cities with the Highest Percentage of Population with a Degree in Social Sciences in South Dakota
0.0%
100.0%
Cities with the Highest Percentage of Population with a Degree in Social Sciences in South Dakota
| City | % Graduates | vs State | vs National | |
| 1. | Eden | 82.1% | 6.3%(+75.8)#1 | 8.1%(+74.1)#67 |
| 2. | Fruitdale | 73.7% | 6.3%(+67.3)#2 | 8.1%(+65.6)#77 |
| 3. | Pringle | 66.7% | 6.3%(+60.3)#3 | 8.1%(+58.6)#93 |
| 4. | Rockham | 66.7% | 6.3%(+60.3)#4 | 8.1%(+58.6)#98 |
| 5. | Renner Corner | 41.2% | 6.3%(+34.8)#5 | 8.1%(+33.1)#288 |
| 6. | Olivet | 40.0% | 6.3%(+33.7)#6 | 8.1%(+31.9)#319 |
| 7. | Claire City | 39.3% | 6.3%(+32.9)#7 | 8.1%(+31.2)#326 |
| 8. | Wanblee | 38.6% | 6.3%(+32.3)#8 | 8.1%(+30.6)#336 |
| 9. | Davis | 33.3% | 6.3%(+27.0)#9 | 8.1%(+25.3)#444 |
| 10. | Twin Brooks | 33.3% | 6.3%(+27.0)#10 | 8.1%(+25.3)#456 |
| 11. | Fort Thompson | 30.0% | 6.3%(+23.7)#11 | 8.1%(+21.9)#534 |
| 12. | Revillo | 30.0% | 6.3%(+23.7)#12 | 8.1%(+21.9)#543 |
| 13. | Johnson Siding | 29.9% | 6.3%(+23.6)#13 | 8.1%(+21.9)#548 |
| 14. | Alpena | 29.2% | 6.3%(+22.8)#14 | 8.1%(+21.1)#575 |
| 15. | Ethan | 27.3% | 6.3%(+20.9)#15 | 8.1%(+19.2)#666 |
| 16. | St Lawrence | 27.3% | 6.3%(+20.9)#16 | 8.1%(+19.2)#670 |
| 17. | Mound City | 25.0% | 6.3%(+18.7)#17 | 8.1%(+16.9)#835 |
| 18. | Hoven | 24.3% | 6.3%(+18.0)#18 | 8.1%(+16.3)#869 |
| 19. | Chester | 21.4% | 6.3%(+15.1)#19 | 8.1%(+13.4)#1,130 |
| 20. | Central City | 21.4% | 6.3%(+15.1)#20 | 8.1%(+13.4)#1,136 |
| 21. | Elkton | 21.0% | 6.3%(+14.6)#21 | 8.1%(+12.9)#1,185 |
| 22. | Wilmot | 20.8% | 6.3%(+14.4)#22 | 8.1%(+12.7)#1,211 |
| 23. | Hayti | 19.3% | 6.3%(+13.0)#23 | 8.1%(+11.2)#1,432 |
| 24. | Mcintosh | 19.2% | 6.3%(+12.9)#24 | 8.1%(+11.2)#1,443 |
| 25. | Big Stone City | 18.2% | 6.3%(+11.8)#25 | 8.1%(+10.1)#1,610 |
| 26. | Fulton | 18.2% | 6.3%(+11.8)#26 | 8.1%(+10.1)#1,632 |
| 27. | Yale | 17.6% | 6.3%(+11.3)#27 | 8.1%(+9.58)#1,718 |
| 28. | Selby | 16.9% | 6.3%(+10.5)#28 | 8.1%(+8.80)#1,876 |
| 29. | Bryant | 16.7% | 6.3%(+10.3)#29 | 8.1%(+8.60)#1,920 |
| 30. | Waubay | 16.7% | 6.3%(+10.3)#30 | 8.1%(+8.60)#1,937 |
| 31. | Chancellor | 16.2% | 6.3%(+9.87)#31 | 8.1%(+8.15)#2,047 |
| 32. | Bushnell | 15.8% | 6.3%(+9.44)#32 | 8.1%(+7.72)#2,163 |
| 33. | Shindler | 15.7% | 6.3%(+9.36)#33 | 8.1%(+7.63)#2,183 |
| 34. | Garretson | 15.4% | 6.3%(+9.04)#34 | 8.1%(+7.31)#2,269 |
| 35. | Astoria | 15.4% | 6.3%(+9.04)#35 | 8.1%(+7.31)#2,285 |
| 36. | Springfield | 15.1% | 6.3%(+8.79)#36 | 8.1%(+7.06)#2,356 |
| 37. | Artesian | 15.0% | 6.3%(+8.65)#37 | 8.1%(+6.93)#2,405 |
| 38. | Blunt | 14.3% | 6.3%(+7.94)#38 | 8.1%(+6.21)#2,654 |
| 39. | Buffalo Gap | 14.3% | 6.3%(+7.94)#39 | 8.1%(+6.21)#2,668 |
| 40. | Morristown | 14.3% | 6.3%(+7.94)#40 | 8.1%(+6.21)#2,678 |
| 41. | Mountain Plains | 13.4% | 6.3%(+7.06)#41 | 8.1%(+5.33)#3,019 |
| 42. | Isabel | 13.3% | 6.3%(+6.99)#42 | 8.1%(+5.26)#3,070 |
| 43. | Oahe Acres | 12.9% | 6.3%(+6.53)#43 | 8.1%(+4.80)#3,312 |
| 44. | Pierre | 12.7% | 6.3%(+6.30)#44 | 8.1%(+4.58)#3,426 |
| 45. | Conde | 12.5% | 6.3%(+6.15)#45 | 8.1%(+4.43)#3,561 |
| 46. | Brandon | 11.9% | 6.3%(+5.58)#46 | 8.1%(+3.86)#3,868 |
| 47. | Boulder Canyon | 11.9% | 6.3%(+5.57)#47 | 8.1%(+3.85)#3,870 |
| 48. | Beresford | 11.7% | 6.3%(+5.30)#48 | 8.1%(+3.58)#4,037 |
| 49. | Richland | 11.5% | 6.3%(+5.19)#49 | 8.1%(+3.47)#4,131 |
| 50. | Winner | 11.3% | 6.3%(+4.91)#50 | 8.1%(+3.19)#4,313 |
| 51. | Ramona | 11.1% | 6.3%(+4.77)#51 | 8.1%(+3.04)#4,457 |
| 52. | Gary | 11.1% | 6.3%(+4.77)#52 | 8.1%(+3.04)#4,458 |
| 53. | Dell Rapids | 11.1% | 6.3%(+4.74)#53 | 8.1%(+3.01)#4,495 |
| 54. | North Eagle Butte | 10.9% | 6.3%(+4.52)#54 | 8.1%(+2.80)#4,647 |
| 55. | Freeman | 10.7% | 6.3%(+4.40)#55 | 8.1%(+2.68)#4,748 |
| 56. | Toronto | 10.7% | 6.3%(+4.37)#56 | 8.1%(+2.64)#4,797 |
| 57. | Green Valley | 10.6% | 6.3%(+4.25)#57 | 8.1%(+2.53)#4,897 |
| 58. | Wagner | 10.2% | 6.3%(+3.82)#58 | 8.1%(+2.10)#5,294 |
| 59. | Warner | 10.1% | 6.3%(+3.76)#59 | 8.1%(+2.03)#5,363 |
| 60. | Lake Madison | 10.0% | 6.3%(+3.68)#60 | 8.1%(+1.95)#5,411 |
| 61. | Hosmer | 9.9% | 6.3%(+3.53)#61 | 8.1%(+1.81)#5,596 |
| 62. | Summerset | 9.5% | 6.3%(+3.20)#62 | 8.1%(+1.48)#5,953 |
| 63. | Spearfish | 9.4% | 6.3%(+3.09)#63 | 8.1%(+1.36)#6,088 |
| 64. | Watertown | 9.2% | 6.3%(+2.90)#64 | 8.1%(+1.18)#6,295 |
| 65. | Gettysburg | 9.1% | 6.3%(+2.78)#65 | 8.1%(+1.05)#6,442 |
| 66. | Presho | 9.1% | 6.3%(+2.75)#66 | 8.1%(+1.02)#6,495 |
| 67. | Hecla | 9.1% | 6.3%(+2.75)#67 | 8.1%(+1.02)#6,502 |
| 68. | Andover | 9.1% | 6.3%(+2.75)#68 | 8.1%(+1.02)#6,523 |
| 69. | Kennebec | 9.0% | 6.3%(+2.61)#69 | 8.1%(+0.884)#6,660 |
| 70. | Vermillion | 8.9% | 6.3%(+2.59)#70 | 8.1%(+0.866)#6,676 |
| 71. | Prairiewood | 8.8% | 6.3%(+2.48)#71 | 8.1%(+0.752)#6,814 |
| 72. | Emery | 8.7% | 6.3%(+2.40)#72 | 8.1%(+0.679)#6,902 |
| 73. | Edgemont | 8.7% | 6.3%(+2.35)#73 | 8.1%(+0.625)#6,970 |
| 74. | Bruce | 8.7% | 6.3%(+2.35)#74 | 8.1%(+0.625)#6,988 |
| 75. | De Smet | 8.3% | 6.3%(+1.99)#75 | 8.1%(+0.262)#7,420 |
| 76. | Bridgewater | 8.3% | 6.3%(+1.99)#76 | 8.1%(+0.262)#7,437 |
| 77. | Pierpont | 8.3% | 6.3%(+1.99)#77 | 8.1%(+0.262)#7,466 |
| 78. | Pine Lakes Addition | 8.2% | 6.3%(+1.90)#78 | 8.1%(+0.171)#7,574 |
| 79. | Veblen | 8.2% | 6.3%(+1.85)#79 | 8.1%(+0.126)#7,644 |
| 80. | Estelline | 8.0% | 6.3%(+1.68)#80 | 8.1%(-0.042)#7,891 |
| 81. | Brookings | 8.0% | 6.3%(+1.68)#81 | 8.1%(-0.050)#7,907 |
| 82. | Deadwood | 7.9% | 6.3%(+1.52)#82 | 8.1%(-0.206)#8,153 |
| 83. | Rapid City | 7.7% | 6.3%(+1.40)#83 | 8.1%(-0.324)#8,349 |
| 84. | Harrold | 7.7% | 6.3%(+1.35)#84 | 8.1%(-0.379)#8,470 |
| 85. | Blackhawk | 7.6% | 6.3%(+1.29)#85 | 8.1%(-0.434)#8,544 |
| 86. | Murdo | 7.5% | 6.3%(+1.12)#86 | 8.1%(-0.608)#8,813 |
| 87. | Eagle Butte | 7.4% | 6.3%(+1.06)#87 | 8.1%(-0.664)#8,882 |
| 88. | Aurora | 7.3% | 6.3%(+0.984)#88 | 8.1%(-0.741)#9,016 |
| 89. | Madison | 7.2% | 6.3%(+0.847)#89 | 8.1%(-0.878)#9,241 |
| 90. | Groton | 7.1% | 6.3%(+0.797)#90 | 8.1%(-0.928)#9,298 |
| 91. | Pollock | 7.1% | 6.3%(+0.797)#91 | 8.1%(-0.928)#9,331 |
| 92. | Faulkton | 7.1% | 6.3%(+0.725)#92 | 8.1%(-1.00)#9,447 |
| 93. | Wolsey | 7.0% | 6.3%(+0.654)#93 | 8.1%(-1.07)#9,567 |
| 94. | Ipswich | 6.9% | 6.3%(+0.533)#94 | 8.1%(-1.19)#9,746 |
| 95. | Sioux Falls | 6.8% | 6.3%(+0.483)#95 | 8.1%(-1.24)#9,811 |
| 96. | Mina | 6.8% | 6.3%(+0.428)#96 | 8.1%(-1.30)#9,903 |
| 97. | Colonial Pine Hills | 6.7% | 6.3%(+0.400)#97 | 8.1%(-1.33)#9,950 |
| 98. | Fort Pierre | 6.7% | 6.3%(+0.321)#98 | 8.1%(-1.40)#10,054 |
| 99. | Leola | 6.6% | 6.3%(+0.212)#99 | 8.1%(-1.51)#10,272 |
| 100. | Hermosa | 6.5% | 6.3%(+0.106)#100 | 8.1%(-1.62)#10,459 |
Common Questions
What are the Top 10 Cities with the Highest Percentage of Population with a Degree in Social Sciences in South Dakota?
Top 10 Cities with the Highest Percentage of Population with a Degree in Social Sciences in South Dakota are:
#1
82.1%
#2
73.7%
#3
66.7%
#4
66.7%
#5
41.2%
#6
40.0%
#7
39.3%
#8
38.6%
#9
33.3%
#10
33.3%
What city has the Highest Percentage of Population with a Degree in Social Sciences in South Dakota?
Eden has the Highest Percentage of Population with a Degree in Social Sciences in South Dakota with 82.1%.
What is the Percentage of Population with a Degree in Social Sciences in the State of South Dakota?
Percentage of Population with a Degree in Social Sciences in South Dakota is 6.3%.
What is the Percentage of Population with a Degree in Social Sciences in the United States?
Percentage of Population with a Degree in Social Sciences in the United States is 8.1%.