Cities with the Highest Percentage of Nicaraguan Population in Virginia
RELATED REPORTS & OPTIONS
Nicaraguan
Virginia
Compare Cities
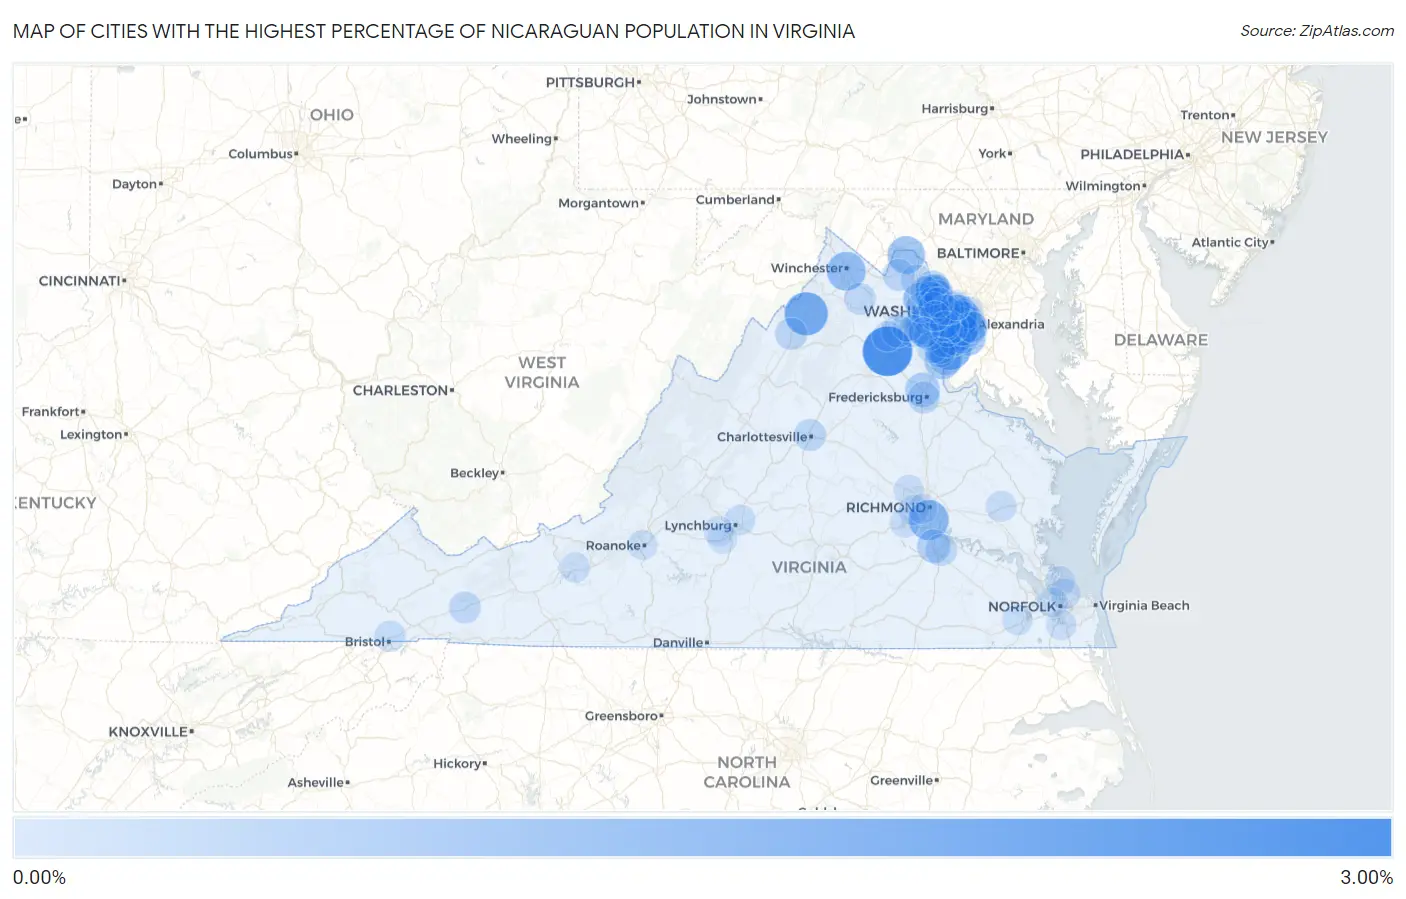
Map of Cities with the Highest Percentage of Nicaraguan Population in Virginia
0.00%
3.00%
Cities with the Highest Percentage of Nicaraguan Population in Virginia
| City | Nicaraguan | vs State | vs National | |
| 1. | Opal | 2.91% | 0.14%(+2.77)#1 | 0.13%(+2.78)#92 |
| 2. | Moorefield | 2.11% | 0.14%(+1.98)#2 | 0.13%(+1.98)#136 |
| 3. | Woodstock | 1.95% | 0.14%(+1.81)#3 | 0.13%(+1.82)#148 |
| 4. | Woodbridge | 1.79% | 0.14%(+1.65)#4 | 0.13%(+1.65)#167 |
| 5. | West Falls Church | 1.58% | 0.14%(+1.44)#5 | 0.13%(+1.44)#193 |
| 6. | Bensley | 1.48% | 0.14%(+1.34)#6 | 0.13%(+1.34)#211 |
| 7. | Manassas Park | 1.36% | 0.14%(+1.22)#7 | 0.13%(+1.23)#241 |
| 8. | Annandale | 1.35% | 0.14%(+1.21)#8 | 0.13%(+1.22)#244 |
| 9. | Winchester | 1.27% | 0.14%(+1.14)#9 | 0.13%(+1.14)#259 |
| 10. | Lovettsville | 1.13% | 0.14%(+0.988)#10 | 0.13%(+0.992)#289 |
| 11. | Newington Forest | 1.11% | 0.14%(+0.969)#11 | 0.13%(+0.974)#296 |
| 12. | Mount Vernon | 0.99% | 0.14%(+0.848)#12 | 0.13%(+0.852)#321 |
| 13. | Sterling | 0.94% | 0.14%(+0.806)#13 | 0.13%(+0.810)#335 |
| 14. | Newington | 0.94% | 0.14%(+0.799)#14 | 0.13%(+0.803)#339 |
| 15. | Triangle | 0.87% | 0.14%(+0.735)#15 | 0.13%(+0.739)#370 |
| 16. | Sudley | 0.87% | 0.14%(+0.733)#16 | 0.13%(+0.738)#371 |
| 17. | Franconia | 0.79% | 0.14%(+0.650)#17 | 0.13%(+0.654)#408 |
| 18. | Loudoun Valley Estates | 0.72% | 0.14%(+0.585)#18 | 0.13%(+0.590)#435 |
| 19. | Southern Gateway | 0.71% | 0.14%(+0.568)#19 | 0.13%(+0.572)#445 |
| 20. | Rose Hill Cdp Fairfax County | 0.64% | 0.14%(+0.504)#20 | 0.13%(+0.508)#485 |
| 21. | Dulles Town Center | 0.56% | 0.14%(+0.423)#21 | 0.13%(+0.428)#539 |
| 22. | George Mason | 0.56% | 0.14%(+0.422)#22 | 0.13%(+0.426)#541 |
| 23. | Groveton | 0.55% | 0.14%(+0.417)#23 | 0.13%(+0.421)#546 |
| 24. | Countryside | 0.55% | 0.14%(+0.412)#24 | 0.13%(+0.416)#548 |
| 25. | Colonial Heights | 0.54% | 0.14%(+0.402)#25 | 0.13%(+0.406)#559 |
| 26. | Cherry Hill | 0.54% | 0.14%(+0.400)#26 | 0.13%(+0.404)#561 |
| 27. | Centreville | 0.48% | 0.14%(+0.343)#27 | 0.13%(+0.347)#618 |
| 28. | Herndon | 0.47% | 0.14%(+0.337)#28 | 0.13%(+0.341)#626 |
| 29. | Occoquan | 0.47% | 0.14%(+0.329)#29 | 0.13%(+0.333)#633 |
| 30. | Sugarland Run | 0.43% | 0.14%(+0.292)#30 | 0.13%(+0.296)#673 |
| 31. | Seven Corners | 0.42% | 0.14%(+0.278)#31 | 0.13%(+0.282)#683 |
| 32. | Dale City | 0.41% | 0.14%(+0.276)#32 | 0.13%(+0.281)#688 |
| 33. | Alexandria | 0.40% | 0.14%(+0.267)#33 | 0.13%(+0.272)#701 |
| 34. | Woodlawn Cdp Fairfax County | 0.40% | 0.14%(+0.259)#34 | 0.13%(+0.263)#710 |
| 35. | New Baltimore | 0.39% | 0.14%(+0.254)#35 | 0.13%(+0.258)#714 |
| 36. | Fort Belvoir | 0.38% | 0.14%(+0.246)#36 | 0.13%(+0.251)#722 |
| 37. | Merrifield | 0.37% | 0.14%(+0.234)#37 | 0.13%(+0.238)#736 |
| 38. | Chantilly | 0.37% | 0.14%(+0.230)#38 | 0.13%(+0.235)#742 |
| 39. | Idylwood | 0.35% | 0.14%(+0.211)#39 | 0.13%(+0.215)#767 |
| 40. | Purcellville | 0.35% | 0.14%(+0.210)#40 | 0.13%(+0.214)#772 |
| 41. | Lake Ridge | 0.35% | 0.14%(+0.209)#41 | 0.13%(+0.213)#774 |
| 42. | Linton Hall | 0.34% | 0.14%(+0.207)#42 | 0.13%(+0.211)#783 |
| 43. | Mount Jackson | 0.33% | 0.14%(+0.190)#43 | 0.13%(+0.194)#812 |
| 44. | Charlottesville | 0.33% | 0.14%(+0.189)#44 | 0.13%(+0.193)#817 |
| 45. | Dranesville | 0.32% | 0.14%(+0.183)#45 | 0.13%(+0.188)#829 |
| 46. | Fredericksburg | 0.32% | 0.14%(+0.181)#46 | 0.13%(+0.185)#832 |
| 47. | Fort Lee | 0.30% | 0.14%(+0.166)#47 | 0.13%(+0.170)#861 |
| 48. | Marion | 0.30% | 0.14%(+0.160)#48 | 0.13%(+0.164)#875 |
| 49. | Bailey S Crossroads | 0.29% | 0.14%(+0.153)#49 | 0.13%(+0.157)#890 |
| 50. | Arlington | 0.29% | 0.14%(+0.150)#50 | 0.13%(+0.155)#893 |
| 51. | Brambleton | 0.29% | 0.14%(+0.148)#51 | 0.13%(+0.152)#898 |
| 52. | Shenandoah Farms | 0.28% | 0.14%(+0.143)#52 | 0.13%(+0.147)#913 |
| 53. | Fairfax Station | 0.28% | 0.14%(+0.139)#53 | 0.13%(+0.144)#918 |
| 54. | Independent Hill | 0.25% | 0.14%(+0.116)#54 | 0.13%(+0.120)#971 |
| 55. | Lincolnia | 0.25% | 0.14%(+0.115)#55 | 0.13%(+0.119)#974 |
| 56. | Oak Grove | 0.24% | 0.14%(+0.099)#56 | 0.13%(+0.104)#1,017 |
| 57. | Union Mill | 0.23% | 0.14%(+0.095)#57 | 0.13%(+0.099)#1,029 |
| 58. | Lake Barcroft | 0.22% | 0.14%(+0.080)#58 | 0.13%(+0.084)#1,073 |
| 59. | Bristol | 0.21% | 0.14%(+0.074)#59 | 0.13%(+0.078)#1,084 |
| 60. | Lorton | 0.21% | 0.14%(+0.071)#60 | 0.13%(+0.075)#1,097 |
| 61. | Huntington | 0.21% | 0.14%(+0.071)#61 | 0.13%(+0.075)#1,099 |
| 62. | Kingstowne | 0.20% | 0.14%(+0.065)#62 | 0.13%(+0.070)#1,118 |
| 63. | Buckhall | 0.20% | 0.14%(+0.062)#63 | 0.13%(+0.066)#1,136 |
| 64. | Leesburg | 0.19% | 0.14%(+0.056)#64 | 0.13%(+0.061)#1,154 |
| 65. | Belle Haven | 0.17% | 0.14%(+0.035)#65 | 0.13%(+0.040)#1,222 |
| 66. | South Run | 0.17% | 0.14%(+0.035)#66 | 0.13%(+0.040)#1,223 |
| 67. | Tysons | 0.17% | 0.14%(+0.033)#67 | 0.13%(+0.037)#1,230 |
| 68. | West Springfield | 0.16% | 0.14%(+0.025)#68 | 0.13%(+0.029)#1,264 |
| 69. | Fair Oaks | 0.16% | 0.14%(+0.025)#69 | 0.13%(+0.029)#1,265 |
| 70. | Kings Park West | 0.16% | 0.14%(+0.021)#70 | 0.13%(+0.025)#1,279 |
| 71. | West Point | 0.15% | 0.14%(+0.010)#71 | 0.13%(+0.014)#1,323 |
| 72. | Madison Heights | 0.13% | 0.14%(-0.007)#72 | 0.13%(-0.002)#1,384 |
| 73. | Gainesville | 0.13% | 0.14%(-0.008)#73 | 0.13%(-0.004)#1,389 |
| 74. | South Riding | 0.13% | 0.14%(-0.009)#74 | 0.13%(-0.004)#1,393 |
| 75. | Warrenton | 0.12% | 0.14%(-0.019)#75 | 0.13%(-0.015)#1,437 |
| 76. | Short Pump | 0.12% | 0.14%(-0.021)#76 | 0.13%(-0.017)#1,450 |
| 77. | Norfolk | 0.11% | 0.14%(-0.026)#77 | 0.13%(-0.022)#1,477 |
| 78. | Mcnair | 0.099% | 0.14%(-0.038)#78 | 0.13%(-0.034)#1,538 |
| 79. | Brandermill | 0.098% | 0.14%(-0.040)#79 | 0.13%(-0.035)#1,545 |
| 80. | Vienna | 0.098% | 0.14%(-0.040)#80 | 0.13%(-0.036)#1,549 |
| 81. | Ashburn | 0.097% | 0.14%(-0.041)#81 | 0.13%(-0.037)#1,556 |
| 82. | Oakton | 0.096% | 0.14%(-0.042)#82 | 0.13%(-0.037)#1,563 |
| 83. | Franklin Farm | 0.095% | 0.14%(-0.042)#83 | 0.13%(-0.038)#1,568 |
| 84. | Chesapeake | 0.091% | 0.14%(-0.047)#84 | 0.13%(-0.043)#1,598 |
| 85. | Hampton | 0.081% | 0.14%(-0.057)#85 | 0.13%(-0.052)#1,661 |
| 86. | Radford | 0.079% | 0.14%(-0.058)#86 | 0.13%(-0.054)#1,674 |
| 87. | Suffolk | 0.077% | 0.14%(-0.061)#87 | 0.13%(-0.056)#1,693 |
| 88. | Cascades | 0.072% | 0.14%(-0.066)#88 | 0.13%(-0.062)#1,734 |
| 89. | Forest | 0.069% | 0.14%(-0.068)#89 | 0.13%(-0.064)#1,754 |
| 90. | Reston | 0.069% | 0.14%(-0.069)#90 | 0.13%(-0.064)#1,758 |
| 91. | Portsmouth | 0.069% | 0.14%(-0.069)#91 | 0.13%(-0.065)#1,760 |
| 92. | Burke Centre | 0.067% | 0.14%(-0.071)#92 | 0.13%(-0.066)#1,774 |
| 93. | Montclair | 0.063% | 0.14%(-0.074)#93 | 0.13%(-0.070)#1,813 |
| 94. | Bon Air | 0.063% | 0.14%(-0.074)#94 | 0.13%(-0.070)#1,817 |
| 95. | Mclean | 0.058% | 0.14%(-0.079)#95 | 0.13%(-0.075)#1,847 |
| 96. | Fair Lakes | 0.056% | 0.14%(-0.081)#96 | 0.13%(-0.077)#1,865 |
| 97. | Richmond | 0.055% | 0.14%(-0.082)#97 | 0.13%(-0.078)#1,870 |
| 98. | Timberlake | 0.054% | 0.14%(-0.084)#98 | 0.13%(-0.079)#1,887 |
| 99. | Roanoke | 0.053% | 0.14%(-0.084)#99 | 0.13%(-0.080)#1,892 |
| 100. | Manassas | 0.052% | 0.14%(-0.086)#100 | 0.13%(-0.082)#1,908 |
Common Questions
What are the Top 10 Cities with the Highest Percentage of Nicaraguan Population in Virginia?
Top 10 Cities with the Highest Percentage of Nicaraguan Population in Virginia are:
#1
2.91%
#2
1.95%
#3
1.79%
#4
1.58%
#5
1.48%
#6
1.36%
#7
1.35%
#8
1.27%
#9
1.13%
#10
1.11%
What city has the Highest Percentage of Nicaraguan Population in Virginia?
Opal has the Highest Percentage of Nicaraguan Population in Virginia with 2.91%.
What is the Percentage of Nicaraguan Population in the State of Virginia?
Percentage of Nicaraguan Population in Virginia is 0.14%.
What is the Percentage of Nicaraguan Population in the United States?
Percentage of Nicaraguan Population in the United States is 0.13%.