Cities with the Highest Percentage of Nicaraguan Population in New York
RELATED REPORTS & OPTIONS
Nicaraguan
New York
Compare Cities
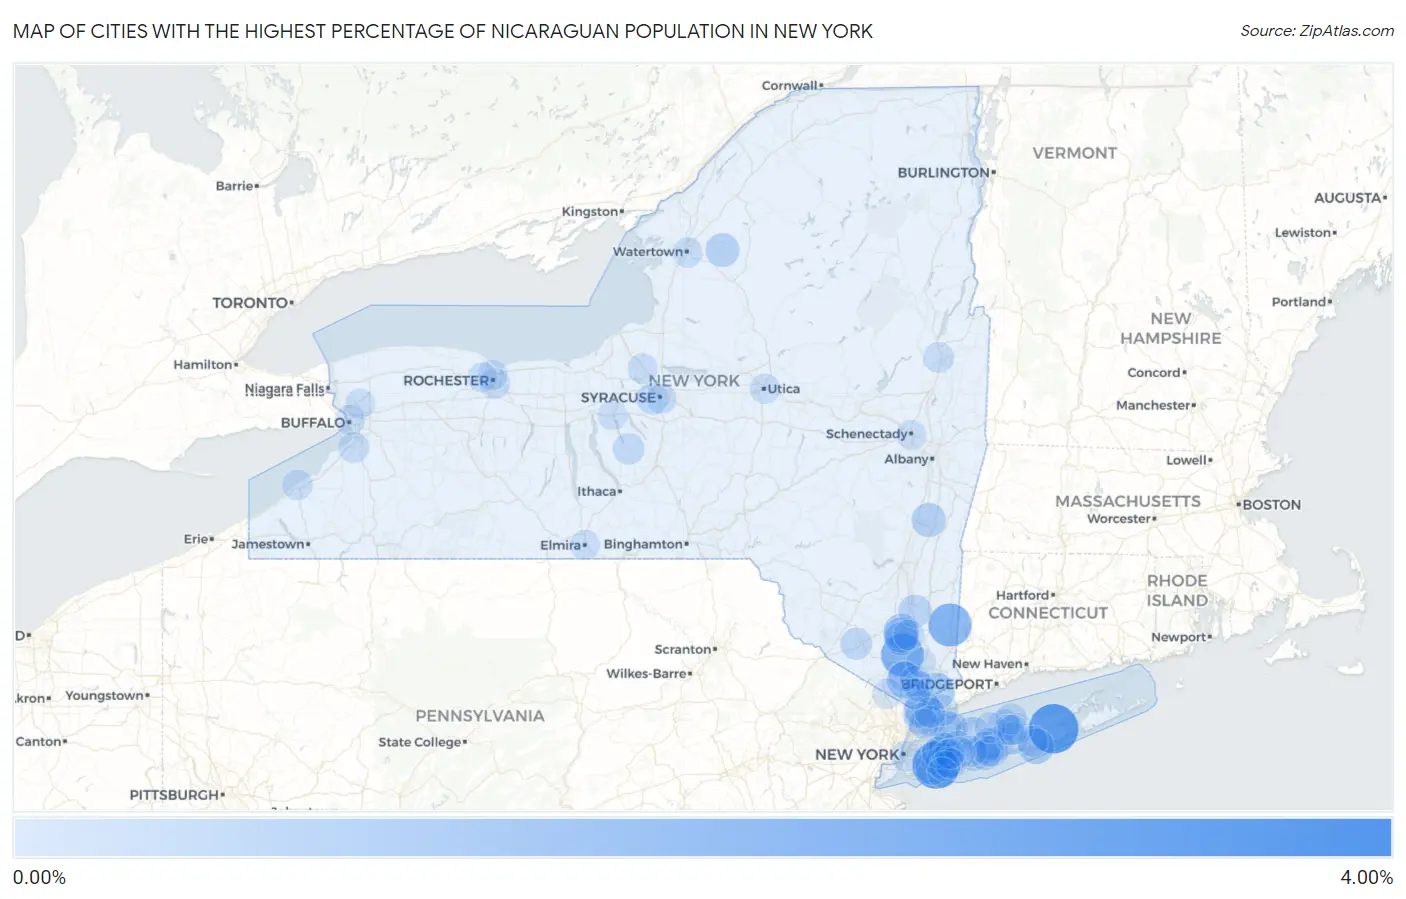
Map of Cities with the Highest Percentage of Nicaraguan Population in New York
0.00%
4.00%
Cities with the Highest Percentage of Nicaraguan Population in New York
| City | Nicaraguan | vs State | vs National | |
| 1. | Barrytown | 3.60% | 0.080%(+3.52)#1 | 0.13%(+3.47)#71 |
| 2. | Northampton | 2.99% | 0.080%(+2.91)#2 | 0.13%(+2.86)#89 |
| 3. | Woodmere | 2.69% | 0.080%(+2.61)#3 | 0.13%(+2.55)#99 |
| 4. | Pawling | 1.98% | 0.080%(+1.90)#4 | 0.13%(+1.85)#145 |
| 5. | West Point | 1.96% | 0.080%(+1.88)#5 | 0.13%(+1.82)#147 |
| 6. | Armonk | 1.05% | 0.080%(+0.970)#6 | 0.13%(+0.917)#306 |
| 7. | West Haverstraw | 0.98% | 0.080%(+0.896)#7 | 0.13%(+0.843)#325 |
| 8. | Ardsley | 0.88% | 0.080%(+0.797)#8 | 0.13%(+0.744)#369 |
| 9. | Mastic Beach | 0.83% | 0.080%(+0.753)#9 | 0.13%(+0.701)#387 |
| 10. | Balmville | 0.77% | 0.080%(+0.687)#10 | 0.13%(+0.634)#415 |
| 11. | Newburgh | 0.75% | 0.080%(+0.667)#11 | 0.13%(+0.614)#420 |
| 12. | North Valley Stream | 0.69% | 0.080%(+0.608)#12 | 0.13%(+0.556)#453 |
| 13. | Inwood | 0.68% | 0.080%(+0.601)#13 | 0.13%(+0.548)#458 |
| 14. | Hudson | 0.61% | 0.080%(+0.527)#14 | 0.13%(+0.474)#506 |
| 15. | Huntington Station | 0.56% | 0.080%(+0.480)#15 | 0.13%(+0.428)#538 |
| 16. | Carthage | 0.56% | 0.080%(+0.479)#16 | 0.13%(+0.426)#542 |
| 17. | Central Islip | 0.53% | 0.080%(+0.448)#17 | 0.13%(+0.395)#573 |
| 18. | Locust Valley | 0.53% | 0.080%(+0.446)#18 | 0.13%(+0.393)#575 |
| 19. | New Windsor | 0.49% | 0.080%(+0.409)#19 | 0.13%(+0.356)#612 |
| 20. | Spackenkill | 0.44% | 0.080%(+0.358)#20 | 0.13%(+0.305)#666 |
| 21. | Garden City Park | 0.33% | 0.080%(+0.254)#21 | 0.13%(+0.201)#800 |
| 22. | North Lindenhurst | 0.30% | 0.080%(+0.224)#22 | 0.13%(+0.171)#856 |
| 23. | Stony Brook | 0.30% | 0.080%(+0.216)#23 | 0.13%(+0.163)#879 |
| 24. | Mineola | 0.28% | 0.080%(+0.201)#24 | 0.13%(+0.148)#909 |
| 25. | Middletown | 0.28% | 0.080%(+0.198)#25 | 0.13%(+0.145)#916 |
| 26. | Glen Cove | 0.27% | 0.080%(+0.193)#26 | 0.13%(+0.140)#925 |
| 27. | Lynbrook | 0.25% | 0.080%(+0.171)#27 | 0.13%(+0.118)#977 |
| 28. | Brentwood | 0.25% | 0.080%(+0.170)#28 | 0.13%(+0.117)#979 |
| 29. | Baywood | 0.25% | 0.080%(+0.170)#29 | 0.13%(+0.117)#980 |
| 30. | Westvale | 0.24% | 0.080%(+0.163)#30 | 0.13%(+0.110)#997 |
| 31. | Holtsville | 0.24% | 0.080%(+0.159)#31 | 0.13%(+0.107)#1,010 |
| 32. | Moravia | 0.21% | 0.080%(+0.134)#32 | 0.13%(+0.081)#1,077 |
| 33. | Islip | 0.21% | 0.080%(+0.134)#33 | 0.13%(+0.081)#1,078 |
| 34. | Floral Park | 0.21% | 0.080%(+0.134)#34 | 0.13%(+0.081)#1,079 |
| 35. | Port Chester | 0.20% | 0.080%(+0.124)#35 | 0.13%(+0.071)#1,112 |
| 36. | Yonkers | 0.19% | 0.080%(+0.106)#36 | 0.13%(+0.054)#1,177 |
| 37. | Hicksville | 0.18% | 0.080%(+0.103)#37 | 0.13%(+0.050)#1,195 |
| 38. | Coram | 0.17% | 0.080%(+0.090)#38 | 0.13%(+0.037)#1,228 |
| 39. | Port Jefferson | 0.16% | 0.080%(+0.082)#39 | 0.13%(+0.029)#1,263 |
| 40. | East Farmingdale | 0.15% | 0.080%(+0.069)#40 | 0.13%(+0.016)#1,317 |
| 41. | Hamburg | 0.14% | 0.080%(+0.063)#41 | 0.13%(+0.010)#1,334 |
| 42. | Hastings On Hudson | 0.14% | 0.080%(+0.062)#42 | 0.13%(+0.009)#1,342 |
| 43. | Croton On Hudson | 0.13% | 0.080%(+0.053)#43 | 0.13%(+0.000)#1,371 |
| 44. | New York | 0.13% | 0.080%(+0.051)#44 | 0.13%(-0.002)#1,385 |
| 45. | Ossining | 0.13% | 0.080%(+0.045)#45 | 0.13%(-0.008)#1,407 |
| 46. | Hempstead | 0.10% | 0.080%(+0.022)#46 | 0.13%(-0.031)#1,526 |
| 47. | Shirley | 0.098% | 0.080%(+0.018)#47 | 0.13%(-0.035)#1,543 |
| 48. | West Islip | 0.096% | 0.080%(+0.015)#48 | 0.13%(-0.038)#1,565 |
| 49. | Upper Nyack | 0.093% | 0.080%(+0.013)#49 | 0.13%(-0.040)#1,584 |
| 50. | Stony Point | 0.088% | 0.080%(+0.007)#50 | 0.13%(-0.046)#1,613 |
| 51. | Beacon | 0.086% | 0.080%(+0.006)#51 | 0.13%(-0.047)#1,621 |
| 52. | Rochester Institute Of Technology | 0.085% | 0.080%(+0.004)#52 | 0.13%(-0.049)#1,633 |
| 53. | Kings Park | 0.084% | 0.080%(+0.003)#53 | 0.13%(-0.050)#1,640 |
| 54. | West Glens Falls | 0.084% | 0.080%(+0.003)#54 | 0.13%(-0.050)#1,641 |
| 55. | Bay Shore | 0.082% | 0.080%(+0.001)#55 | 0.13%(-0.051)#1,653 |
| 56. | Dunkirk | 0.071% | 0.080%(-0.009)#56 | 0.13%(-0.062)#1,739 |
| 57. | Suffern | 0.070% | 0.080%(-0.010)#57 | 0.13%(-0.063)#1,745 |
| 58. | Levittown | 0.069% | 0.080%(-0.012)#58 | 0.13%(-0.064)#1,759 |
| 59. | Centereach | 0.066% | 0.080%(-0.015)#59 | 0.13%(-0.067)#1,784 |
| 60. | Selden | 0.064% | 0.080%(-0.016)#60 | 0.13%(-0.069)#1,805 |
| 61. | New Rochelle | 0.061% | 0.080%(-0.020)#61 | 0.13%(-0.073)#1,829 |
| 62. | Mount Vernon | 0.058% | 0.080%(-0.023)#62 | 0.13%(-0.076)#1,850 |
| 63. | Scarsdale | 0.055% | 0.080%(-0.025)#63 | 0.13%(-0.078)#1,871 |
| 64. | Hamilton College | 0.052% | 0.080%(-0.028)#64 | 0.13%(-0.081)#1,901 |
| 65. | Brighton | 0.049% | 0.080%(-0.032)#65 | 0.13%(-0.084)#1,926 |
| 66. | Baldwin | 0.047% | 0.080%(-0.033)#66 | 0.13%(-0.086)#1,944 |
| 67. | Rochester | 0.045% | 0.080%(-0.035)#67 | 0.13%(-0.088)#1,961 |
| 68. | Freeport | 0.043% | 0.080%(-0.037)#68 | 0.13%(-0.090)#1,981 |
| 69. | Phoenix | 0.041% | 0.080%(-0.039)#69 | 0.13%(-0.092)#1,999 |
| 70. | Utica | 0.040% | 0.080%(-0.040)#70 | 0.13%(-0.093)#2,008 |
| 71. | Watertown | 0.036% | 0.080%(-0.044)#71 | 0.13%(-0.097)#2,043 |
| 72. | Auburn | 0.034% | 0.080%(-0.047)#72 | 0.13%(-0.100)#2,065 |
| 73. | University At Buffalo | 0.032% | 0.080%(-0.048)#73 | 0.13%(-0.101)#2,079 |
| 74. | Syracuse | 0.032% | 0.080%(-0.048)#74 | 0.13%(-0.101)#2,080 |
| 75. | Oceanside | 0.032% | 0.080%(-0.049)#75 | 0.13%(-0.102)#2,083 |
| 76. | Uniondale | 0.021% | 0.080%(-0.059)#76 | 0.13%(-0.112)#2,174 |
| 77. | Long Beach | 0.017% | 0.080%(-0.063)#77 | 0.13%(-0.116)#2,210 |
| 78. | Lake Mohegan | 0.017% | 0.080%(-0.064)#78 | 0.13%(-0.116)#2,214 |
| 79. | Buffalo | 0.013% | 0.080%(-0.067)#79 | 0.13%(-0.120)#2,250 |
| 80. | Schenectady | 0.010% | 0.080%(-0.070)#80 | 0.13%(-0.123)#2,274 |
| 81. | North Gates | 0.0099% | 0.080%(-0.071)#81 | 0.13%(-0.123)#2,278 |
| 82. | Elmira | 0.0038% | 0.080%(-0.077)#82 | 0.13%(-0.130)#2,319 |
Common Questions
What are the Top 10 Cities with the Highest Percentage of Nicaraguan Population in New York?
Top 10 Cities with the Highest Percentage of Nicaraguan Population in New York are:
#1
2.99%
#2
2.69%
#3
1.98%
#4
1.96%
#5
1.05%
#6
0.98%
#7
0.88%
#8
0.83%
#9
0.77%
#10
0.75%
What city has the Highest Percentage of Nicaraguan Population in New York?
Northampton has the Highest Percentage of Nicaraguan Population in New York with 2.99%.
What is the Percentage of Nicaraguan Population in the State of New York?
Percentage of Nicaraguan Population in New York is 0.080%.
What is the Percentage of Nicaraguan Population in the United States?
Percentage of Nicaraguan Population in the United States is 0.13%.