Cities with the Highest Percentage of Nicaraguan Population in Illinois
RELATED REPORTS & OPTIONS
Nicaraguan
Illinois
Compare Cities
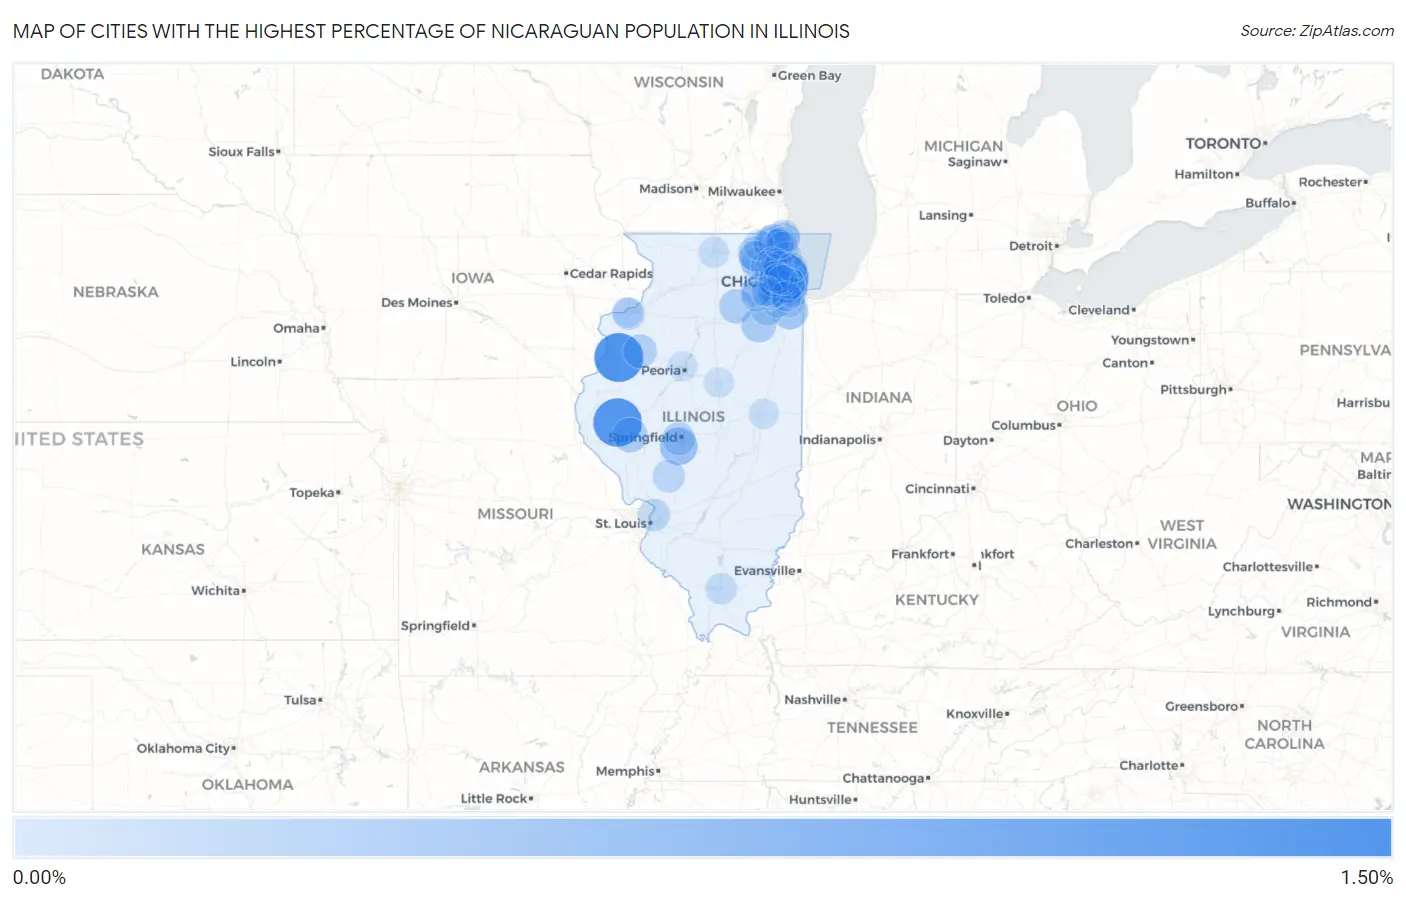
Map of Cities with the Highest Percentage of Nicaraguan Population in Illinois
0.00%
1.50%
Cities with the Highest Percentage of Nicaraguan Population in Illinois
| City | Nicaraguan | vs State | vs National | |
| 1. | River Grove | 1.41% | 0.032%(+1.38)#1 | 0.13%(+1.28)#222 |
| 2. | Kirkwood | 1.36% | 0.032%(+1.33)#2 | 0.13%(+1.23)#242 |
| 3. | Mount Sterling | 1.33% | 0.032%(+1.30)#3 | 0.13%(+1.20)#246 |
| 4. | Berwyn | 0.78% | 0.032%(+0.750)#4 | 0.13%(+0.648)#412 |
| 5. | Chatham | 0.54% | 0.032%(+0.509)#5 | 0.13%(+0.407)#558 |
| 6. | Richton Park | 0.43% | 0.032%(+0.401)#6 | 0.13%(+0.299)#669 |
| 7. | Berkeley | 0.34% | 0.032%(+0.309)#7 | 0.13%(+0.207)#788 |
| 8. | Meredosia | 0.33% | 0.032%(+0.295)#8 | 0.13%(+0.193)#816 |
| 9. | Coal City | 0.33% | 0.032%(+0.294)#9 | 0.13%(+0.192)#819 |
| 10. | Wheaton | 0.32% | 0.032%(+0.293)#10 | 0.13%(+0.191)#824 |
| 11. | Algonquin | 0.30% | 0.032%(+0.266)#11 | 0.13%(+0.164)#873 |
| 12. | Sheridan | 0.30% | 0.032%(+0.265)#12 | 0.13%(+0.164)#876 |
| 13. | Crystal Lake | 0.29% | 0.032%(+0.258)#13 | 0.13%(+0.156)#891 |
| 14. | Galesburg | 0.26% | 0.032%(+0.229)#14 | 0.13%(+0.127)#957 |
| 15. | Hainesville | 0.25% | 0.032%(+0.222)#15 | 0.13%(+0.120)#970 |
| 16. | Lyons | 0.25% | 0.032%(+0.221)#16 | 0.13%(+0.119)#973 |
| 17. | Rockdale | 0.25% | 0.032%(+0.214)#17 | 0.13%(+0.112)#990 |
| 18. | Round Lake Beach | 0.21% | 0.032%(+0.174)#18 | 0.13%(+0.072)#1,107 |
| 19. | Leland Grove | 0.20% | 0.032%(+0.171)#19 | 0.13%(+0.070)#1,119 |
| 20. | Glendale Heights | 0.19% | 0.032%(+0.159)#20 | 0.13%(+0.057)#1,160 |
| 21. | Zion | 0.19% | 0.032%(+0.156)#21 | 0.13%(+0.054)#1,175 |
| 22. | Forest View | 0.19% | 0.032%(+0.154)#22 | 0.13%(+0.052)#1,183 |
| 23. | Cicero | 0.18% | 0.032%(+0.153)#23 | 0.13%(+0.051)#1,192 |
| 24. | Carlinville | 0.17% | 0.032%(+0.143)#24 | 0.13%(+0.041)#1,216 |
| 25. | West Dundee | 0.17% | 0.032%(+0.134)#25 | 0.13%(+0.032)#1,246 |
| 26. | Beach Park | 0.16% | 0.032%(+0.133)#26 | 0.13%(+0.031)#1,248 |
| 27. | Granite City | 0.16% | 0.032%(+0.131)#27 | 0.13%(+0.029)#1,261 |
| 28. | Milan | 0.16% | 0.032%(+0.126)#28 | 0.13%(+0.025)#1,283 |
| 29. | Northlake | 0.15% | 0.032%(+0.118)#29 | 0.13%(+0.016)#1,312 |
| 30. | Lindenhurst | 0.15% | 0.032%(+0.114)#30 | 0.13%(+0.012)#1,327 |
| 31. | Summit | 0.14% | 0.032%(+0.104)#31 | 0.13%(+0.003)#1,365 |
| 32. | Elk Grove Village | 0.12% | 0.032%(+0.092)#32 | 0.13%(-0.010)#1,418 |
| 33. | North Chicago | 0.12% | 0.032%(+0.091)#33 | 0.13%(-0.010)#1,419 |
| 34. | Oak Forest | 0.12% | 0.032%(+0.090)#34 | 0.13%(-0.012)#1,424 |
| 35. | Broadview | 0.11% | 0.032%(+0.082)#35 | 0.13%(-0.020)#1,469 |
| 36. | Highland Park | 0.096% | 0.032%(+0.064)#36 | 0.13%(-0.037)#1,560 |
| 37. | Marion | 0.089% | 0.032%(+0.057)#37 | 0.13%(-0.044)#1,607 |
| 38. | Aurora | 0.084% | 0.032%(+0.053)#38 | 0.13%(-0.049)#1,636 |
| 39. | Waukegan | 0.076% | 0.032%(+0.044)#39 | 0.13%(-0.057)#1,699 |
| 40. | Homer Glen | 0.061% | 0.032%(+0.030)#40 | 0.13%(-0.072)#1,825 |
| 41. | Schaumburg | 0.054% | 0.032%(+0.023)#41 | 0.13%(-0.079)#1,885 |
| 42. | Darien | 0.050% | 0.032%(+0.019)#42 | 0.13%(-0.083)#1,919 |
| 43. | Lake In The Hills | 0.048% | 0.032%(+0.017)#43 | 0.13%(-0.085)#1,933 |
| 44. | Oak Park | 0.045% | 0.032%(+0.013)#44 | 0.13%(-0.089)#1,970 |
| 45. | Hoffman Estates | 0.043% | 0.032%(+0.011)#45 | 0.13%(-0.091)#1,987 |
| 46. | Bolingbrook | 0.041% | 0.032%(+0.009)#46 | 0.13%(-0.093)#2,003 |
| 47. | Evergreen Park | 0.041% | 0.032%(+0.009)#47 | 0.13%(-0.093)#2,005 |
| 48. | Montgomery | 0.039% | 0.032%(+0.007)#48 | 0.13%(-0.095)#2,024 |
| 49. | Oswego | 0.037% | 0.032%(+0.006)#49 | 0.13%(-0.096)#2,032 |
| 50. | Rockford | 0.037% | 0.032%(+0.006)#50 | 0.13%(-0.096)#2,035 |
| 51. | Mchenry | 0.036% | 0.032%(+0.005)#51 | 0.13%(-0.097)#2,040 |
| 52. | Woodridge | 0.035% | 0.032%(+0.004)#52 | 0.13%(-0.098)#2,048 |
| 53. | Chicago | 0.035% | 0.032%(+0.003)#53 | 0.13%(-0.098)#2,050 |
| 54. | Palatine | 0.034% | 0.032%(+0.003)#54 | 0.13%(-0.099)#2,058 |
| 55. | Lombard | 0.032% | 0.032%(+0.000)#55 | 0.13%(-0.102)#2,082 |
| 56. | Arlington Heights | 0.026% | 0.032%(-0.006)#56 | 0.13%(-0.107)#2,124 |
| 57. | Mount Prospect | 0.023% | 0.032%(-0.008)#57 | 0.13%(-0.110)#2,151 |
| 58. | Gurnee | 0.023% | 0.032%(-0.009)#58 | 0.13%(-0.110)#2,156 |
| 59. | Addison | 0.020% | 0.032%(-0.012)#59 | 0.13%(-0.114)#2,187 |
| 60. | Palos Heights | 0.017% | 0.032%(-0.015)#60 | 0.13%(-0.117)#2,217 |
| 61. | Rock Island | 0.016% | 0.032%(-0.015)#61 | 0.13%(-0.117)#2,222 |
| 62. | Urbana | 0.015% | 0.032%(-0.016)#62 | 0.13%(-0.118)#2,228 |
| 63. | Elmhurst | 0.011% | 0.032%(-0.021)#63 | 0.13%(-0.122)#2,267 |
| 64. | Evanston | 0.010% | 0.032%(-0.021)#64 | 0.13%(-0.123)#2,272 |
| 65. | Normal | 0.0076% | 0.032%(-0.024)#65 | 0.13%(-0.126)#2,295 |
| 66. | Peoria | 0.0062% | 0.032%(-0.025)#66 | 0.13%(-0.127)#2,302 |
| 67. | Bellwood | 0.0054% | 0.032%(-0.026)#67 | 0.13%(-0.128)#2,308 |
| 68. | Naperville | 0.0013% | 0.032%(-0.030)#68 | 0.13%(-0.132)#2,326 |
Common Questions
What are the Top 10 Cities with the Highest Percentage of Nicaraguan Population in Illinois?
Top 10 Cities with the Highest Percentage of Nicaraguan Population in Illinois are:
#1
1.41%
#2
1.36%
#3
1.33%
#4
0.78%
#5
0.54%
#6
0.43%
#7
0.34%
#8
0.33%
#9
0.33%
#10
0.32%
What city has the Highest Percentage of Nicaraguan Population in Illinois?
River Grove has the Highest Percentage of Nicaraguan Population in Illinois with 1.41%.
What is the Percentage of Nicaraguan Population in the State of Illinois?
Percentage of Nicaraguan Population in Illinois is 0.032%.
What is the Percentage of Nicaraguan Population in the United States?
Percentage of Nicaraguan Population in the United States is 0.13%.