Cities with the Highest Poverty Level Among Single Males in Connecticut
RELATED REPORTS & OPTIONS
Highest Poverty | Single Male
Connecticut
Compare Cities
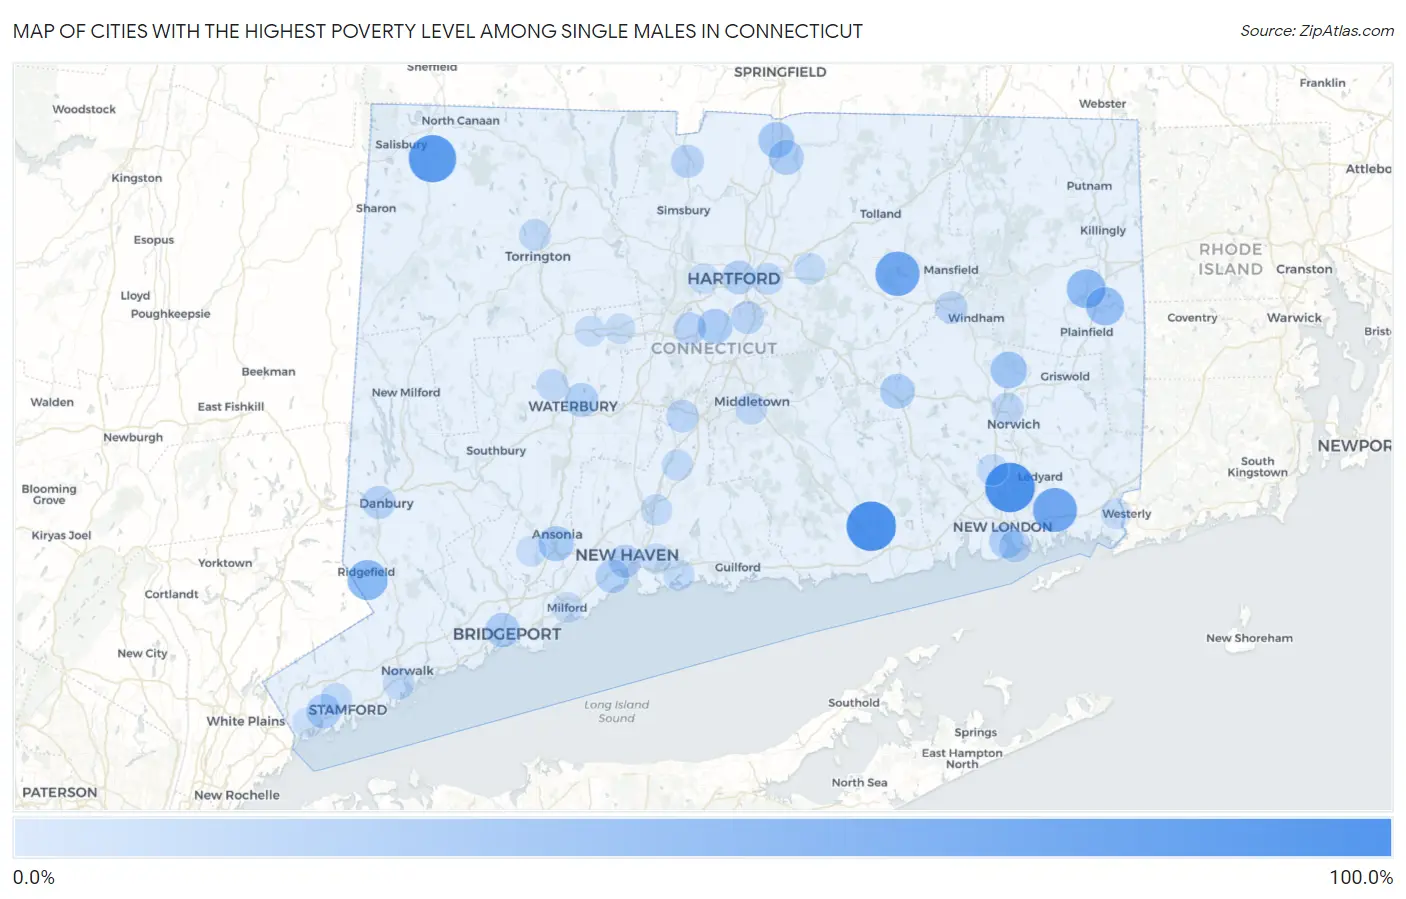
Map of Cities with the Highest Poverty Level Among Single Males in Connecticut
0.0%
100.0%
Cities with the Highest Poverty Level Among Single Males in Connecticut
| City | Single Male Poverty | vs State | vs National | |
| 1. | Essex Village | 100.0% | 10.2%(+89.8)#1 | 12.4%(+87.6)#62 |
| 2. | Gales Ferry | 100.0% | 10.2%(+89.8)#2 | 12.4%(+87.6)#211 |
| 3. | Taylor Corners | 100.0% | 10.2%(+89.8)#3 | 12.4%(+87.6)#382 |
| 4. | Falls Village | 88.7% | 10.2%(+78.5)#4 | 12.4%(+76.3)#959 |
| 5. | Coventry Lake | 72.4% | 10.2%(+62.2)#5 | 12.4%(+60.0)#1,264 |
| 6. | Old Mystic | 71.1% | 10.2%(+60.8)#6 | 12.4%(+58.6)#1,312 |
| 7. | Ridgefield | 50.0% | 10.2%(+39.8)#7 | 12.4%(+37.6)#2,184 |
| 8. | Wauregan | 44.7% | 10.2%(+34.5)#8 | 12.4%(+32.3)#2,670 |
| 9. | Moosup | 41.1% | 10.2%(+30.8)#9 | 12.4%(+28.6)#2,959 |
| 10. | Baltic | 32.6% | 10.2%(+22.4)#10 | 12.4%(+20.2)#3,876 |
| 11. | Noroton | 30.8% | 10.2%(+20.5)#11 | 12.4%(+18.3)#4,067 |
| 12. | Thompsonville | 27.7% | 10.2%(+17.5)#12 | 12.4%(+15.3)#4,489 |
| 13. | Saugatuck | 27.5% | 10.2%(+17.3)#13 | 12.4%(+15.1)#4,512 |
| 14. | Derby | 25.0% | 10.2%(+14.8)#14 | 12.4%(+12.6)#4,818 |
| 15. | Danielson Borough | 24.7% | 10.2%(+14.5)#15 | 12.4%(+12.2)#4,994 |
| 16. | Southwood Acres | 24.2% | 10.2%(+14.0)#16 | 12.4%(+11.8)#5,058 |
| 17. | Newington | 23.9% | 10.2%(+13.7)#17 | 12.4%(+11.5)#5,109 |
| 18. | Colchester | 23.1% | 10.2%(+12.9)#18 | 12.4%(+10.6)#5,226 |
| 19. | Bridgeport | 22.2% | 10.2%(+12.0)#19 | 12.4%(+9.75)#5,425 |
| 20. | Cos Cob | 20.5% | 10.2%(+10.2)#20 | 12.4%(+8.02)#5,728 |
| 21. | New London | 20.2% | 10.2%(+9.94)#21 | 12.4%(+7.72)#5,780 |
| 22. | Ball Pond | 19.8% | 10.2%(+9.56)#22 | 12.4%(+7.34)#5,922 |
| 23. | Waterbury | 19.4% | 10.2%(+9.23)#23 | 12.4%(+7.01)#5,968 |
| 24. | West Haven | 18.9% | 10.2%(+8.65)#24 | 12.4%(+6.44)#6,090 |
| 25. | Westport | 18.9% | 10.2%(+8.65)#25 | 12.4%(+6.43)#6,091 |
| 26. | Daniels Farm | 18.5% | 10.2%(+8.27)#26 | 12.4%(+6.06)#6,163 |
| 27. | Hartford | 17.7% | 10.2%(+7.50)#27 | 12.4%(+5.28)#6,314 |
| 28. | Danbury | 15.8% | 10.2%(+5.56)#28 | 12.4%(+3.35)#6,808 |
| 29. | New Haven | 15.4% | 10.2%(+5.18)#29 | 12.4%(+2.96)#6,893 |
| 30. | Salmon Brook | 14.9% | 10.2%(+4.67)#30 | 12.4%(+2.46)#7,036 |
| 31. | Wethersfield | 13.5% | 10.2%(+3.32)#31 | 12.4%(+1.10)#7,386 |
| 32. | New Britain | 13.2% | 10.2%(+3.00)#32 | 12.4%(+0.788)#7,472 |
| 33. | Willimantic | 12.8% | 10.2%(+2.59)#33 | 12.4%(+0.373)#7,580 |
| 34. | Meriden | 12.6% | 10.2%(+2.38)#34 | 12.4%(+0.163)#7,619 |
| 35. | Norwich | 11.0% | 10.2%(+0.787)#35 | 12.4%(-1.43)#8,137 |
| 36. | Groton | 10.9% | 10.2%(+0.701)#36 | 12.4%(-1.51)#8,168 |
| 37. | Torrington | 9.6% | 10.2%(-0.606)#37 | 12.4%(-2.82)#8,563 |
| 38. | East Hartford | 9.1% | 10.2%(-1.17)#38 | 12.4%(-3.39)#8,747 |
| 39. | Oakville | 8.8% | 10.2%(-1.40)#39 | 12.4%(-3.61)#8,800 |
| 40. | Norwalk | 8.6% | 10.2%(-1.63)#40 | 12.4%(-3.84)#8,863 |
| 41. | Middletown | 8.5% | 10.2%(-1.73)#41 | 12.4%(-3.94)#8,889 |
| 42. | Oxoboxo River | 7.6% | 10.2%(-2.61)#42 | 12.4%(-4.83)#9,183 |
| 43. | Stamford | 7.3% | 10.2%(-2.93)#43 | 12.4%(-5.15)#9,269 |
| 44. | Manchester | 7.2% | 10.2%(-3.05)#44 | 12.4%(-5.26)#9,301 |
| 45. | Naugatuck Borough | 6.9% | 10.2%(-3.34)#45 | 12.4%(-5.56)#9,395 |
| 46. | North Haven | 6.6% | 10.2%(-3.66)#46 | 12.4%(-5.87)#9,492 |
| 47. | Wallingford Center | 6.6% | 10.2%(-3.67)#47 | 12.4%(-5.88)#9,498 |
| 48. | Branford Center | 5.9% | 10.2%(-4.31)#48 | 12.4%(-6.52)#9,659 |
| 49. | Milford City Balance | 4.7% | 10.2%(-5.48)#49 | 12.4%(-7.70)#9,965 |
| 50. | Pawcatuck | 4.7% | 10.2%(-5.51)#50 | 12.4%(-7.72)#9,975 |
| 51. | West Hartford | 4.3% | 10.2%(-5.96)#51 | 12.4%(-8.17)#10,089 |
| 52. | Terryville | 4.0% | 10.2%(-6.20)#52 | 12.4%(-8.41)#10,153 |
| 53. | East Haven | 3.6% | 10.2%(-6.63)#53 | 12.4%(-8.85)#10,254 |
| 54. | Bristol | 3.5% | 10.2%(-6.71)#54 | 12.4%(-8.92)#10,277 |
| 55. | Shelton | 2.2% | 10.2%(-8.05)#55 | 12.4%(-10.3)#10,526 |
| 56. | Greenwich | 0.71% | 10.2%(-9.51)#56 | 12.4%(-11.7)#10,719 |
1
2Common Questions
What are the Top 10 Cities with the Highest Poverty Level Among Single Males in Connecticut?
Top 10 Cities with the Highest Poverty Level Among Single Males in Connecticut are:
#1
100.0%
#2
100.0%
#3
88.7%
#4
72.4%
#5
71.1%
#6
50.0%
#7
44.7%
#8
41.1%
#9
32.6%
#10
27.7%
What city has the Highest Poverty Level Among Single Males in Connecticut?
Essex Village has the Highest Poverty Level Among Single Males in Connecticut with 100.0%.
What is the Poverty Level Among Single Males in the State of Connecticut?
Poverty Level Among Single Males in Connecticut is 10.2%.
What is the Poverty Level Among Single Males in the United States?
Poverty Level Among Single Males in the United States is 12.4%.