Cities with the Highest Poverty Level Among Single Males in Pennsylvania
RELATED REPORTS & OPTIONS
Highest Poverty | Single Male
Pennsylvania
Compare Cities
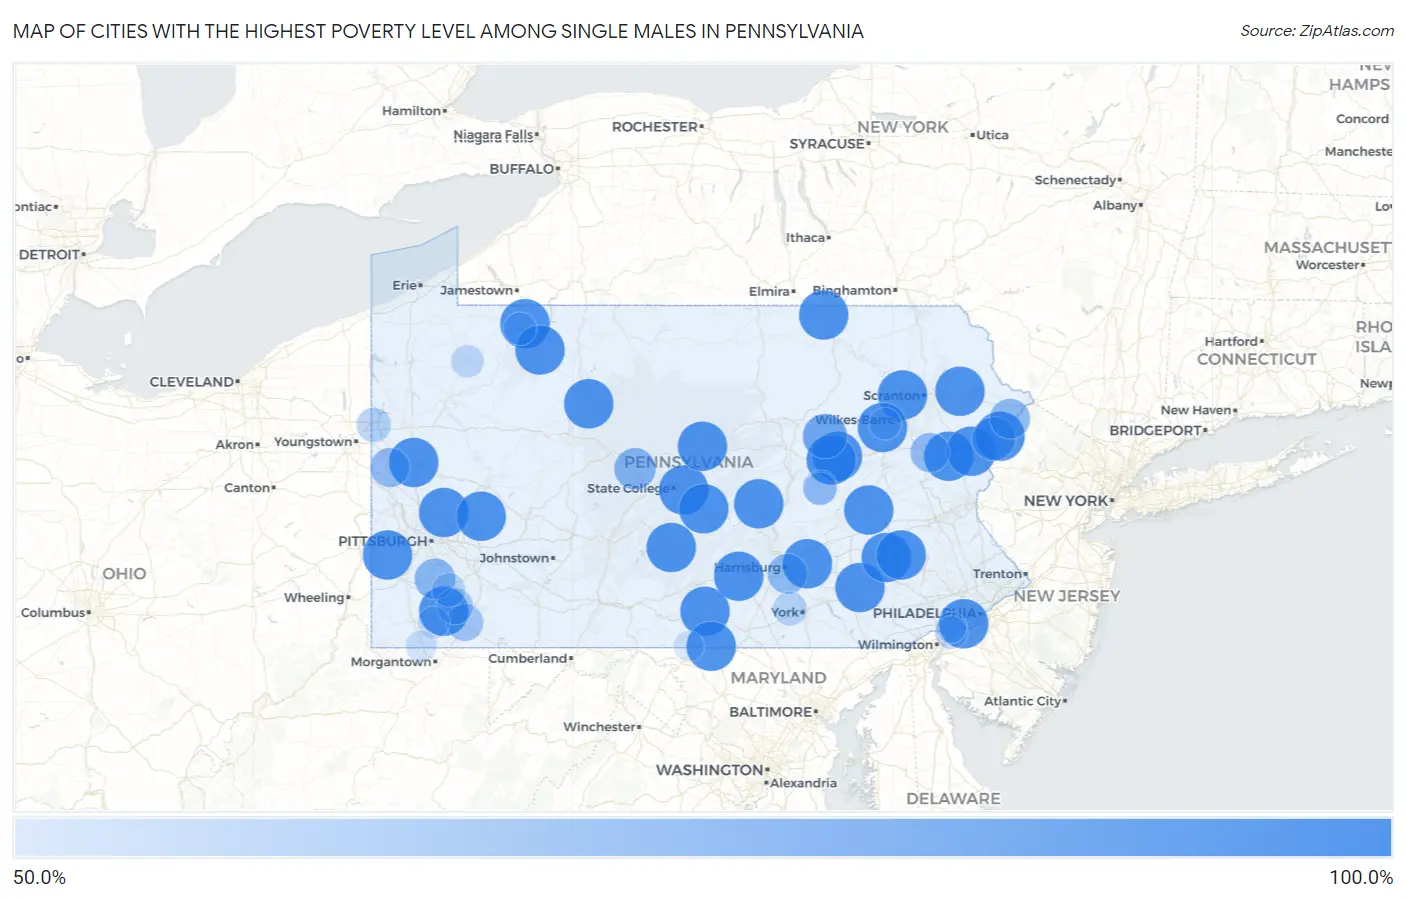
Map of Cities with the Highest Poverty Level Among Single Males in Pennsylvania
0.0%
100.0%
Cities with the Highest Poverty Level Among Single Males in Pennsylvania
| City | Single Male Poverty | vs State | vs National | |
| 1. | Sierra View | 100.0% | 12.4%(+87.6)#1 | 12.4%(+87.6)#7 |
| 2. | Boalsburg | 100.0% | 12.4%(+87.6)#2 | 12.4%(+87.6)#20 |
| 3. | Penn Estates | 100.0% | 12.4%(+87.6)#3 | 12.4%(+87.6)#25 |
| 4. | Brownstown | 100.0% | 12.4%(+87.6)#4 | 12.4%(+87.6)#30 |
| 5. | Pine Ridge | 100.0% | 12.4%(+87.6)#5 | 12.4%(+87.6)#52 |
| 6. | The Hideout | 100.0% | 12.4%(+87.6)#6 | 12.4%(+87.6)#100 |
| 7. | North Warren | 100.0% | 12.4%(+87.6)#7 | 12.4%(+87.6)#106 |
| 8. | Espy | 100.0% | 12.4%(+87.6)#8 | 12.4%(+87.6)#140 |
| 9. | West Lawn | 100.0% | 12.4%(+87.6)#9 | 12.4%(+87.6)#149 |
| 10. | Republic | 100.0% | 12.4%(+87.6)#10 | 12.4%(+87.6)#170 |
| 11. | Scotland | 100.0% | 12.4%(+87.6)#11 | 12.4%(+87.6)#200 |
| 12. | Upper Exeter | 100.0% | 12.4%(+87.6)#12 | 12.4%(+87.6)#250 |
| 13. | Stony Creek Mills | 100.0% | 12.4%(+87.6)#13 | 12.4%(+87.6)#274 |
| 14. | Sheffield | 100.0% | 12.4%(+87.6)#14 | 12.4%(+87.6)#306 |
| 15. | Sheatown | 100.0% | 12.4%(+87.6)#15 | 12.4%(+87.6)#341 |
| 16. | Rouzerville | 100.0% | 12.4%(+87.6)#16 | 12.4%(+87.6)#346 |
| 17. | Kersey | 100.0% | 12.4%(+87.6)#17 | 12.4%(+87.6)#347 |
| 18. | Bairdford | 100.0% | 12.4%(+87.6)#18 | 12.4%(+87.6)#352 |
| 19. | Thompsontown Borough | 100.0% | 12.4%(+87.6)#19 | 12.4%(+87.6)#359 |
| 20. | Greens Landing | 100.0% | 12.4%(+87.6)#20 | 12.4%(+87.6)#384 |
| 21. | Atlasburg | 100.0% | 12.4%(+87.6)#21 | 12.4%(+87.6)#387 |
| 22. | Renningers | 100.0% | 12.4%(+87.6)#22 | 12.4%(+87.6)#388 |
| 23. | Blanchard | 100.0% | 12.4%(+87.6)#24 | 12.4%(+87.6)#409 |
| 24. | Winterstown Borough | 100.0% | 12.4%(+87.6)#25 | 12.4%(+87.6)#410 |
| 25. | Lake Arthur Estates | 100.0% | 12.4%(+87.6)#26 | 12.4%(+87.6)#423 |
| 26. | Union Deposit | 100.0% | 12.4%(+87.6)#27 | 12.4%(+87.6)#443 |
| 27. | Prospect Park | 100.0% | 12.4%(+87.6)#28 | 12.4%(+87.6)#464 |
| 28. | Wilmore Borough | 100.0% | 12.4%(+87.6)#29 | 12.4%(+87.6)#472 |
| 29. | Richfield | 100.0% | 12.4%(+87.6)#30 | 12.4%(+87.6)#484 |
| 30. | Mapleton Borough | 100.0% | 12.4%(+87.6)#31 | 12.4%(+87.6)#495 |
| 31. | North Vandergrift | 100.0% | 12.4%(+87.6)#32 | 12.4%(+87.6)#505 |
| 32. | Hartleton Borough | 100.0% | 12.4%(+87.6)#33 | 12.4%(+87.6)#565 |
| 33. | Lumber City | 100.0% | 12.4%(+87.6)#34 | 12.4%(+87.6)#598 |
| 34. | Mckee | 100.0% | 12.4%(+87.6)#35 | 12.4%(+87.6)#600 |
| 35. | Plainfield | 100.0% | 12.4%(+87.6)#36 | 12.4%(+87.6)#606 |
| 36. | Rupert | 100.0% | 12.4%(+87.6)#37 | 12.4%(+87.6)#633 |
| 37. | Mount Gretna Borough | 100.0% | 12.4%(+87.6)#38 | 12.4%(+87.6)#663 |
| 38. | Tylersville | 100.0% | 12.4%(+87.6)#39 | 12.4%(+87.6)#685 |
| 39. | Charlottsville | 100.0% | 12.4%(+87.6)#40 | 12.4%(+87.6)#705 |
| 40. | Callensburg Borough | 100.0% | 12.4%(+87.6)#41 | 12.4%(+87.6)#710 |
| 41. | Cedar Crest | 100.0% | 12.4%(+87.6)#42 | 12.4%(+87.6)#841 |
| 42. | St. Clair | 100.0% | 12.4%(+87.6)#43 | 12.4%(+87.6)#866 |
| 43. | Beavertown | 100.0% | 12.4%(+87.6)#44 | 12.4%(+87.6)#907 |
| 44. | Briar Creek Borough | 95.7% | 12.4%(+83.3)#45 | 12.4%(+83.3)#916 |
| 45. | Iola | 87.5% | 12.4%(+75.1)#46 | 12.4%(+75.1)#979 |
| 46. | Paint Borough | 84.9% | 12.4%(+72.5)#47 | 12.4%(+72.5)#1,014 |
| 47. | Saw Creek | 84.7% | 12.4%(+72.3)#48 | 12.4%(+72.3)#1,018 |
| 48. | Shanksville Borough | 83.3% | 12.4%(+70.9)#49 | 12.4%(+70.9)#1,044 |
| 49. | Punxsutawney Borough | 81.6% | 12.4%(+69.2)#50 | 12.4%(+69.2)#1,069 |
| 50. | Westover Borough | 81.2% | 12.4%(+68.8)#51 | 12.4%(+68.8)#1,073 |
| 51. | Hawk Run | 80.0% | 12.4%(+67.6)#52 | 12.4%(+67.6)#1,089 |
| 52. | Baidland | 78.3% | 12.4%(+65.9)#53 | 12.4%(+65.9)#1,131 |
| 53. | Birchwood Lakes | 76.9% | 12.4%(+64.5)#54 | 12.4%(+64.5)#1,158 |
| 54. | New Market | 76.7% | 12.4%(+64.2)#55 | 12.4%(+64.2)#1,162 |
| 55. | West Pittsburg | 75.0% | 12.4%(+62.6)#56 | 12.4%(+62.6)#1,197 |
| 56. | Holiday Pocono | 75.0% | 12.4%(+62.6)#57 | 12.4%(+62.6)#1,204 |
| 57. | Woodbury Borough | 75.0% | 12.4%(+62.6)#58 | 12.4%(+62.6)#1,209 |
| 58. | Eastvale Borough | 75.0% | 12.4%(+62.6)#59 | 12.4%(+62.6)#1,220 |
| 59. | Slatington Borough | 73.3% | 12.4%(+60.8)#60 | 12.4%(+60.8)#1,248 |
| 60. | South Heights Borough | 71.4% | 12.4%(+59.0)#61 | 12.4%(+59.0)#1,300 |
| 61. | Jackson Center Borough | 71.4% | 12.4%(+59.0)#62 | 12.4%(+59.0)#1,309 |
| 62. | Osceola Mills Borough | 70.2% | 12.4%(+57.8)#63 | 12.4%(+57.8)#1,334 |
| 63. | Ashley Borough | 69.8% | 12.4%(+57.3)#64 | 12.4%(+57.3)#1,352 |
| 64. | East Uniontown | 69.2% | 12.4%(+56.8)#65 | 12.4%(+56.8)#1,357 |
| 65. | Smock | 68.1% | 12.4%(+55.7)#66 | 12.4%(+55.6)#1,394 |
| 66. | Midland Borough | 67.7% | 12.4%(+55.3)#67 | 12.4%(+55.3)#1,399 |
| 67. | Spring City Borough | 67.4% | 12.4%(+55.0)#68 | 12.4%(+55.0)#1,407 |
| 68. | Portage Borough | 66.7% | 12.4%(+54.2)#69 | 12.4%(+54.2)#1,417 |
| 69. | Mont Alto Borough | 66.7% | 12.4%(+54.2)#70 | 12.4%(+54.2)#1,427 |
| 70. | Westfield Borough | 66.7% | 12.4%(+54.2)#71 | 12.4%(+54.2)#1,432 |
| 71. | Beavertown Borough | 66.7% | 12.4%(+54.2)#72 | 12.4%(+54.2)#1,441 |
| 72. | Delta Borough | 66.7% | 12.4%(+54.2)#73 | 12.4%(+54.2)#1,447 |
| 73. | Smithton Borough | 66.7% | 12.4%(+54.2)#74 | 12.4%(+54.2)#1,457 |
| 74. | Newburg Borough Cumberland County | 66.7% | 12.4%(+54.2)#75 | 12.4%(+54.2)#1,462 |
| 75. | Casselman Borough | 66.7% | 12.4%(+54.2)#76 | 12.4%(+54.2)#1,490 |
| 76. | Tharptown Uniontown | 63.6% | 12.4%(+51.2)#77 | 12.4%(+51.2)#1,574 |
| 77. | Farrell | 63.4% | 12.4%(+51.0)#78 | 12.4%(+51.0)#1,578 |
| 78. | Hollidaysburg Borough | 62.2% | 12.4%(+49.8)#79 | 12.4%(+49.8)#1,632 |
| 79. | Weigelstown | 61.8% | 12.4%(+49.4)#80 | 12.4%(+49.4)#1,642 |
| 80. | Fairhope | 61.4% | 12.4%(+48.9)#81 | 12.4%(+48.9)#1,661 |
| 81. | Rouseville Borough | 61.1% | 12.4%(+48.7)#82 | 12.4%(+48.7)#1,675 |
| 82. | Linwood | 59.7% | 12.4%(+47.2)#83 | 12.4%(+47.2)#1,764 |
| 83. | Edgewood | 59.4% | 12.4%(+46.9)#84 | 12.4%(+46.9)#1,773 |
| 84. | Titusville | 59.3% | 12.4%(+46.8)#85 | 12.4%(+46.8)#1,776 |
| 85. | Starbrick | 59.1% | 12.4%(+46.7)#86 | 12.4%(+46.7)#1,786 |
| 86. | Forty Fort Borough | 57.1% | 12.4%(+44.7)#87 | 12.4%(+44.7)#1,839 |
| 87. | Fairdale | 57.1% | 12.4%(+44.7)#88 | 12.4%(+44.7)#1,843 |
| 88. | West Nanticoke | 57.1% | 12.4%(+44.7)#89 | 12.4%(+44.7)#1,859 |
| 89. | Railroad Borough | 57.1% | 12.4%(+44.7)#90 | 12.4%(+44.7)#1,864 |
| 90. | Chestnut Hill | 56.8% | 12.4%(+44.4)#91 | 12.4%(+44.4)#1,878 |
| 91. | Mount Morris | 56.0% | 12.4%(+43.6)#92 | 12.4%(+43.6)#1,913 |
| 92. | Rimersburg Borough | 55.9% | 12.4%(+43.5)#93 | 12.4%(+43.4)#1,918 |
| 93. | Connoquenessing Borough | 55.6% | 12.4%(+43.1)#94 | 12.4%(+43.1)#1,938 |
| 94. | Bentleyville Borough | 54.5% | 12.4%(+42.1)#95 | 12.4%(+42.1)#1,978 |
| 95. | Village Green Green Ridge | 54.3% | 12.4%(+41.9)#96 | 12.4%(+41.9)#2,001 |
| 96. | State Line | 53.5% | 12.4%(+41.1)#97 | 12.4%(+41.1)#2,037 |
| 97. | Marianna Borough | 53.3% | 12.4%(+40.9)#98 | 12.4%(+40.9)#2,056 |
| 98. | Luzerne Borough | 53.1% | 12.4%(+40.6)#99 | 12.4%(+40.6)#2,068 |
| 99. | Prospect Park Borough | 52.9% | 12.4%(+40.4)#100 | 12.4%(+40.4)#2,084 |
| 100. | Philipsburg Borough | 52.8% | 12.4%(+40.4)#101 | 12.4%(+40.4)#2,087 |
Common Questions
What are the Top 10 Cities with the Highest Poverty Level Among Single Males in Pennsylvania?
Top 10 Cities with the Highest Poverty Level Among Single Males in Pennsylvania are:
#1
100.0%
#2
100.0%
#3
100.0%
#4
100.0%
#5
100.0%
#6
100.0%
#7
100.0%
#8
100.0%
#9
100.0%
#10
100.0%
What city has the Highest Poverty Level Among Single Males in Pennsylvania?
Sierra View has the Highest Poverty Level Among Single Males in Pennsylvania with 100.0%.
What is the Poverty Level Among Single Males in the State of Pennsylvania?
Poverty Level Among Single Males in Pennsylvania is 12.4%.
What is the Poverty Level Among Single Males in the United States?
Poverty Level Among Single Males in the United States is 12.4%.