Cities with the Highest Poverty Level Among Single Males in North Carolina
RELATED REPORTS & OPTIONS
Highest Poverty | Single Male
North Carolina
Compare Cities
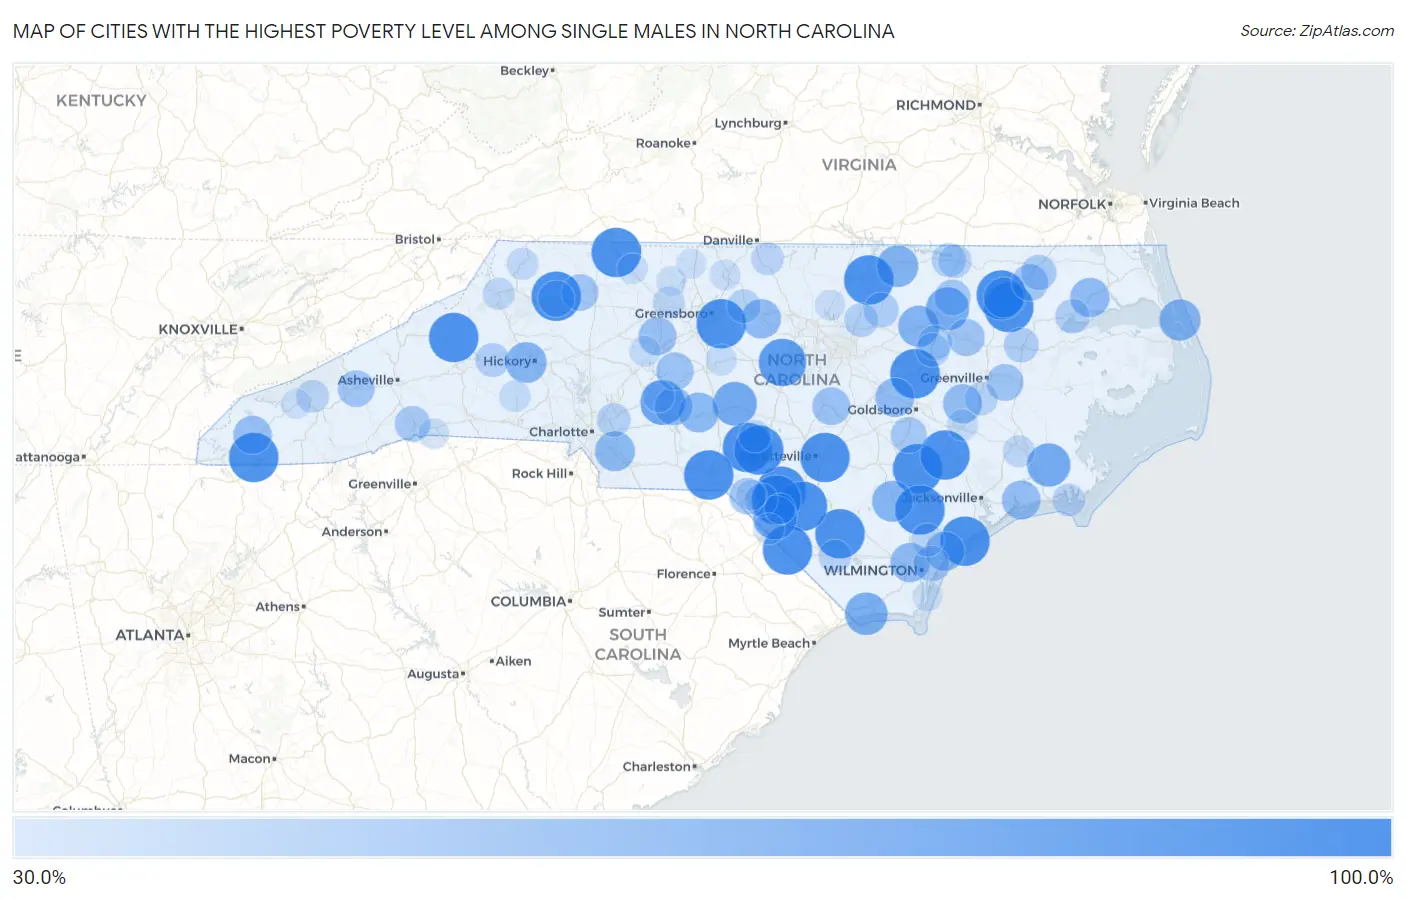
Map of Cities with the Highest Poverty Level Among Single Males in North Carolina
0.0%
100.0%
Cities with the Highest Poverty Level Among Single Males in North Carolina
| City | Single Male Poverty | vs State | vs National | |
| 1. | Forest Oaks | 100.0% | 14.5%(+85.5)#1 | 12.4%(+87.6)#24 |
| 2. | Surf City | 100.0% | 14.5%(+85.5)#2 | 12.4%(+87.6)#27 |
| 3. | Red Springs | 100.0% | 14.5%(+85.5)#3 | 12.4%(+87.6)#46 |
| 4. | Spruce Pine | 100.0% | 14.5%(+85.5)#4 | 12.4%(+87.6)#71 |
| 5. | Pinebluff | 100.0% | 14.5%(+85.5)#5 | 12.4%(+87.6)#118 |
| 6. | Fairplains | 100.0% | 14.5%(+85.5)#6 | 12.4%(+87.6)#124 |
| 7. | Vander | 100.0% | 14.5%(+85.5)#7 | 12.4%(+87.6)#150 |
| 8. | Cordova | 100.0% | 14.5%(+85.5)#8 | 12.4%(+87.6)#173 |
| 9. | Toast | 100.0% | 14.5%(+85.5)#9 | 12.4%(+87.6)#193 |
| 10. | South Henderson | 100.0% | 14.5%(+85.5)#10 | 12.4%(+87.6)#199 |
| 11. | Lucama | 100.0% | 14.5%(+85.5)#11 | 12.4%(+87.6)#224 |
| 12. | Kenansville | 100.0% | 14.5%(+85.5)#12 | 12.4%(+87.6)#262 |
| 13. | Clarkton | 100.0% | 14.5%(+85.5)#13 | 12.4%(+87.6)#284 |
| 14. | Barker Ten Mile | 100.0% | 14.5%(+85.5)#14 | 12.4%(+87.6)#303 |
| 15. | Prospect | 100.0% | 14.5%(+85.5)#15 | 12.4%(+87.6)#353 |
| 16. | Hayesville | 100.0% | 14.5%(+85.5)#16 | 12.4%(+87.6)#357 |
| 17. | Pink Hill | 100.0% | 14.5%(+85.5)#17 | 12.4%(+87.6)#396 |
| 18. | Lewiston Woodville | 100.0% | 14.5%(+85.5)#18 | 12.4%(+87.6)#432 |
| 19. | Roxobel | 100.0% | 14.5%(+85.5)#19 | 12.4%(+87.6)#442 |
| 20. | Ashley Heights | 100.0% | 14.5%(+85.5)#20 | 12.4%(+87.6)#492 |
| 21. | Watha | 100.0% | 14.5%(+85.5)#21 | 12.4%(+87.6)#620 |
| 22. | Marietta | 100.0% | 14.5%(+85.5)#22 | 12.4%(+87.6)#773 |
| 23. | Pittsboro | 92.5% | 14.5%(+78.0)#23 | 12.4%(+80.1)#930 |
| 24. | New London | 83.3% | 14.5%(+68.9)#24 | 12.4%(+70.9)#1,037 |
| 25. | Elrod | 80.0% | 14.5%(+65.5)#25 | 12.4%(+67.6)#1,098 |
| 26. | Robbins | 79.2% | 14.5%(+64.7)#26 | 12.4%(+66.7)#1,118 |
| 27. | Minnesott Beach | 77.8% | 14.5%(+63.3)#27 | 12.4%(+65.3)#1,144 |
| 28. | Whitakers | 76.9% | 14.5%(+62.5)#28 | 12.4%(+64.5)#1,159 |
| 29. | Ocean Isle Beach | 75.0% | 14.5%(+60.5)#29 | 12.4%(+62.6)#1,198 |
| 30. | Warrenton | 71.4% | 14.5%(+57.0)#30 | 12.4%(+59.0)#1,285 |
| 31. | Kill Devil Hills | 70.5% | 14.5%(+56.0)#31 | 12.4%(+58.1)#1,329 |
| 32. | Nashville | 70.1% | 14.5%(+55.6)#32 | 12.4%(+57.7)#1,335 |
| 33. | Harrells | 69.2% | 14.5%(+54.8)#33 | 12.4%(+56.8)#1,365 |
| 34. | Hildebran | 68.8% | 14.5%(+54.3)#34 | 12.4%(+56.3)#1,373 |
| 35. | Kelford | 66.7% | 14.5%(+52.2)#35 | 12.4%(+54.2)#1,469 |
| 36. | Lake Park | 65.7% | 14.5%(+51.2)#36 | 12.4%(+53.2)#1,498 |
| 37. | Troy | 65.4% | 14.5%(+50.9)#37 | 12.4%(+52.9)#1,505 |
| 38. | Swepsonville | 63.6% | 14.5%(+49.2)#38 | 12.4%(+51.2)#1,563 |
| 39. | Hertford | 63.5% | 14.5%(+49.0)#39 | 12.4%(+51.1)#1,577 |
| 40. | Navassa | 63.0% | 14.5%(+48.5)#40 | 12.4%(+50.5)#1,597 |
| 41. | Hampstead | 62.7% | 14.5%(+48.3)#41 | 12.4%(+50.3)#1,604 |
| 42. | Princeton | 62.5% | 14.5%(+48.0)#42 | 12.4%(+50.1)#1,612 |
| 43. | Hookerton | 62.5% | 14.5%(+48.0)#43 | 12.4%(+50.1)#1,620 |
| 44. | Peletier | 61.5% | 14.5%(+47.1)#44 | 12.4%(+49.1)#1,652 |
| 45. | Andrews | 60.0% | 14.5%(+45.5)#45 | 12.4%(+47.6)#1,712 |
| 46. | Badin | 59.1% | 14.5%(+44.6)#46 | 12.4%(+46.7)#1,782 |
| 47. | Welcome | 59.0% | 14.5%(+44.5)#47 | 12.4%(+46.6)#1,790 |
| 48. | Buies Creek | 58.2% | 14.5%(+43.8)#48 | 12.4%(+45.8)#1,819 |
| 49. | Denton | 57.1% | 14.5%(+42.7)#49 | 12.4%(+44.7)#1,847 |
| 50. | Tarboro | 55.5% | 14.5%(+41.1)#50 | 12.4%(+43.1)#1,953 |
| 51. | Grimesland | 55.0% | 14.5%(+40.5)#51 | 12.4%(+42.6)#1,966 |
| 52. | Clyde | 54.5% | 14.5%(+40.1)#52 | 12.4%(+42.1)#1,982 |
| 53. | Ronda | 54.5% | 14.5%(+40.1)#53 | 12.4%(+42.1)#1,990 |
| 54. | Ahoskie | 54.2% | 14.5%(+39.8)#54 | 12.4%(+41.8)#2,004 |
| 55. | North Wilkesboro | 53.4% | 14.5%(+38.9)#55 | 12.4%(+40.9)#2,043 |
| 56. | Laurinburg | 52.9% | 14.5%(+38.5)#56 | 12.4%(+40.5)#2,073 |
| 57. | Mount Olive | 52.0% | 14.5%(+37.5)#57 | 12.4%(+39.6)#2,131 |
| 58. | Enfield | 52.0% | 14.5%(+37.5)#58 | 12.4%(+39.6)#2,133 |
| 59. | Kings Grant | 51.1% | 14.5%(+36.7)#59 | 12.4%(+38.7)#2,166 |
| 60. | East Flat Rock | 50.7% | 14.5%(+36.3)#60 | 12.4%(+38.3)#2,178 |
| 61. | Cofield | 50.0% | 14.5%(+35.5)#61 | 12.4%(+37.6)#2,304 |
| 62. | Louisburg | 48.0% | 14.5%(+33.5)#62 | 12.4%(+35.6)#2,468 |
| 63. | Williamston | 47.4% | 14.5%(+32.9)#63 | 12.4%(+34.9)#2,496 |
| 64. | Edenton | 46.8% | 14.5%(+32.3)#64 | 12.4%(+34.4)#2,532 |
| 65. | Sharpsburg | 46.3% | 14.5%(+31.8)#65 | 12.4%(+33.8)#2,571 |
| 66. | South Rosemary | 45.5% | 14.5%(+31.0)#66 | 12.4%(+33.0)#2,617 |
| 67. | Youngsville | 45.1% | 14.5%(+30.7)#67 | 12.4%(+32.7)#2,648 |
| 68. | Morganton | 45.0% | 14.5%(+30.6)#68 | 12.4%(+32.6)#2,651 |
| 69. | Elon | 44.4% | 14.5%(+30.0)#69 | 12.4%(+32.0)#2,677 |
| 70. | Elm City | 44.4% | 14.5%(+30.0)#70 | 12.4%(+32.0)#2,683 |
| 71. | Harrisburg | 43.8% | 14.5%(+29.3)#71 | 12.4%(+31.3)#2,729 |
| 72. | Roanoke Rapids | 42.6% | 14.5%(+28.1)#72 | 12.4%(+30.1)#2,834 |
| 73. | Rocky Point | 42.2% | 14.5%(+27.8)#73 | 12.4%(+29.8)#2,856 |
| 74. | Whiteville | 42.0% | 14.5%(+27.5)#74 | 12.4%(+29.5)#2,872 |
| 75. | Ayden | 41.9% | 14.5%(+27.5)#75 | 12.4%(+29.5)#2,874 |
| 76. | Maxton | 41.4% | 14.5%(+27.0)#76 | 12.4%(+29.0)#2,926 |
| 77. | Cherokee | 41.1% | 14.5%(+26.6)#77 | 12.4%(+28.6)#2,958 |
| 78. | Yanceyville | 40.8% | 14.5%(+26.4)#78 | 12.4%(+28.4)#2,975 |
| 79. | Beaufort | 40.6% | 14.5%(+26.1)#79 | 12.4%(+28.1)#2,993 |
| 80. | Southern Pines | 39.1% | 14.5%(+24.6)#80 | 12.4%(+26.7)#3,164 |
| 81. | Boone | 38.6% | 14.5%(+24.2)#81 | 12.4%(+26.2)#3,193 |
| 82. | Trent Woods | 38.1% | 14.5%(+23.6)#82 | 12.4%(+25.7)#3,233 |
| 83. | Walkertown | 37.9% | 14.5%(+23.4)#83 | 12.4%(+25.4)#3,246 |
| 84. | Jefferson | 37.7% | 14.5%(+23.3)#84 | 12.4%(+25.3)#3,254 |
| 85. | Richfield | 37.5% | 14.5%(+23.0)#85 | 12.4%(+25.1)#3,277 |
| 86. | Belwood | 36.4% | 14.5%(+21.9)#86 | 12.4%(+23.9)#3,385 |
| 87. | Kinston | 36.0% | 14.5%(+21.5)#87 | 12.4%(+23.5)#3,439 |
| 88. | Rowland | 35.3% | 14.5%(+20.8)#88 | 12.4%(+22.9)#3,504 |
| 89. | Franklinville | 34.8% | 14.5%(+20.3)#89 | 12.4%(+22.3)#3,562 |
| 90. | Tyro | 34.5% | 14.5%(+20.0)#90 | 12.4%(+22.0)#3,582 |
| 91. | Reidsville | 34.1% | 14.5%(+19.7)#91 | 12.4%(+21.7)#3,613 |
| 92. | Butner | 33.3% | 14.5%(+18.9)#92 | 12.4%(+20.9)#3,656 |
| 93. | Pilot Mountain | 33.3% | 14.5%(+18.9)#93 | 12.4%(+20.9)#3,680 |
| 94. | Tryon | 33.3% | 14.5%(+18.9)#94 | 12.4%(+20.9)#3,683 |
| 95. | East Laurinburg | 33.3% | 14.5%(+18.9)#95 | 12.4%(+20.9)#3,773 |
| 96. | Pembroke | 32.7% | 14.5%(+18.2)#96 | 12.4%(+20.3)#3,869 |
| 97. | Walnut Cove | 32.1% | 14.5%(+17.7)#97 | 12.4%(+19.7)#3,929 |
| 98. | Mayodan | 32.0% | 14.5%(+17.5)#98 | 12.4%(+19.6)#3,941 |
| 99. | Bryson City | 32.0% | 14.5%(+17.5)#99 | 12.4%(+19.6)#3,942 |
| 100. | Carolina Beach | 31.5% | 14.5%(+17.1)#100 | 12.4%(+19.1)#3,992 |
Common Questions
What are the Top 10 Cities with the Highest Poverty Level Among Single Males in North Carolina?
Top 10 Cities with the Highest Poverty Level Among Single Males in North Carolina are:
#1
100.0%
#2
100.0%
#3
100.0%
#4
100.0%
#5
100.0%
#6
100.0%
#7
100.0%
#8
100.0%
#9
100.0%
#10
100.0%
What city has the Highest Poverty Level Among Single Males in North Carolina?
Forest Oaks has the Highest Poverty Level Among Single Males in North Carolina with 100.0%.
What is the Poverty Level Among Single Males in the State of North Carolina?
Poverty Level Among Single Males in North Carolina is 14.5%.
What is the Poverty Level Among Single Males in the United States?
Poverty Level Among Single Males in the United States is 12.4%.