Cities with the Highest Poverty Level Among Single Males in Montana
RELATED REPORTS & OPTIONS
Highest Poverty | Single Male
Montana
Compare Cities
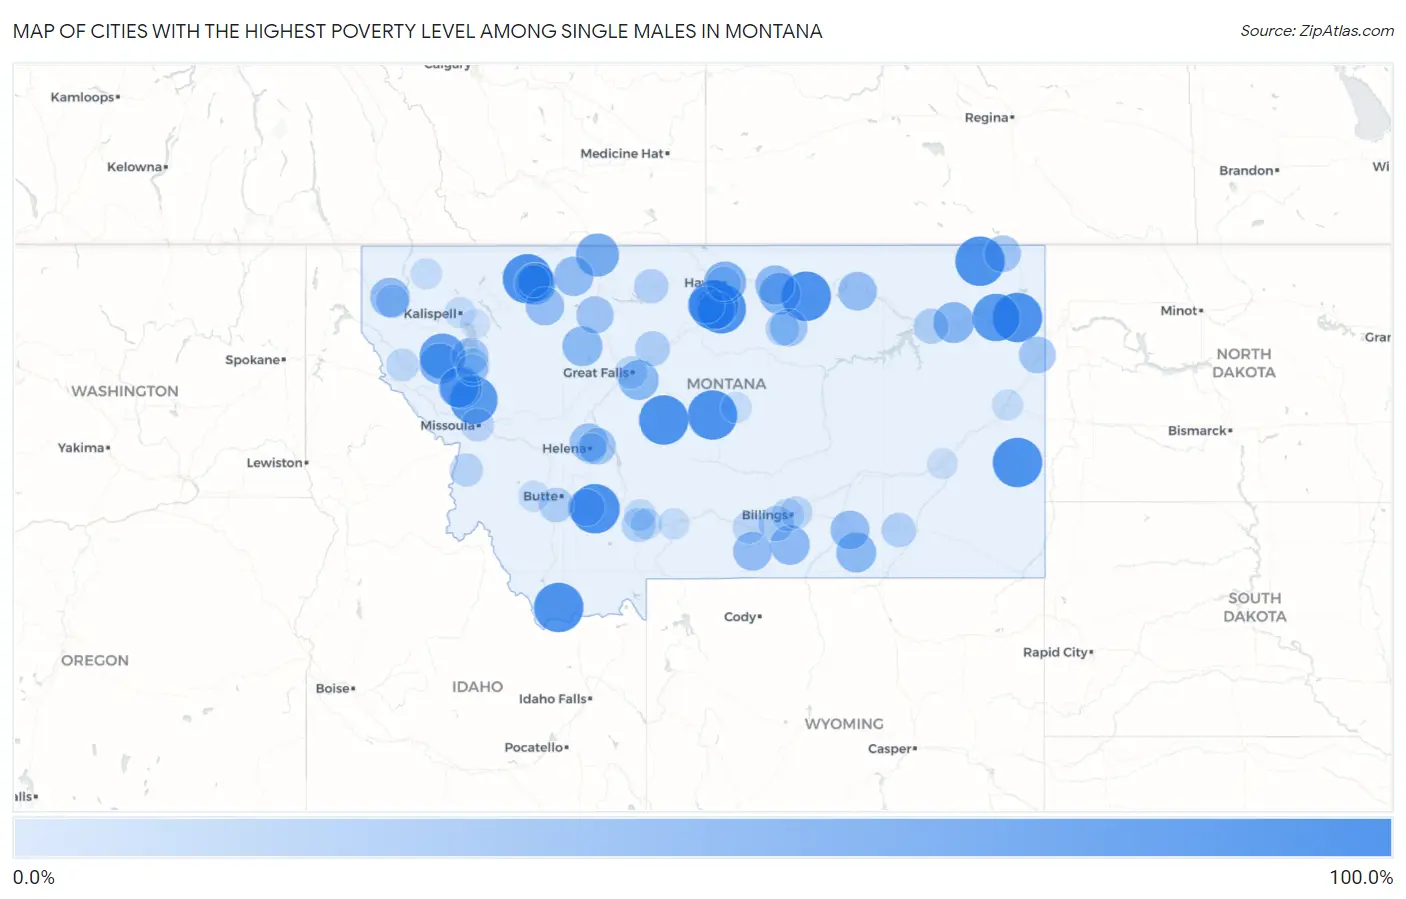
Map of Cities with the Highest Poverty Level Among Single Males in Montana
0.0%
100.0%
Cities with the Highest Poverty Level Among Single Males in Montana
| City | Single Male Poverty | vs State | vs National | |
| 1. | Culbertson | 100.0% | 13.4%(+86.6)#1 | 12.4%(+87.6)#345 |
| 2. | Parker School | 100.0% | 13.4%(+86.6)#2 | 12.4%(+87.6)#473 |
| 3. | Boneau | 100.0% | 13.4%(+86.6)#3 | 12.4%(+87.6)#556 |
| 4. | Plevna | 100.0% | 13.4%(+86.6)#4 | 12.4%(+87.6)#599 |
| 5. | Starr School | 100.0% | 13.4%(+86.6)#5 | 12.4%(+87.6)#621 |
| 6. | Lima | 100.0% | 13.4%(+86.6)#6 | 12.4%(+87.6)#647 |
| 7. | Bull Lake | 100.0% | 13.4%(+86.6)#7 | 12.4%(+87.6)#653 |
| 8. | Hobson | 100.0% | 13.4%(+86.6)#8 | 12.4%(+87.6)#698 |
| 9. | Dodson | 100.0% | 13.4%(+86.6)#9 | 12.4%(+87.6)#758 |
| 10. | Flaxville | 100.0% | 13.4%(+86.6)#10 | 12.4%(+87.6)#856 |
| 11. | Cardwell | 100.0% | 13.4%(+86.6)#11 | 12.4%(+87.6)#875 |
| 12. | Neihart | 100.0% | 13.4%(+86.6)#12 | 12.4%(+87.6)#889 |
| 13. | Arlee | 90.5% | 13.4%(+77.1)#13 | 12.4%(+78.0)#944 |
| 14. | Brockton | 90.0% | 13.4%(+76.6)#14 | 12.4%(+77.6)#948 |
| 15. | Lonepine | 80.0% | 13.4%(+66.6)#15 | 12.4%(+67.6)#1,110 |
| 16. | Sunburst | 66.7% | 13.4%(+53.3)#16 | 12.4%(+54.2)#1,461 |
| 17. | Havre North | 60.9% | 13.4%(+47.5)#17 | 12.4%(+48.4)#1,683 |
| 18. | Old Agency | 60.0% | 13.4%(+46.6)#18 | 12.4%(+47.6)#1,757 |
| 19. | South Browning | 59.6% | 13.4%(+46.2)#19 | 12.4%(+47.2)#1,765 |
| 20. | Fort Belknap Agency | 57.1% | 13.4%(+43.8)#20 | 12.4%(+44.7)#1,845 |
| 21. | Hot Springs | 55.0% | 13.4%(+41.6)#21 | 12.4%(+42.6)#1,965 |
| 22. | Wolf Point | 54.1% | 13.4%(+40.7)#22 | 12.4%(+41.6)#2,013 |
| 23. | Choteau | 50.0% | 13.4%(+36.6)#23 | 12.4%(+37.6)#2,212 |
| 24. | Lodge Grass | 50.0% | 13.4%(+36.6)#24 | 12.4%(+37.6)#2,283 |
| 25. | Dixon | 50.0% | 13.4%(+36.6)#25 | 12.4%(+37.6)#2,329 |
| 26. | Sand Coulee | 50.0% | 13.4%(+36.6)#26 | 12.4%(+37.6)#2,347 |
| 27. | Pryor | 48.1% | 13.4%(+34.8)#27 | 12.4%(+35.7)#2,458 |
| 28. | Libby | 47.4% | 13.4%(+34.0)#28 | 12.4%(+34.9)#2,498 |
| 29. | Harlem | 47.4% | 13.4%(+34.0)#29 | 12.4%(+34.9)#2,499 |
| 30. | Cut Bank | 46.4% | 13.4%(+33.0)#30 | 12.4%(+34.0)#2,554 |
| 31. | Browning | 45.0% | 13.4%(+31.6)#31 | 12.4%(+32.6)#2,654 |
| 32. | Crow Agency | 44.8% | 13.4%(+31.4)#32 | 12.4%(+32.3)#2,667 |
| 33. | Roberts | 43.8% | 13.4%(+30.4)#33 | 12.4%(+31.3)#2,746 |
| 34. | Saco | 42.9% | 13.4%(+29.5)#34 | 12.4%(+30.4)#2,824 |
| 35. | Heart Butte | 42.4% | 13.4%(+29.0)#35 | 12.4%(+30.0)#2,840 |
| 36. | Helena Valley West Central | 40.1% | 13.4%(+26.7)#36 | 12.4%(+27.7)#3,012 |
| 37. | St Pierre | 37.5% | 13.4%(+24.1)#37 | 12.4%(+25.1)#3,290 |
| 38. | Lodge Pole | 37.5% | 13.4%(+24.1)#38 | 12.4%(+25.1)#3,300 |
| 39. | Conrad | 36.0% | 13.4%(+22.6)#39 | 12.4%(+23.6)#3,429 |
| 40. | Rocky Boy West | 35.6% | 13.4%(+22.2)#40 | 12.4%(+23.1)#3,480 |
| 41. | Whitehall | 35.2% | 13.4%(+21.8)#41 | 12.4%(+22.7)#3,519 |
| 42. | Polson | 34.9% | 13.4%(+21.5)#42 | 12.4%(+22.4)#3,552 |
| 43. | Sidney | 33.3% | 13.4%(+20.0)#43 | 12.4%(+20.9)#3,659 |
| 44. | Outlook | 33.3% | 13.4%(+20.0)#44 | 12.4%(+20.9)#3,828 |
| 45. | Helena Valley Southeast | 32.6% | 13.4%(+19.2)#45 | 12.4%(+20.2)#3,878 |
| 46. | Laurel | 25.7% | 13.4%(+12.3)#46 | 12.4%(+13.2)#4,764 |
| 47. | Frazer | 25.0% | 13.4%(+11.6)#47 | 12.4%(+12.6)#4,924 |
| 48. | Carter | 25.0% | 13.4%(+11.6)#48 | 12.4%(+12.6)#4,951 |
| 49. | Butte Silver Bow Balance | 22.8% | 13.4%(+9.46)#49 | 12.4%(+10.4)#5,283 |
| 50. | Havre | 22.8% | 13.4%(+9.41)#50 | 12.4%(+10.4)#5,293 |
| 51. | Lame Deer | 21.6% | 13.4%(+8.24)#51 | 12.4%(+9.19)#5,502 |
| 52. | Chester | 21.4% | 13.4%(+8.05)#52 | 12.4%(+8.99)#5,546 |
| 53. | Four Corners | 19.8% | 13.4%(+6.46)#53 | 12.4%(+7.40)#5,914 |
| 54. | Hays | 19.2% | 13.4%(+5.85)#54 | 12.4%(+6.80)#6,016 |
| 55. | Pablo | 18.6% | 13.4%(+5.19)#55 | 12.4%(+6.14)#6,145 |
| 56. | White Haven | 17.2% | 13.4%(+3.86)#56 | 12.4%(+4.81)#6,425 |
| 57. | Pinesdale | 15.8% | 13.4%(+2.41)#57 | 12.4%(+3.35)#6,797 |
| 58. | Missoula | 14.4% | 13.4%(+1.02)#58 | 12.4%(+1.97)#7,131 |
| 59. | Billings | 13.4% | 13.4%(+0.044)#59 | 12.4%(+0.989)#7,412 |
| 60. | Thompson Falls | 13.3% | 13.4%(-0.046)#60 | 12.4%(+0.898)#7,433 |
| 61. | Great Falls | 12.8% | 13.4%(-0.614)#61 | 12.4%(+0.331)#7,587 |
| 62. | Columbus | 11.8% | 13.4%(-1.61)#62 | 12.4%(-0.671)#7,883 |
| 63. | Lockwood | 11.3% | 13.4%(-2.04)#63 | 12.4%(-1.09)#8,006 |
| 64. | North Browning | 10.3% | 13.4%(-3.03)#64 | 12.4%(-2.09)#8,329 |
| 65. | Belgrade | 8.9% | 13.4%(-4.49)#65 | 12.4%(-3.55)#8,782 |
| 66. | Bozeman | 8.1% | 13.4%(-5.27)#66 | 12.4%(-4.33)#9,016 |
| 67. | Ronan | 7.4% | 13.4%(-5.97)#67 | 12.4%(-5.03)#9,242 |
| 68. | Kalispell | 6.6% | 13.4%(-6.82)#68 | 12.4%(-5.88)#9,494 |
| 69. | Lewistown Heights | 6.0% | 13.4%(-7.36)#69 | 12.4%(-6.41)#9,636 |
| 70. | Livingston | 5.9% | 13.4%(-7.45)#70 | 12.4%(-6.51)#9,654 |
| 71. | Trego | 5.9% | 13.4%(-7.50)#71 | 12.4%(-6.55)#9,678 |
| 72. | Helena | 5.8% | 13.4%(-7.59)#72 | 12.4%(-6.64)#9,701 |
| 73. | Glendive | 5.6% | 13.4%(-7.77)#73 | 12.4%(-6.82)#9,748 |
| 74. | Anaconda Deer Lodge County | 5.4% | 13.4%(-8.02)#74 | 12.4%(-7.08)#9,807 |
| 75. | Miles City | 3.7% | 13.4%(-9.63)#75 | 12.4%(-8.69)#10,221 |
| 76. | Bigfork | 1.1% | 13.4%(-12.3)#76 | 12.4%(-11.3)#10,686 |
Common Questions
What are the Top 10 Cities with the Highest Poverty Level Among Single Males in Montana?
Top 10 Cities with the Highest Poverty Level Among Single Males in Montana are:
#1
100.0%
#2
100.0%
#3
100.0%
#4
100.0%
#5
100.0%
#6
100.0%
#7
100.0%
#8
100.0%
#9
100.0%
#10
100.0%
What city has the Highest Poverty Level Among Single Males in Montana?
Culbertson has the Highest Poverty Level Among Single Males in Montana with 100.0%.
What is the Poverty Level Among Single Males in the State of Montana?
Poverty Level Among Single Males in Montana is 13.4%.
What is the Poverty Level Among Single Males in the United States?
Poverty Level Among Single Males in the United States is 12.4%.