Cities with the Highest Poverty Level Among Single Males in Kansas
RELATED REPORTS & OPTIONS
Highest Poverty | Single Male
Kansas
Compare Cities
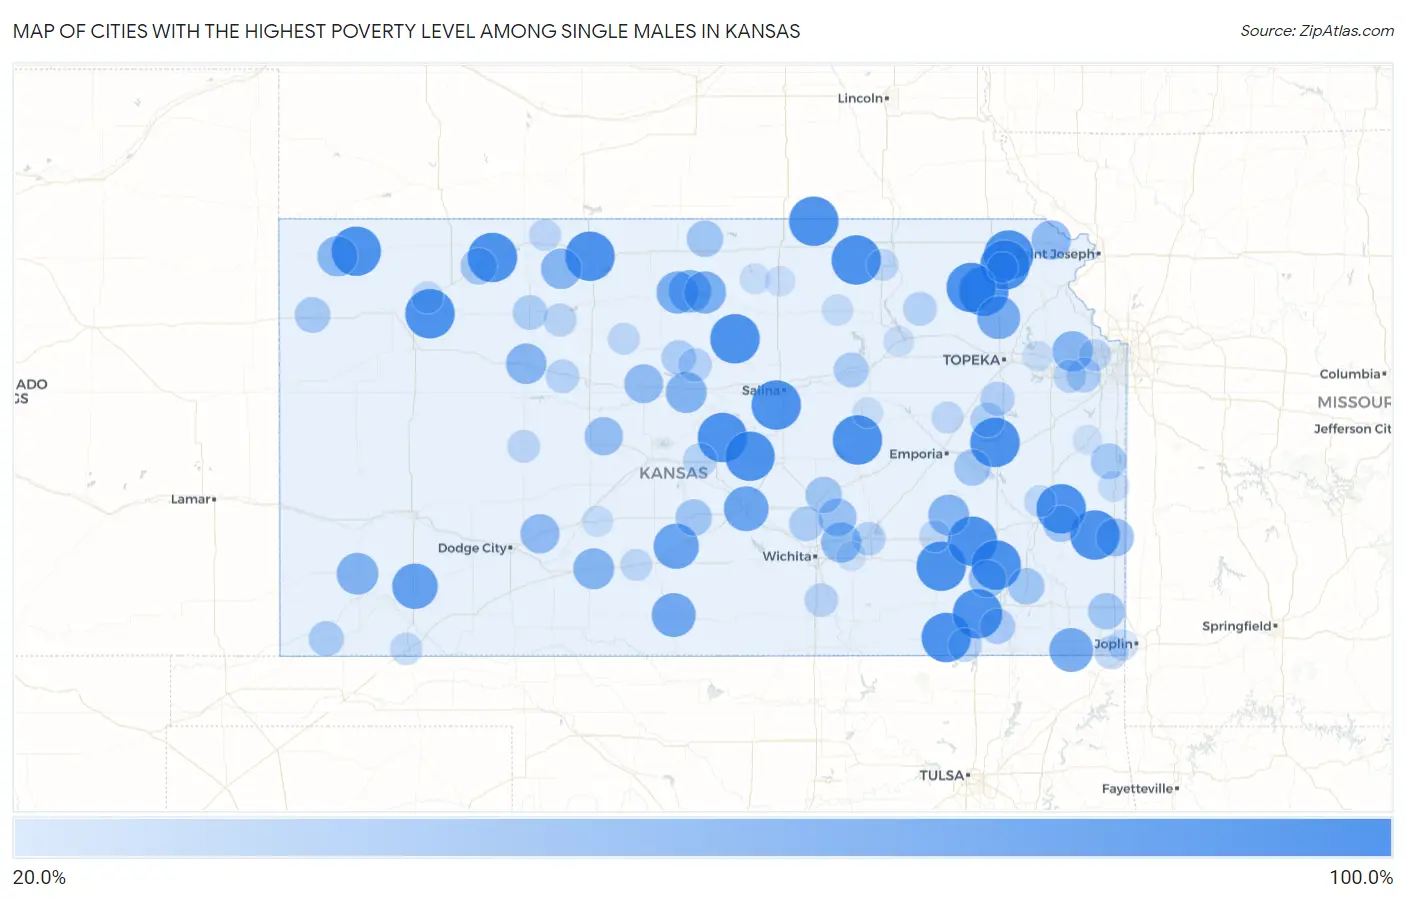
Map of Cities with the Highest Poverty Level Among Single Males in Kansas
0.0%
100.0%
Cities with the Highest Poverty Level Among Single Males in Kansas
| City | Single Male Poverty | vs State | vs National | |
| 1. | Phillipsburg | 100.0% | 12.7%(+87.3)#1 | 12.4%(+87.6)#90 |
| 2. | Sedan | 100.0% | 12.7%(+87.3)#2 | 12.4%(+87.6)#241 |
| 3. | Greenleaf | 100.0% | 12.7%(+87.3)#3 | 12.4%(+87.6)#528 |
| 4. | Elk City | 100.0% | 12.7%(+87.3)#4 | 12.4%(+87.6)#551 |
| 5. | Geneseo | 100.0% | 12.7%(+87.3)#5 | 12.4%(+87.6)#638 |
| 6. | Severy | 100.0% | 12.7%(+87.3)#6 | 12.4%(+87.6)#641 |
| 7. | Toronto | 100.0% | 12.7%(+87.3)#7 | 12.4%(+87.6)#654 |
| 8. | Mcdonald | 100.0% | 12.7%(+87.3)#8 | 12.4%(+87.6)#676 |
| 9. | Lincolnville | 100.0% | 12.7%(+87.3)#9 | 12.4%(+87.6)#679 |
| 10. | Smolan | 100.0% | 12.7%(+87.3)#10 | 12.4%(+87.6)#703 |
| 11. | Circleville | 100.0% | 12.7%(+87.3)#11 | 12.4%(+87.6)#735 |
| 12. | Redfield | 100.0% | 12.7%(+87.3)#12 | 12.4%(+87.6)#799 |
| 13. | Powhattan | 100.0% | 12.7%(+87.3)#13 | 12.4%(+87.6)#824 |
| 14. | Clayton | 100.0% | 12.7%(+87.3)#14 | 12.4%(+87.6)#837 |
| 15. | Olivet | 100.0% | 12.7%(+87.3)#15 | 12.4%(+87.6)#842 |
| 16. | Benedict | 100.0% | 12.7%(+87.3)#16 | 12.4%(+87.6)#843 |
| 17. | Windom | 100.0% | 12.7%(+87.3)#17 | 12.4%(+87.6)#845 |
| 18. | Kickapoo Site 7 | 100.0% | 12.7%(+87.3)#18 | 12.4%(+87.6)#853 |
| 19. | Soldier | 100.0% | 12.7%(+87.3)#19 | 12.4%(+87.6)#868 |
| 20. | Mahaska | 100.0% | 12.7%(+87.3)#20 | 12.4%(+87.6)#872 |
| 21. | Barnard | 100.0% | 12.7%(+87.3)#21 | 12.4%(+87.6)#879 |
| 22. | Menlo | 100.0% | 12.7%(+87.3)#22 | 12.4%(+87.6)#892 |
| 23. | Mildred | 100.0% | 12.7%(+87.3)#23 | 12.4%(+87.6)#910 |
| 24. | Sublette | 84.6% | 12.7%(+71.9)#24 | 12.4%(+72.2)#1,021 |
| 25. | Preston | 83.3% | 12.7%(+70.6)#25 | 12.4%(+70.9)#1,043 |
| 26. | South Hutchinson | 81.8% | 12.7%(+69.1)#26 | 12.4%(+69.4)#1,059 |
| 27. | Medicine Lodge | 78.6% | 12.7%(+65.9)#27 | 12.4%(+66.1)#1,128 |
| 28. | Chetopa | 77.8% | 12.7%(+65.1)#28 | 12.4%(+65.3)#1,140 |
| 29. | Mayetta | 75.0% | 12.7%(+62.3)#29 | 12.4%(+62.6)#1,205 |
| 30. | Cawker City | 72.7% | 12.7%(+60.0)#30 | 12.4%(+60.3)#1,260 |
| 31. | Downs | 71.4% | 12.7%(+58.7)#31 | 12.4%(+59.0)#1,288 |
| 32. | Glen Elder | 71.4% | 12.7%(+58.7)#32 | 12.4%(+59.0)#1,289 |
| 33. | Ulysses | 69.7% | 12.7%(+57.0)#33 | 12.4%(+57.3)#1,354 |
| 34. | Wilson | 66.7% | 12.7%(+54.0)#34 | 12.4%(+54.2)#1,443 |
| 35. | Greensburg | 66.7% | 12.7%(+54.0)#35 | 12.4%(+54.2)#1,448 |
| 36. | Hamilton | 66.7% | 12.7%(+54.0)#36 | 12.4%(+54.2)#1,478 |
| 37. | Logan | 65.4% | 12.7%(+52.7)#37 | 12.4%(+52.9)#1,506 |
| 38. | Wakeeney | 65.3% | 12.7%(+52.6)#38 | 12.4%(+52.9)#1,509 |
| 39. | Tonganoxie | 65.0% | 12.7%(+52.3)#39 | 12.4%(+52.6)#1,514 |
| 40. | Bird City | 64.7% | 12.7%(+52.0)#40 | 12.4%(+52.3)#1,531 |
| 41. | Benton | 63.6% | 12.7%(+50.9)#41 | 12.4%(+51.2)#1,565 |
| 42. | Highland | 60.0% | 12.7%(+47.3)#42 | 12.4%(+47.6)#1,716 |
| 43. | Spearville | 60.0% | 12.7%(+47.3)#43 | 12.4%(+47.6)#1,717 |
| 44. | Russell | 59.2% | 12.7%(+46.5)#44 | 12.4%(+46.8)#1,780 |
| 45. | Bison | 57.1% | 12.7%(+44.4)#45 | 12.4%(+44.7)#1,870 |
| 46. | Fort Scott | 55.6% | 12.7%(+42.9)#46 | 12.4%(+43.2)#1,925 |
| 47. | Whitewater | 55.6% | 12.7%(+42.9)#47 | 12.4%(+43.1)#1,934 |
| 48. | Fredonia | 53.8% | 12.7%(+41.1)#48 | 12.4%(+41.4)#2,019 |
| 49. | Weir | 50.0% | 12.7%(+37.3)#49 | 12.4%(+37.6)#2,245 |
| 50. | Moran | 50.0% | 12.7%(+37.3)#50 | 12.4%(+37.6)#2,282 |
| 51. | Hartford | 50.0% | 12.7%(+37.3)#51 | 12.4%(+37.6)#2,286 |
| 52. | Thayer | 50.0% | 12.7%(+37.3)#52 | 12.4%(+37.6)#2,291 |
| 53. | Walton | 50.0% | 12.7%(+37.3)#53 | 12.4%(+37.6)#2,326 |
| 54. | Sylvia | 50.0% | 12.7%(+37.3)#54 | 12.4%(+37.6)#2,365 |
| 55. | Burr Oak | 50.0% | 12.7%(+37.3)#55 | 12.4%(+37.6)#2,377 |
| 56. | Jennings | 50.0% | 12.7%(+37.3)#56 | 12.4%(+37.6)#2,386 |
| 57. | La Cygne | 47.3% | 12.7%(+34.6)#57 | 12.4%(+34.8)#2,504 |
| 58. | Goodland | 47.0% | 12.7%(+34.3)#58 | 12.4%(+34.6)#2,523 |
| 59. | Independence | 45.3% | 12.7%(+32.6)#59 | 12.4%(+32.9)#2,634 |
| 60. | Rolla | 44.8% | 12.7%(+32.1)#60 | 12.4%(+32.4)#2,665 |
| 61. | Chapman | 44.4% | 12.7%(+31.7)#61 | 12.4%(+32.0)#2,684 |
| 62. | De Soto | 43.9% | 12.7%(+31.2)#62 | 12.4%(+31.5)#2,725 |
| 63. | Hill City | 43.2% | 12.7%(+30.5)#63 | 12.4%(+30.8)#2,768 |
| 64. | Sedgwick | 43.2% | 12.7%(+30.5)#64 | 12.4%(+30.7)#2,773 |
| 65. | Lucas | 42.9% | 12.7%(+30.2)#65 | 12.4%(+30.4)#2,810 |
| 66. | Osage City | 41.8% | 12.7%(+29.1)#66 | 12.4%(+29.4)#2,881 |
| 67. | Scranton | 41.4% | 12.7%(+28.7)#67 | 12.4%(+28.9)#2,930 |
| 68. | Westmoreland | 40.0% | 12.7%(+27.3)#68 | 12.4%(+27.6)#3,052 |
| 69. | Chase | 40.0% | 12.7%(+27.3)#69 | 12.4%(+27.6)#3,067 |
| 70. | Sylvan Grove | 40.0% | 12.7%(+27.3)#70 | 12.4%(+27.6)#3,082 |
| 71. | Niotaze | 40.0% | 12.7%(+27.3)#71 | 12.4%(+27.6)#3,102 |
| 72. | El Dorado | 39.7% | 12.7%(+27.0)#72 | 12.4%(+27.2)#3,119 |
| 73. | Ellis | 39.6% | 12.7%(+26.9)#73 | 12.4%(+27.1)#3,126 |
| 74. | Belle Plaine | 38.9% | 12.7%(+26.2)#74 | 12.4%(+26.5)#3,173 |
| 75. | Baxter Springs | 38.5% | 12.7%(+25.8)#75 | 12.4%(+26.0)#3,200 |
| 76. | Damar | 37.5% | 12.7%(+24.8)#76 | 12.4%(+25.1)#3,302 |
| 77. | Eudora | 36.8% | 12.7%(+24.1)#77 | 12.4%(+24.3)#3,354 |
| 78. | Ness City | 36.4% | 12.7%(+23.7)#78 | 12.4%(+23.9)#3,383 |
| 79. | Liberal | 34.6% | 12.7%(+21.9)#79 | 12.4%(+22.2)#3,576 |
| 80. | Waterville | 33.3% | 12.7%(+20.6)#80 | 12.4%(+20.9)#3,713 |
| 81. | Natoma | 33.3% | 12.7%(+20.6)#81 | 12.4%(+20.9)#3,754 |
| 82. | Almena | 33.3% | 12.7%(+20.6)#82 | 12.4%(+20.9)#3,756 |
| 83. | Colony | 33.3% | 12.7%(+20.6)#83 | 12.4%(+20.9)#3,763 |
| 84. | Allen | 33.3% | 12.7%(+20.6)#84 | 12.4%(+20.9)#3,786 |
| 85. | Rexford | 33.3% | 12.7%(+20.6)#85 | 12.4%(+20.9)#3,813 |
| 86. | Cullison | 33.3% | 12.7%(+20.6)#86 | 12.4%(+20.9)#3,824 |
| 87. | Bonner Springs | 33.0% | 12.7%(+20.3)#87 | 12.4%(+20.6)#3,841 |
| 88. | Eureka | 32.9% | 12.7%(+20.2)#88 | 12.4%(+20.5)#3,848 |
| 89. | Clay Center | 31.0% | 12.7%(+18.3)#89 | 12.4%(+18.5)#4,052 |
| 90. | Pleasanton | 30.4% | 12.7%(+17.7)#90 | 12.4%(+17.9)#4,125 |
| 91. | Lewis | 30.0% | 12.7%(+17.3)#91 | 12.4%(+17.6)#4,178 |
| 92. | Galena | 29.8% | 12.7%(+17.1)#92 | 12.4%(+17.4)#4,210 |
| 93. | Herington | 28.6% | 12.7%(+15.9)#93 | 12.4%(+16.1)#4,331 |
| 94. | Perry | 28.6% | 12.7%(+15.9)#94 | 12.4%(+16.1)#4,337 |
| 95. | Jamestown | 28.6% | 12.7%(+15.9)#95 | 12.4%(+16.1)#4,370 |
| 96. | Kickapoo Site 5 | 28.6% | 12.7%(+15.9)#96 | 12.4%(+16.1)#4,375 |
| 97. | Manhattan | 28.5% | 12.7%(+15.8)#97 | 12.4%(+16.1)#4,378 |
| 98. | Concordia | 27.8% | 12.7%(+15.1)#98 | 12.4%(+15.4)#4,462 |
| 99. | Osawatomie | 26.5% | 12.7%(+13.8)#99 | 12.4%(+14.1)#4,650 |
| 100. | Augusta | 26.1% | 12.7%(+13.4)#100 | 12.4%(+13.7)#4,700 |
Common Questions
What are the Top 10 Cities with the Highest Poverty Level Among Single Males in Kansas?
Top 10 Cities with the Highest Poverty Level Among Single Males in Kansas are:
#1
100.0%
#2
100.0%
#3
100.0%
#4
100.0%
#5
100.0%
#6
100.0%
#7
100.0%
#8
100.0%
#9
100.0%
#10
100.0%
What city has the Highest Poverty Level Among Single Males in Kansas?
Phillipsburg has the Highest Poverty Level Among Single Males in Kansas with 100.0%.
What is the Poverty Level Among Single Males in the State of Kansas?
Poverty Level Among Single Males in Kansas is 12.7%.
What is the Poverty Level Among Single Males in the United States?
Poverty Level Among Single Males in the United States is 12.4%.