Cities with the Highest Poverty Level Among Single Males in Virginia
RELATED REPORTS & OPTIONS
Highest Poverty | Single Male
Virginia
Compare Cities
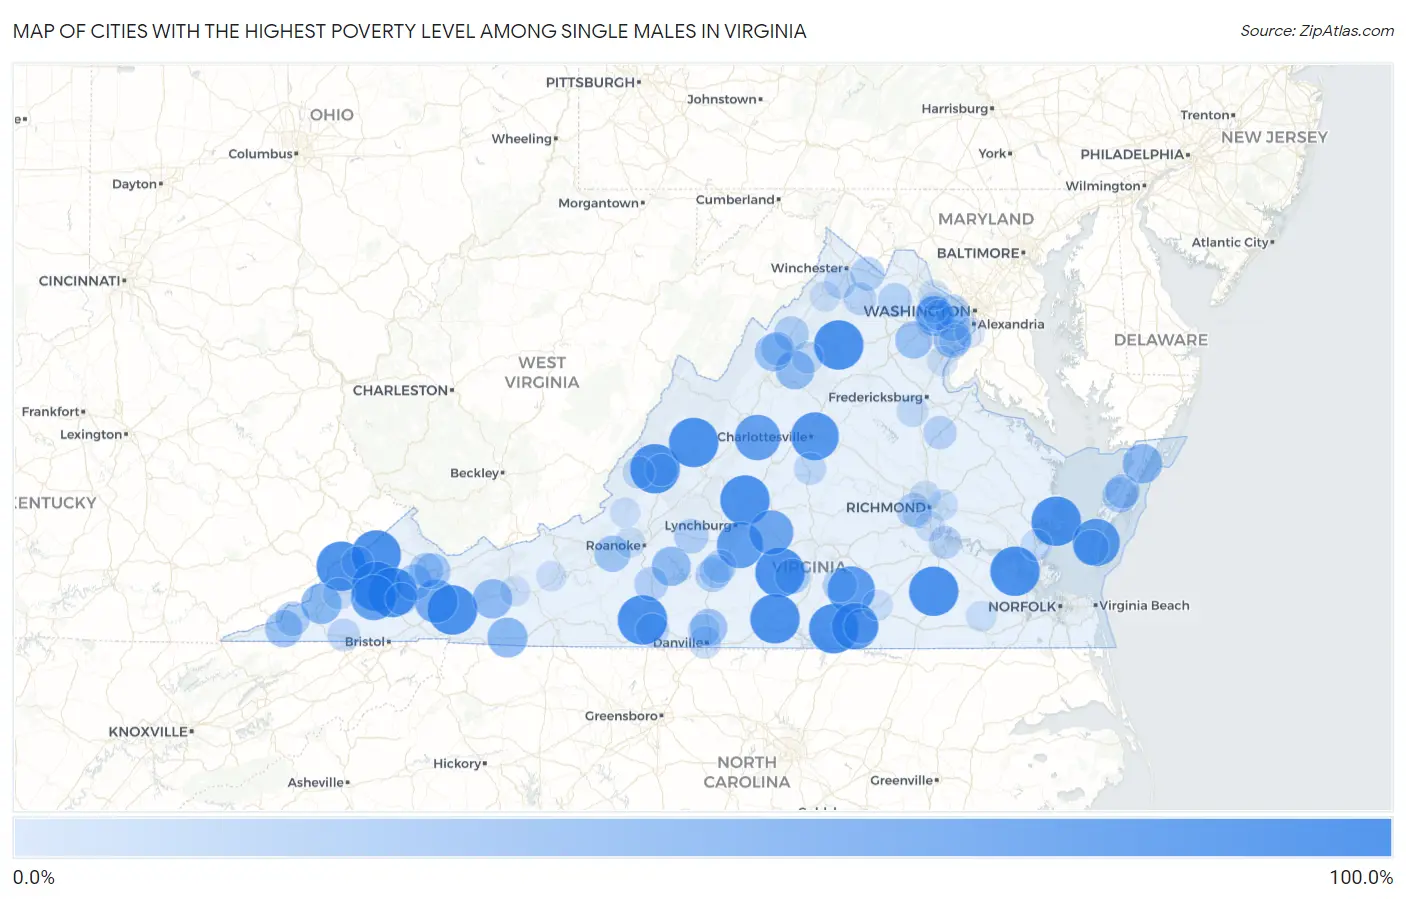
Map of Cities with the Highest Poverty Level Among Single Males in Virginia
0.0%
100.0%
Cities with the Highest Poverty Level Among Single Males in Virginia
| City | Single Male Poverty | vs State | vs National | |
| 1. | Amherst | 100.0% | 9.7%(+90.3)#1 | 12.4%(+87.6)#83 |
| 2. | Stanleytown | 100.0% | 9.7%(+90.3)#2 | 12.4%(+87.6)#153 |
| 3. | Mathews | 100.0% | 9.7%(+90.3)#3 | 12.4%(+87.6)#215 |
| 4. | Pound | 100.0% | 9.7%(+90.3)#4 | 12.4%(+87.6)#261 |
| 5. | Rushmere | 100.0% | 9.7%(+90.3)#5 | 12.4%(+87.6)#268 |
| 6. | Seven Mile Ford | 100.0% | 9.7%(+90.3)#6 | 12.4%(+87.6)#335 |
| 7. | Haysi | 100.0% | 9.7%(+90.3)#7 | 12.4%(+87.6)#370 |
| 8. | Dante | 100.0% | 9.7%(+90.3)#8 | 12.4%(+87.6)#402 |
| 9. | Selma | 100.0% | 9.7%(+90.3)#9 | 12.4%(+87.6)#436 |
| 10. | Phenix | 100.0% | 9.7%(+90.3)#10 | 12.4%(+87.6)#448 |
| 11. | Cleveland | 100.0% | 9.7%(+90.3)#11 | 12.4%(+87.6)#499 |
| 12. | Stony Creek | 100.0% | 9.7%(+90.3)#12 | 12.4%(+87.6)#501 |
| 13. | Sperryville | 100.0% | 9.7%(+90.3)#13 | 12.4%(+87.6)#509 |
| 14. | Goshen | 100.0% | 9.7%(+90.3)#14 | 12.4%(+87.6)#517 |
| 15. | Baskerville | 100.0% | 9.7%(+90.3)#15 | 12.4%(+87.6)#619 |
| 16. | Scottsburg | 100.0% | 9.7%(+90.3)#16 | 12.4%(+87.6)#756 |
| 17. | Stevens Creek | 100.0% | 9.7%(+90.3)#17 | 12.4%(+87.6)#779 |
| 18. | Pantops | 92.3% | 9.7%(+82.6)#18 | 12.4%(+79.9)#931 |
| 19. | Kenbridge | 90.0% | 9.7%(+80.3)#19 | 12.4%(+77.6)#946 |
| 20. | Cheriton | 89.5% | 9.7%(+79.8)#20 | 12.4%(+77.0)#952 |
| 21. | La Crosse | 87.2% | 9.7%(+77.6)#21 | 12.4%(+74.8)#980 |
| 22. | Rustburg | 85.6% | 9.7%(+75.9)#22 | 12.4%(+73.1)#1,007 |
| 23. | Meadowview | 85.2% | 9.7%(+75.5)#23 | 12.4%(+72.7)#1,009 |
| 24. | Lyndhurst | 82.7% | 9.7%(+73.0)#24 | 12.4%(+70.3)#1,048 |
| 25. | St Paul | 81.8% | 9.7%(+72.1)#25 | 12.4%(+69.4)#1,060 |
| 26. | Appomattox | 77.4% | 9.7%(+67.7)#26 | 12.4%(+65.0)#1,152 |
| 27. | Saltville | 72.4% | 9.7%(+62.7)#27 | 12.4%(+59.9)#1,265 |
| 28. | Rio | 66.7% | 9.7%(+57.0)#28 | 12.4%(+54.2)#1,436 |
| 29. | Big Stone Gap | 59.1% | 9.7%(+49.4)#29 | 12.4%(+46.6)#1,787 |
| 30. | Independence | 58.3% | 9.7%(+48.7)#30 | 12.4%(+45.9)#1,811 |
| 31. | Fair Lakes | 55.8% | 9.7%(+46.1)#31 | 12.4%(+43.3)#1,922 |
| 32. | Mappsville | 55.7% | 9.7%(+46.0)#32 | 12.4%(+43.3)#1,923 |
| 33. | Rural Retreat | 55.3% | 9.7%(+45.6)#33 | 12.4%(+42.9)#1,956 |
| 34. | Westlake Corner | 54.1% | 9.7%(+44.4)#34 | 12.4%(+41.6)#2,015 |
| 35. | Shenandoah | 52.4% | 9.7%(+42.7)#35 | 12.4%(+39.9)#2,111 |
| 36. | Laurel Hill | 49.3% | 9.7%(+39.6)#36 | 12.4%(+36.9)#2,411 |
| 37. | Broadway | 48.6% | 9.7%(+38.9)#37 | 12.4%(+36.2)#2,438 |
| 38. | Nokesville | 46.4% | 9.7%(+36.7)#38 | 12.4%(+34.0)#2,557 |
| 39. | Jonesville | 46.2% | 9.7%(+36.5)#39 | 12.4%(+33.7)#2,582 |
| 40. | Blairs | 45.3% | 9.7%(+35.6)#40 | 12.4%(+32.8)#2,636 |
| 41. | Elliston | 42.3% | 9.7%(+32.6)#41 | 12.4%(+29.9)#2,849 |
| 42. | Honaker | 40.9% | 9.7%(+31.2)#42 | 12.4%(+28.5)#2,967 |
| 43. | Greenbriar | 40.8% | 9.7%(+31.1)#43 | 12.4%(+28.4)#2,976 |
| 44. | Richlands | 40.4% | 9.7%(+30.7)#44 | 12.4%(+28.0)#3,003 |
| 45. | Cape Charles | 37.5% | 9.7%(+27.8)#45 | 12.4%(+25.1)#3,273 |
| 46. | Charlotte Court House | 37.5% | 9.7%(+27.8)#46 | 12.4%(+25.1)#3,282 |
| 47. | Keller | 37.5% | 9.7%(+27.8)#47 | 12.4%(+25.1)#3,297 |
| 48. | Brodnax | 35.8% | 9.7%(+26.2)#48 | 12.4%(+23.4)#3,445 |
| 49. | Kings Park | 35.7% | 9.7%(+26.0)#49 | 12.4%(+23.3)#3,452 |
| 50. | Mount Jackson | 35.7% | 9.7%(+26.0)#50 | 12.4%(+23.3)#3,456 |
| 51. | Pennington Gap | 35.1% | 9.7%(+25.4)#51 | 12.4%(+22.6)#3,527 |
| 52. | Raven | 34.5% | 9.7%(+24.8)#52 | 12.4%(+22.0)#3,583 |
| 53. | Victoria | 34.2% | 9.7%(+24.5)#53 | 12.4%(+21.8)#3,609 |
| 54. | Bedford | 34.2% | 9.7%(+24.5)#54 | 12.4%(+21.7)#3,610 |
| 55. | Melfa | 33.3% | 9.7%(+23.7)#55 | 12.4%(+20.9)#3,746 |
| 56. | Rocky Mount | 32.4% | 9.7%(+22.7)#56 | 12.4%(+20.0)#3,905 |
| 57. | Motley | 32.3% | 9.7%(+22.6)#57 | 12.4%(+19.8)#3,919 |
| 58. | Bon Air | 32.0% | 9.7%(+22.4)#58 | 12.4%(+19.6)#3,937 |
| 59. | Timberville | 31.9% | 9.7%(+22.2)#59 | 12.4%(+19.5)#3,951 |
| 60. | Middleburg | 31.6% | 9.7%(+21.9)#60 | 12.4%(+19.1)#3,990 |
| 61. | Berryville | 31.3% | 9.7%(+21.6)#61 | 12.4%(+18.9)#4,016 |
| 62. | Dunn Loring | 30.8% | 9.7%(+21.1)#62 | 12.4%(+18.3)#4,066 |
| 63. | Hurt | 30.8% | 9.7%(+21.1)#63 | 12.4%(+18.3)#4,072 |
| 64. | Rose Hill Cdp Lee County | 30.8% | 9.7%(+21.1)#64 | 12.4%(+18.3)#4,082 |
| 65. | Bowling Green | 30.0% | 9.7%(+20.3)#65 | 12.4%(+17.6)#4,163 |
| 66. | Martinsville | 29.0% | 9.7%(+19.3)#66 | 12.4%(+16.5)#4,295 |
| 67. | Altavista | 28.0% | 9.7%(+18.3)#67 | 12.4%(+15.6)#4,434 |
| 68. | Hopewell | 27.9% | 9.7%(+18.2)#68 | 12.4%(+15.4)#4,458 |
| 69. | Shenandoah Farms | 27.8% | 9.7%(+18.1)#69 | 12.4%(+15.3)#4,466 |
| 70. | Gate City | 26.7% | 9.7%(+17.0)#70 | 12.4%(+14.2)#4,632 |
| 71. | Hutchison | 26.3% | 9.7%(+16.7)#71 | 12.4%(+13.9)#4,668 |
| 72. | Danville | 25.9% | 9.7%(+16.3)#72 | 12.4%(+13.5)#4,726 |
| 73. | Scottsville | 25.0% | 9.7%(+15.3)#73 | 12.4%(+12.6)#4,898 |
| 74. | Iron Gate | 25.0% | 9.7%(+15.3)#74 | 12.4%(+12.6)#4,920 |
| 75. | Covington | 24.7% | 9.7%(+15.0)#75 | 12.4%(+12.3)#4,986 |
| 76. | Mount Hermon | 24.5% | 9.7%(+14.8)#76 | 12.4%(+12.1)#5,013 |
| 77. | Stephens City | 24.2% | 9.7%(+14.6)#77 | 12.4%(+11.8)#5,061 |
| 78. | Lebanon | 23.8% | 9.7%(+14.1)#78 | 12.4%(+11.4)#5,120 |
| 79. | Stanley | 23.8% | 9.7%(+14.1)#79 | 12.4%(+11.4)#5,123 |
| 80. | Clintwood | 23.1% | 9.7%(+13.4)#80 | 12.4%(+10.6)#5,238 |
| 81. | Lorton | 22.9% | 9.7%(+13.2)#81 | 12.4%(+10.5)#5,274 |
| 82. | Norton | 22.6% | 9.7%(+12.9)#82 | 12.4%(+10.2)#5,325 |
| 83. | Spotsylvania Courthouse | 22.4% | 9.7%(+12.7)#83 | 12.4%(+9.98)#5,356 |
| 84. | Gloucester Point | 21.6% | 9.7%(+12.0)#84 | 12.4%(+9.21)#5,495 |
| 85. | Lakeside | 20.5% | 9.7%(+10.8)#85 | 12.4%(+8.06)#5,721 |
| 86. | Highland Springs | 19.9% | 9.7%(+10.2)#86 | 12.4%(+7.47)#5,909 |
| 87. | Franklin Farm | 19.6% | 9.7%(+9.87)#87 | 12.4%(+7.12)#5,954 |
| 88. | Strasburg | 19.2% | 9.7%(+9.48)#88 | 12.4%(+6.73)#6,034 |
| 89. | Sterling | 18.6% | 9.7%(+8.89)#89 | 12.4%(+6.14)#6,142 |
| 90. | Sedley | 18.2% | 9.7%(+8.50)#90 | 12.4%(+5.75)#6,228 |
| 91. | Alberta | 18.2% | 9.7%(+8.50)#91 | 12.4%(+5.75)#6,244 |
| 92. | Salem | 18.1% | 9.7%(+8.45)#92 | 12.4%(+5.70)#6,252 |
| 93. | Triangle | 17.8% | 9.7%(+8.11)#93 | 12.4%(+5.36)#6,300 |
| 94. | Pulaski | 17.8% | 9.7%(+8.09)#94 | 12.4%(+5.33)#6,306 |
| 95. | Bellwood | 17.1% | 9.7%(+7.39)#95 | 12.4%(+4.64)#6,459 |
| 96. | Fair Oaks | 16.9% | 9.7%(+7.17)#96 | 12.4%(+4.42)#6,499 |
| 97. | Wytheville | 16.7% | 9.7%(+7.05)#97 | 12.4%(+4.30)#6,515 |
| 98. | Hybla Valley | 16.7% | 9.7%(+7.03)#98 | 12.4%(+4.28)#6,517 |
| 99. | New Castle | 16.7% | 9.7%(+6.98)#99 | 12.4%(+4.23)#6,610 |
| 100. | Manchester | 15.7% | 9.7%(+6.03)#100 | 12.4%(+3.28)#6,818 |
Common Questions
What are the Top 10 Cities with the Highest Poverty Level Among Single Males in Virginia?
Top 10 Cities with the Highest Poverty Level Among Single Males in Virginia are:
#1
100.0%
#2
100.0%
#3
100.0%
#4
100.0%
#5
100.0%
#6
100.0%
#7
100.0%
#8
100.0%
#9
100.0%
#10
100.0%
What city has the Highest Poverty Level Among Single Males in Virginia?
Amherst has the Highest Poverty Level Among Single Males in Virginia with 100.0%.
What is the Poverty Level Among Single Males in the State of Virginia?
Poverty Level Among Single Males in Virginia is 9.7%.
What is the Poverty Level Among Single Males in the United States?
Poverty Level Among Single Males in the United States is 12.4%.