Cities with the Highest Poverty Level Among Single Males in Tennessee
RELATED REPORTS & OPTIONS
Highest Poverty | Single Male
Tennessee
Compare Cities
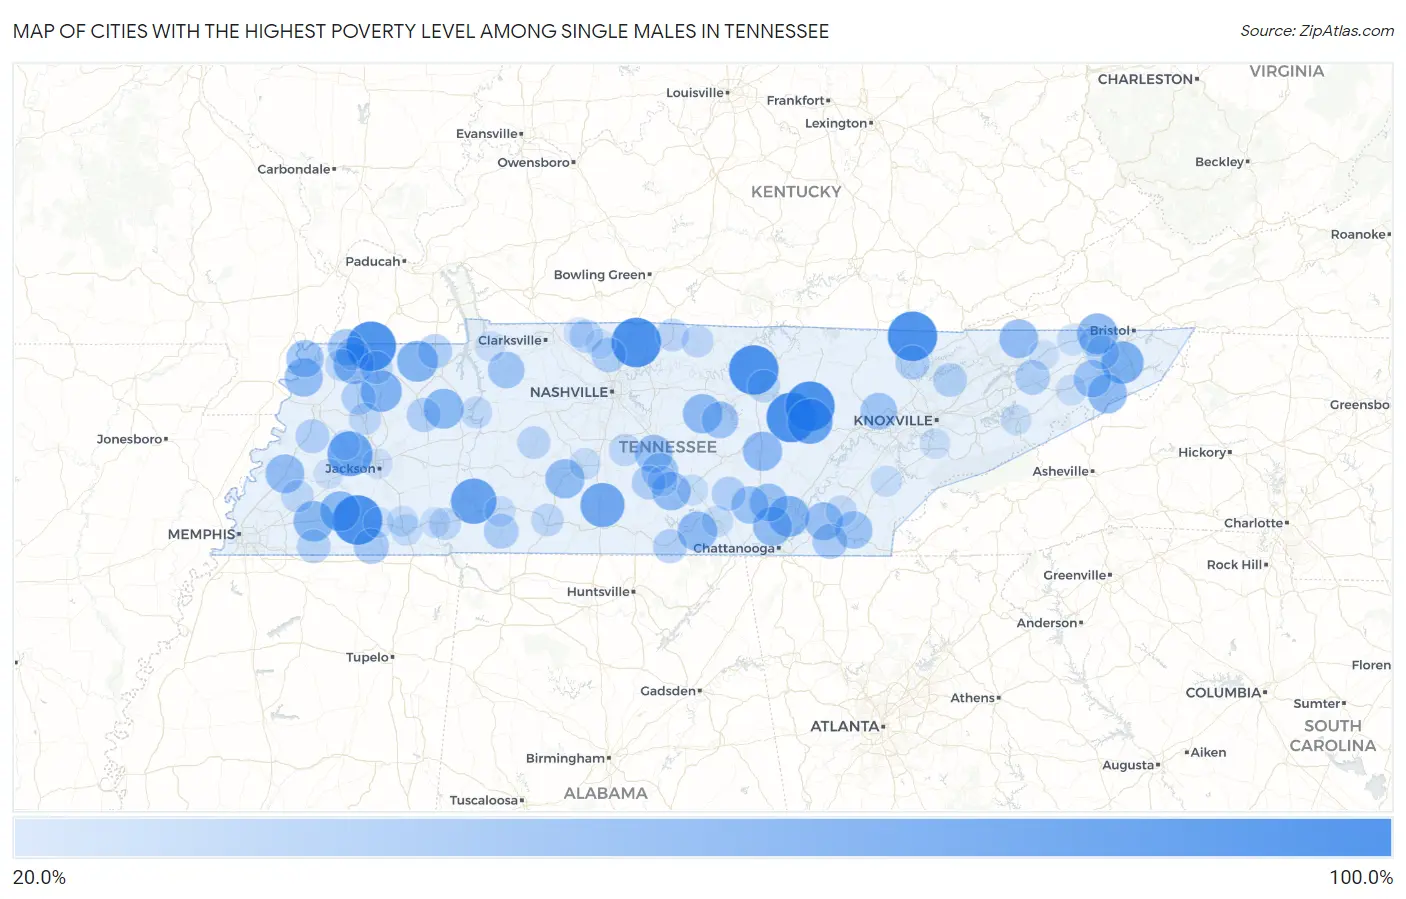
Map of Cities with the Highest Poverty Level Among Single Males in Tennessee
0.0%
100.0%
Cities with the Highest Poverty Level Among Single Males in Tennessee
| City | Single Male Poverty | vs State | vs National | |
| 1. | Bolivar | 100.0% | 14.7%(+85.3)#1 | 12.4%(+87.6)#13 |
| 2. | South Fulton | 100.0% | 14.7%(+85.3)#2 | 12.4%(+87.6)#85 |
| 3. | Jellico | 100.0% | 14.7%(+85.3)#3 | 12.4%(+87.6)#113 |
| 4. | Embreeville | 100.0% | 14.7%(+85.3)#4 | 12.4%(+87.6)#237 |
| 5. | John Sevier | 100.0% | 14.7%(+85.3)#5 | 12.4%(+87.6)#280 |
| 6. | Dodson Branch | 100.0% | 14.7%(+85.3)#6 | 12.4%(+87.6)#288 |
| 7. | Pleasant Hill | 100.0% | 14.7%(+85.3)#7 | 12.4%(+87.6)#373 |
| 8. | Bowman | 100.0% | 14.7%(+85.3)#8 | 12.4%(+87.6)#459 |
| 9. | New Deal | 100.0% | 14.7%(+85.3)#9 | 12.4%(+87.6)#581 |
| 10. | Clifton | 84.2% | 14.7%(+69.5)#10 | 12.4%(+71.8)#1,026 |
| 11. | Crossville | 83.0% | 14.7%(+68.4)#11 | 12.4%(+70.6)#1,045 |
| 12. | Bells | 82.4% | 14.7%(+67.8)#12 | 12.4%(+70.0)#1,050 |
| 13. | Biltmore | 79.1% | 14.7%(+64.4)#13 | 12.4%(+66.6)#1,119 |
| 14. | Cornersville | 78.9% | 14.7%(+64.3)#14 | 12.4%(+66.5)#1,121 |
| 15. | Watauga | 71.4% | 14.7%(+56.8)#15 | 12.4%(+59.0)#1,286 |
| 16. | Greenfield | 67.5% | 14.7%(+52.8)#16 | 12.4%(+55.1)#1,402 |
| 17. | Mowbray Mountain | 66.7% | 14.7%(+52.0)#17 | 12.4%(+54.2)#1,425 |
| 18. | Cottage Grove | 66.7% | 14.7%(+52.0)#18 | 12.4%(+54.2)#1,491 |
| 19. | Bloomingdale | 65.2% | 14.7%(+50.6)#19 | 12.4%(+52.8)#1,511 |
| 20. | Rives | 65.0% | 14.7%(+50.3)#20 | 12.4%(+52.6)#1,521 |
| 21. | Somerville | 64.2% | 14.7%(+49.5)#21 | 12.4%(+51.8)#1,551 |
| 22. | Whiteville | 63.0% | 14.7%(+48.3)#22 | 12.4%(+50.5)#1,594 |
| 23. | Bruceton | 62.5% | 14.7%(+47.8)#23 | 12.4%(+50.1)#1,614 |
| 24. | Cowan | 60.9% | 14.7%(+46.2)#24 | 12.4%(+48.4)#1,682 |
| 25. | Spencer | 60.0% | 14.7%(+45.3)#25 | 12.4%(+47.6)#1,714 |
| 26. | Liberty | 60.0% | 14.7%(+45.3)#26 | 12.4%(+47.6)#1,741 |
| 27. | Mount Pleasant | 59.6% | 14.7%(+44.9)#27 | 12.4%(+47.1)#1,767 |
| 28. | Erwin | 59.3% | 14.7%(+44.6)#28 | 12.4%(+46.9)#1,775 |
| 29. | Lone Oak | 58.8% | 14.7%(+44.2)#29 | 12.4%(+46.4)#1,797 |
| 30. | Covington | 58.3% | 14.7%(+43.7)#30 | 12.4%(+45.9)#1,803 |
| 31. | Sneedville | 58.0% | 14.7%(+43.4)#31 | 12.4%(+45.6)#1,824 |
| 32. | Normandy | 57.1% | 14.7%(+42.5)#32 | 12.4%(+44.7)#1,873 |
| 33. | Ridgely | 56.2% | 14.7%(+41.6)#33 | 12.4%(+43.8)#1,901 |
| 34. | Hopewell | 54.8% | 14.7%(+40.1)#34 | 12.4%(+42.3)#1,973 |
| 35. | Dunlap | 54.6% | 14.7%(+39.9)#35 | 12.4%(+42.2)#1,976 |
| 36. | Christiana | 54.2% | 14.7%(+39.5)#36 | 12.4%(+41.7)#2,006 |
| 37. | Benton | 53.1% | 14.7%(+38.5)#37 | 12.4%(+40.7)#2,065 |
| 38. | Palmer | 52.9% | 14.7%(+38.3)#38 | 12.4%(+40.5)#2,078 |
| 39. | Telford | 52.8% | 14.7%(+38.2)#39 | 12.4%(+40.4)#2,089 |
| 40. | Tiptonville | 52.6% | 14.7%(+38.0)#40 | 12.4%(+40.2)#2,098 |
| 41. | Smithville | 50.0% | 14.7%(+35.3)#41 | 12.4%(+37.6)#2,187 |
| 42. | Coalfield | 50.0% | 14.7%(+35.3)#42 | 12.4%(+37.6)#2,196 |
| 43. | Erin | 50.0% | 14.7%(+35.3)#43 | 12.4%(+37.6)#2,214 |
| 44. | Bell Buckle | 50.0% | 14.7%(+35.3)#44 | 12.4%(+37.6)#2,266 |
| 45. | Woodland Mills | 50.0% | 14.7%(+35.3)#45 | 12.4%(+37.6)#2,274 |
| 46. | Middleton | 45.0% | 14.7%(+30.3)#46 | 12.4%(+32.6)#2,655 |
| 47. | Wildwood Lake | 44.8% | 14.7%(+30.1)#47 | 12.4%(+32.3)#2,668 |
| 48. | Greenbrier | 42.9% | 14.7%(+28.2)#48 | 12.4%(+30.4)#2,784 |
| 49. | Collinwood | 42.9% | 14.7%(+28.2)#49 | 12.4%(+30.4)#2,793 |
| 50. | Bulls Gap | 42.9% | 14.7%(+28.2)#50 | 12.4%(+30.4)#2,799 |
| 51. | Orebank | 42.1% | 14.7%(+27.4)#51 | 12.4%(+29.7)#2,866 |
| 52. | Rutherford | 41.2% | 14.7%(+26.5)#52 | 12.4%(+28.7)#2,941 |
| 53. | Puryear | 41.2% | 14.7%(+26.5)#53 | 12.4%(+28.7)#2,946 |
| 54. | La Follette | 41.1% | 14.7%(+26.4)#54 | 12.4%(+28.7)#2,952 |
| 55. | Huntingdon | 40.8% | 14.7%(+26.2)#55 | 12.4%(+28.4)#2,974 |
| 56. | Huntland | 40.0% | 14.7%(+25.3)#56 | 12.4%(+27.6)#3,031 |
| 57. | Altamont | 40.0% | 14.7%(+25.3)#57 | 12.4%(+27.6)#3,038 |
| 58. | Gates | 40.0% | 14.7%(+25.3)#58 | 12.4%(+27.6)#3,050 |
| 59. | Shelbyville | 39.9% | 14.7%(+25.2)#59 | 12.4%(+27.4)#3,113 |
| 60. | Maynardville | 39.2% | 14.7%(+24.6)#60 | 12.4%(+26.8)#3,155 |
| 61. | Spurgeon | 38.9% | 14.7%(+24.2)#61 | 12.4%(+26.5)#3,169 |
| 62. | Moscow | 38.9% | 14.7%(+24.2)#62 | 12.4%(+26.5)#3,176 |
| 63. | Lynchburg | 38.8% | 14.7%(+24.1)#63 | 12.4%(+26.3)#3,184 |
| 64. | Cedar Hill | 36.8% | 14.7%(+22.2)#64 | 12.4%(+24.4)#3,349 |
| 65. | Union City | 36.7% | 14.7%(+22.0)#65 | 12.4%(+24.3)#3,361 |
| 66. | Martin | 36.4% | 14.7%(+21.7)#66 | 12.4%(+23.9)#3,374 |
| 67. | Centerville | 35.7% | 14.7%(+21.1)#67 | 12.4%(+23.3)#3,453 |
| 68. | Westmoreland | 35.7% | 14.7%(+21.1)#68 | 12.4%(+23.3)#3,454 |
| 69. | Algood | 34.7% | 14.7%(+20.0)#69 | 12.4%(+22.2)#3,573 |
| 70. | Mason | 34.4% | 14.7%(+19.7)#70 | 12.4%(+21.9)#3,596 |
| 71. | Lawrenceburg | 34.2% | 14.7%(+19.6)#71 | 12.4%(+21.8)#3,605 |
| 72. | Trenton | 33.3% | 14.7%(+18.7)#72 | 12.4%(+20.9)#3,663 |
| 73. | Eagleville | 33.3% | 14.7%(+18.7)#73 | 12.4%(+20.9)#3,697 |
| 74. | Lafayette | 33.2% | 14.7%(+18.5)#74 | 12.4%(+20.7)#3,835 |
| 75. | Savannah | 33.0% | 14.7%(+18.4)#75 | 12.4%(+20.6)#3,840 |
| 76. | Troy | 32.4% | 14.7%(+17.8)#76 | 12.4%(+20.0)#3,895 |
| 77. | New Johnsonville | 32.3% | 14.7%(+17.6)#77 | 12.4%(+19.8)#3,917 |
| 78. | Calhoun | 31.2% | 14.7%(+16.6)#78 | 12.4%(+18.8)#4,039 |
| 79. | Monteagle | 30.8% | 14.7%(+16.1)#79 | 12.4%(+18.3)#4,070 |
| 80. | Selmer | 30.4% | 14.7%(+15.7)#80 | 12.4%(+18.0)#4,121 |
| 81. | Columbia | 30.3% | 14.7%(+15.6)#81 | 12.4%(+17.8)#4,132 |
| 82. | Madisonville | 29.6% | 14.7%(+14.9)#82 | 12.4%(+17.2)#4,227 |
| 83. | Church Hill | 29.4% | 14.7%(+14.7)#83 | 12.4%(+16.9)#4,250 |
| 84. | Kingsport | 29.2% | 14.7%(+14.5)#84 | 12.4%(+16.8)#4,265 |
| 85. | Bethel Springs | 29.2% | 14.7%(+14.5)#85 | 12.4%(+16.7)#4,273 |
| 86. | Manchester | 29.0% | 14.7%(+14.3)#86 | 12.4%(+16.5)#4,294 |
| 87. | Waynesboro | 28.6% | 14.7%(+13.9)#87 | 12.4%(+16.1)#4,327 |
| 88. | Hornsby | 28.6% | 14.7%(+13.9)#88 | 12.4%(+16.1)#4,360 |
| 89. | Tusculum | 28.2% | 14.7%(+13.5)#89 | 12.4%(+15.8)#4,409 |
| 90. | Newport | 27.4% | 14.7%(+12.8)#90 | 12.4%(+15.0)#4,522 |
| 91. | Eagleton Village | 26.9% | 14.7%(+12.2)#91 | 12.4%(+14.4)#4,603 |
| 92. | Dover | 26.8% | 14.7%(+12.2)#92 | 12.4%(+14.4)#4,609 |
| 93. | Crump | 26.7% | 14.7%(+12.0)#93 | 12.4%(+14.2)#4,631 |
| 94. | Wartrace | 26.7% | 14.7%(+12.0)#94 | 12.4%(+14.2)#4,639 |
| 95. | Jackson | 26.6% | 14.7%(+11.9)#95 | 12.4%(+14.1)#4,647 |
| 96. | Adams | 26.3% | 14.7%(+11.7)#96 | 12.4%(+13.9)#4,678 |
| 97. | Alamo | 26.2% | 14.7%(+11.6)#97 | 12.4%(+13.8)#4,686 |
| 98. | Brownsville | 25.9% | 14.7%(+11.2)#98 | 12.4%(+13.4)#4,745 |
| 99. | Rogersville | 25.6% | 14.7%(+10.9)#99 | 12.4%(+13.1)#4,772 |
| 100. | Springfield | 25.5% | 14.7%(+10.8)#100 | 12.4%(+13.0)#4,786 |
Common Questions
What are the Top 10 Cities with the Highest Poverty Level Among Single Males in Tennessee?
Top 10 Cities with the Highest Poverty Level Among Single Males in Tennessee are:
#1
100.0%
#2
100.0%
#3
100.0%
#4
100.0%
#5
100.0%
#6
100.0%
#7
100.0%
#8
84.2%
#9
83.0%
#10
82.4%
What city has the Highest Poverty Level Among Single Males in Tennessee?
Bolivar has the Highest Poverty Level Among Single Males in Tennessee with 100.0%.
What is the Poverty Level Among Single Males in the State of Tennessee?
Poverty Level Among Single Males in Tennessee is 14.7%.
What is the Poverty Level Among Single Males in the United States?
Poverty Level Among Single Males in the United States is 12.4%.