Cities with the Highest Poverty Level Among Single Males in Michigan
RELATED REPORTS & OPTIONS
Highest Poverty | Single Male
Michigan
Compare Cities
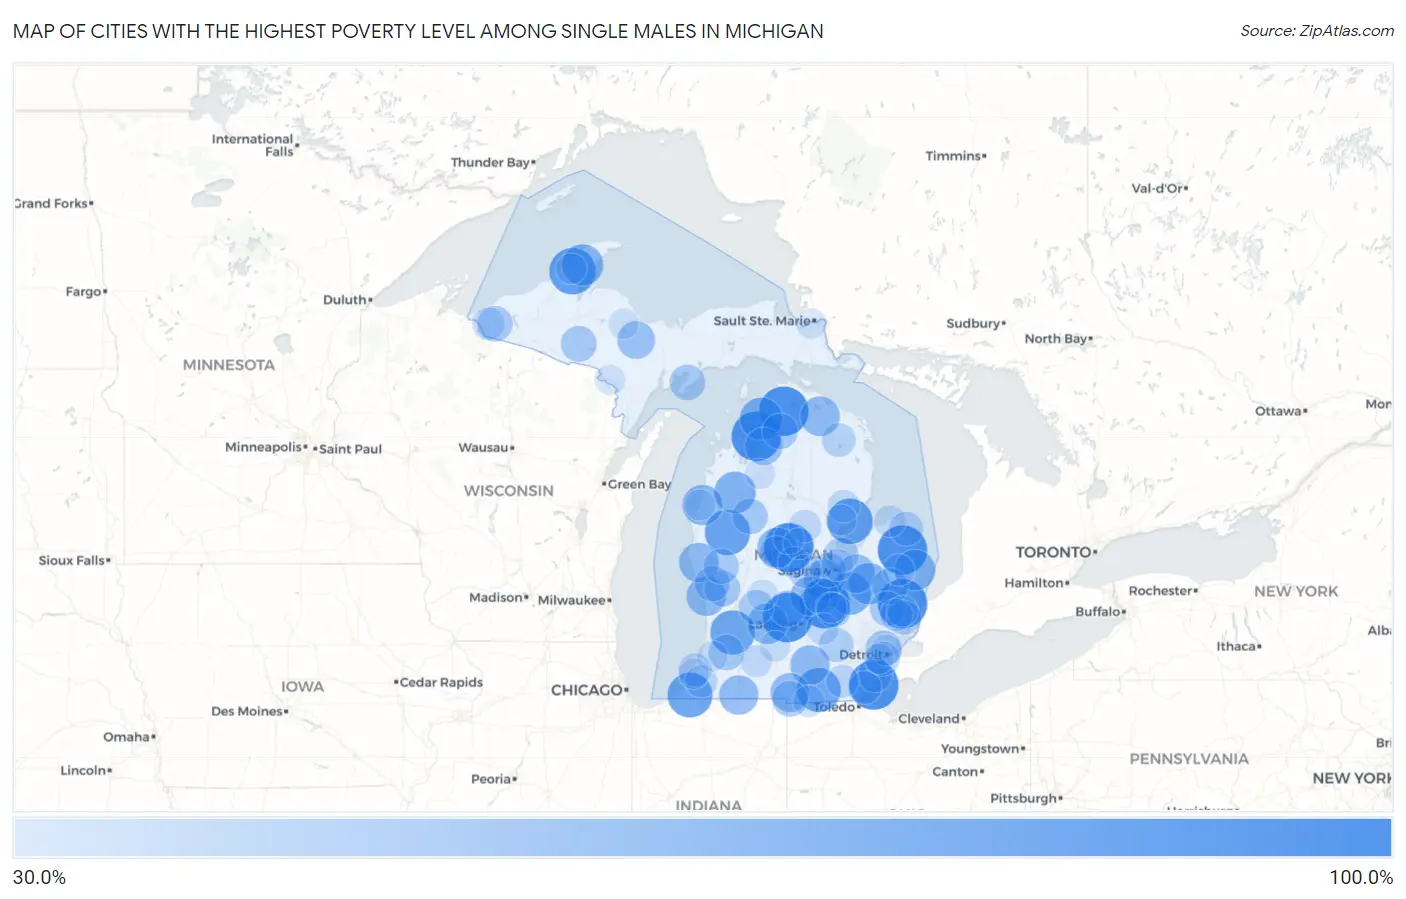
Map of Cities with the Highest Poverty Level Among Single Males in Michigan
0.0%
100.0%
Cities with the Highest Poverty Level Among Single Males in Michigan
| City | Single Male Poverty | vs State | vs National | |
| 1. | Stony Point | 100.0% | 13.1%(+86.9)#1 | 12.4%(+87.6)#108 |
| 2. | Middletown | 100.0% | 13.1%(+86.9)#2 | 12.4%(+87.6)#324 |
| 3. | Rosebush | 100.0% | 13.1%(+86.9)#3 | 12.4%(+87.6)#465 |
| 4. | Eastport | 100.0% | 13.1%(+86.9)#4 | 12.4%(+87.6)#500 |
| 5. | Emmett | 100.0% | 13.1%(+86.9)#5 | 12.4%(+87.6)#603 |
| 6. | Minden City | 100.0% | 13.1%(+86.9)#6 | 12.4%(+87.6)#655 |
| 7. | Conway | 100.0% | 13.1%(+86.9)#7 | 12.4%(+87.6)#731 |
| 8. | Eagle | 100.0% | 13.1%(+86.9)#8 | 12.4%(+87.6)#789 |
| 9. | Houghton | 88.5% | 13.1%(+75.4)#9 | 12.4%(+76.0)#961 |
| 10. | Au Gres | 85.7% | 13.1%(+72.6)#10 | 12.4%(+73.3)#997 |
| 11. | Baldwin | 84.6% | 13.1%(+71.5)#11 | 12.4%(+72.2)#1,022 |
| 12. | Pittsford | 84.6% | 13.1%(+71.5)#12 | 12.4%(+72.2)#1,023 |
| 13. | Galien | 83.3% | 13.1%(+70.2)#13 | 12.4%(+70.9)#1,041 |
| 14. | Winn | 82.4% | 13.1%(+69.3)#14 | 12.4%(+69.9)#1,053 |
| 15. | Hopkins | 81.8% | 13.1%(+68.7)#15 | 12.4%(+69.4)#1,064 |
| 16. | Clayton | 80.0% | 13.1%(+66.9)#16 | 12.4%(+67.6)#1,106 |
| 17. | Charlevoix | 75.0% | 13.1%(+61.9)#17 | 12.4%(+62.6)#1,188 |
| 18. | Mount Morris | 72.8% | 13.1%(+59.7)#18 | 12.4%(+60.4)#1,255 |
| 19. | Mesick | 71.4% | 13.1%(+58.3)#19 | 12.4%(+59.0)#1,297 |
| 20. | Lake Linden | 71.0% | 13.1%(+57.9)#20 | 12.4%(+58.5)#1,314 |
| 21. | Fostoria | 70.0% | 13.1%(+56.9)#21 | 12.4%(+57.6)#1,341 |
| 22. | Port Sanilac | 68.4% | 13.1%(+55.3)#22 | 12.4%(+56.0)#1,384 |
| 23. | St Charles | 66.7% | 13.1%(+53.6)#23 | 12.4%(+54.2)#1,422 |
| 24. | Woodland | 66.7% | 13.1%(+53.6)#24 | 12.4%(+54.2)#1,452 |
| 25. | Eastlake | 66.7% | 13.1%(+53.6)#25 | 12.4%(+54.2)#1,470 |
| 26. | Weidman | 65.5% | 13.1%(+52.4)#26 | 12.4%(+53.0)#1,503 |
| 27. | Onaway | 64.1% | 13.1%(+51.0)#27 | 12.4%(+51.7)#1,555 |
| 28. | Ferrysburg | 63.7% | 13.1%(+50.6)#28 | 12.4%(+51.3)#1,560 |
| 29. | Rothbury | 63.6% | 13.1%(+50.5)#29 | 12.4%(+51.2)#1,571 |
| 30. | Vandercook Lake | 63.0% | 13.1%(+49.9)#30 | 12.4%(+50.6)#1,593 |
| 31. | White Pigeon | 62.8% | 13.1%(+49.7)#31 | 12.4%(+50.4)#1,602 |
| 32. | Elsie | 62.5% | 13.1%(+49.4)#32 | 12.4%(+50.1)#1,616 |
| 33. | Reading | 61.5% | 13.1%(+48.4)#33 | 12.4%(+49.1)#1,651 |
| 34. | Vassar | 60.3% | 13.1%(+47.2)#34 | 12.4%(+47.9)#1,700 |
| 35. | Hermansville | 58.3% | 13.1%(+45.2)#35 | 12.4%(+45.9)#1,813 |
| 36. | Gwinn | 57.1% | 13.1%(+44.0)#36 | 12.4%(+44.7)#1,846 |
| 37. | Atlantic Mine | 57.1% | 13.1%(+44.0)#37 | 12.4%(+44.7)#1,858 |
| 38. | Naubinway | 57.1% | 13.1%(+44.0)#38 | 12.4%(+44.7)#1,874 |
| 39. | Bellaire | 56.2% | 13.1%(+43.1)#39 | 12.4%(+43.8)#1,903 |
| 40. | Brown City | 52.3% | 13.1%(+39.2)#40 | 12.4%(+39.8)#2,125 |
| 41. | Highland Park | 51.8% | 13.1%(+38.7)#41 | 12.4%(+39.4)#2,142 |
| 42. | Westphalia | 51.7% | 13.1%(+38.6)#42 | 12.4%(+39.3)#2,148 |
| 43. | Ravenna | 50.0% | 13.1%(+36.9)#43 | 12.4%(+37.6)#2,216 |
| 44. | Camden | 50.0% | 13.1%(+36.9)#44 | 12.4%(+37.6)#2,260 |
| 45. | Gobles | 50.0% | 13.1%(+36.9)#45 | 12.4%(+37.6)#2,264 |
| 46. | Boyne Falls | 50.0% | 13.1%(+36.9)#46 | 12.4%(+37.6)#2,317 |
| 47. | Henderson | 50.0% | 13.1%(+36.9)#47 | 12.4%(+37.6)#2,327 |
| 48. | Amasa | 50.0% | 13.1%(+36.9)#48 | 12.4%(+37.6)#2,340 |
| 49. | Tustin | 50.0% | 13.1%(+36.9)#49 | 12.4%(+37.6)#2,353 |
| 50. | Garden | 50.0% | 13.1%(+36.9)#50 | 12.4%(+37.6)#2,366 |
| 51. | Wolf Lake | 49.3% | 13.1%(+36.2)#51 | 12.4%(+36.9)#2,412 |
| 52. | Fremont | 49.0% | 13.1%(+35.9)#52 | 12.4%(+36.5)#2,423 |
| 53. | Wakefield | 48.7% | 13.1%(+35.6)#53 | 12.4%(+36.3)#2,432 |
| 54. | Almont | 47.8% | 13.1%(+34.7)#54 | 12.4%(+35.4)#2,472 |
| 55. | Lowell | 47.6% | 13.1%(+34.5)#55 | 12.4%(+35.2)#2,482 |
| 56. | Essexville | 46.8% | 13.1%(+33.7)#56 | 12.4%(+34.4)#2,527 |
| 57. | Shields | 46.5% | 13.1%(+33.4)#57 | 12.4%(+34.0)#2,549 |
| 58. | Pinckney | 46.2% | 13.1%(+33.1)#58 | 12.4%(+33.7)#2,577 |
| 59. | Durand | 46.0% | 13.1%(+32.9)#59 | 12.4%(+33.6)#2,595 |
| 60. | Richmond | 45.9% | 13.1%(+32.8)#60 | 12.4%(+33.4)#2,603 |
| 61. | South Rockwood | 45.8% | 13.1%(+32.7)#61 | 12.4%(+33.4)#2,605 |
| 62. | River Rouge | 44.8% | 13.1%(+31.7)#62 | 12.4%(+32.3)#2,666 |
| 63. | Port Hope | 44.4% | 13.1%(+31.3)#63 | 12.4%(+32.0)#2,700 |
| 64. | Hillman | 42.9% | 13.1%(+29.8)#64 | 12.4%(+30.4)#2,800 |
| 65. | Benton Heights | 41.6% | 13.1%(+28.5)#65 | 12.4%(+29.1)#2,916 |
| 66. | Breckenridge | 41.5% | 13.1%(+28.4)#66 | 12.4%(+29.0)#2,923 |
| 67. | Lake Isabella | 40.5% | 13.1%(+27.4)#67 | 12.4%(+28.1)#2,999 |
| 68. | South Monroe | 40.3% | 13.1%(+27.2)#68 | 12.4%(+27.8)#3,008 |
| 69. | Britton | 40.0% | 13.1%(+26.9)#69 | 12.4%(+27.6)#3,053 |
| 70. | Gladwin | 38.9% | 13.1%(+25.8)#70 | 12.4%(+26.5)#3,170 |
| 71. | Armada | 38.9% | 13.1%(+25.8)#71 | 12.4%(+26.5)#3,171 |
| 72. | Bessemer | 38.8% | 13.1%(+25.7)#72 | 12.4%(+26.3)#3,183 |
| 73. | Eau Claire | 38.5% | 13.1%(+25.4)#73 | 12.4%(+26.0)#3,211 |
| 74. | Riverdale | 38.5% | 13.1%(+25.4)#74 | 12.4%(+26.0)#3,215 |
| 75. | Whittemore | 38.1% | 13.1%(+25.0)#75 | 12.4%(+25.7)#3,235 |
| 76. | Zilwaukee | 37.7% | 13.1%(+24.6)#76 | 12.4%(+25.3)#3,255 |
| 77. | Webberville | 36.8% | 13.1%(+23.7)#77 | 12.4%(+24.4)#3,343 |
| 78. | Climax | 36.4% | 13.1%(+23.3)#78 | 12.4%(+23.9)#3,393 |
| 79. | Port Austin | 36.4% | 13.1%(+23.3)#79 | 12.4%(+23.9)#3,397 |
| 80. | Sandusky | 35.8% | 13.1%(+22.7)#80 | 12.4%(+23.4)#3,448 |
| 81. | Waldron | 35.3% | 13.1%(+22.2)#81 | 12.4%(+22.9)#3,507 |
| 82. | Shepherd | 35.0% | 13.1%(+21.9)#82 | 12.4%(+22.6)#3,538 |
| 83. | Clare | 33.3% | 13.1%(+20.2)#83 | 12.4%(+20.9)#3,667 |
| 84. | Memphis | 33.3% | 13.1%(+20.2)#84 | 12.4%(+20.9)#3,688 |
| 85. | Coleman | 33.3% | 13.1%(+20.2)#85 | 12.4%(+20.9)#3,696 |
| 86. | Vernon | 33.3% | 13.1%(+20.2)#86 | 12.4%(+20.9)#3,725 |
| 87. | Omer | 33.3% | 13.1%(+20.2)#87 | 12.4%(+20.9)#3,789 |
| 88. | Manistee | 32.9% | 13.1%(+19.8)#88 | 12.4%(+20.5)#3,851 |
| 89. | Kincheloe | 32.7% | 13.1%(+19.6)#89 | 12.4%(+20.3)#3,864 |
| 90. | Bangor | 32.5% | 13.1%(+19.4)#90 | 12.4%(+20.1)#3,888 |
| 91. | Bellevue | 32.4% | 13.1%(+19.3)#91 | 12.4%(+20.0)#3,899 |
| 92. | Hamtramck | 32.4% | 13.1%(+19.3)#92 | 12.4%(+20.0)#3,903 |
| 93. | Belding | 32.4% | 13.1%(+19.3)#93 | 12.4%(+20.0)#3,904 |
| 94. | Fair Plain | 32.3% | 13.1%(+19.2)#94 | 12.4%(+19.8)#3,913 |
| 95. | Hancock | 32.1% | 13.1%(+19.0)#95 | 12.4%(+19.7)#3,928 |
| 96. | Ishpeming | 31.5% | 13.1%(+18.3)#96 | 12.4%(+19.0)#4,002 |
| 97. | Melvindale | 31.2% | 13.1%(+18.1)#97 | 12.4%(+18.8)#4,019 |
| 98. | South Boardman | 31.2% | 13.1%(+18.1)#98 | 12.4%(+18.8)#4,038 |
| 99. | Sault Ste Marie | 30.9% | 13.1%(+17.8)#99 | 12.4%(+18.5)#4,056 |
| 100. | Norway | 30.6% | 13.1%(+17.5)#100 | 12.4%(+18.2)#4,096 |
Common Questions
What are the Top 10 Cities with the Highest Poverty Level Among Single Males in Michigan?
Top 10 Cities with the Highest Poverty Level Among Single Males in Michigan are:
#1
100.0%
#2
100.0%
#3
100.0%
#4
100.0%
#5
100.0%
#6
100.0%
#7
100.0%
#8
100.0%
#9
88.5%
#10
85.7%
What city has the Highest Poverty Level Among Single Males in Michigan?
Stony Point has the Highest Poverty Level Among Single Males in Michigan with 100.0%.
What is the Poverty Level Among Single Males in the State of Michigan?
Poverty Level Among Single Males in Michigan is 13.1%.
What is the Poverty Level Among Single Males in the United States?
Poverty Level Among Single Males in the United States is 12.4%.