Cities with the Highest Poverty Level Among Single Males in South Carolina
RELATED REPORTS & OPTIONS
Highest Poverty | Single Male
South Carolina
Compare Cities
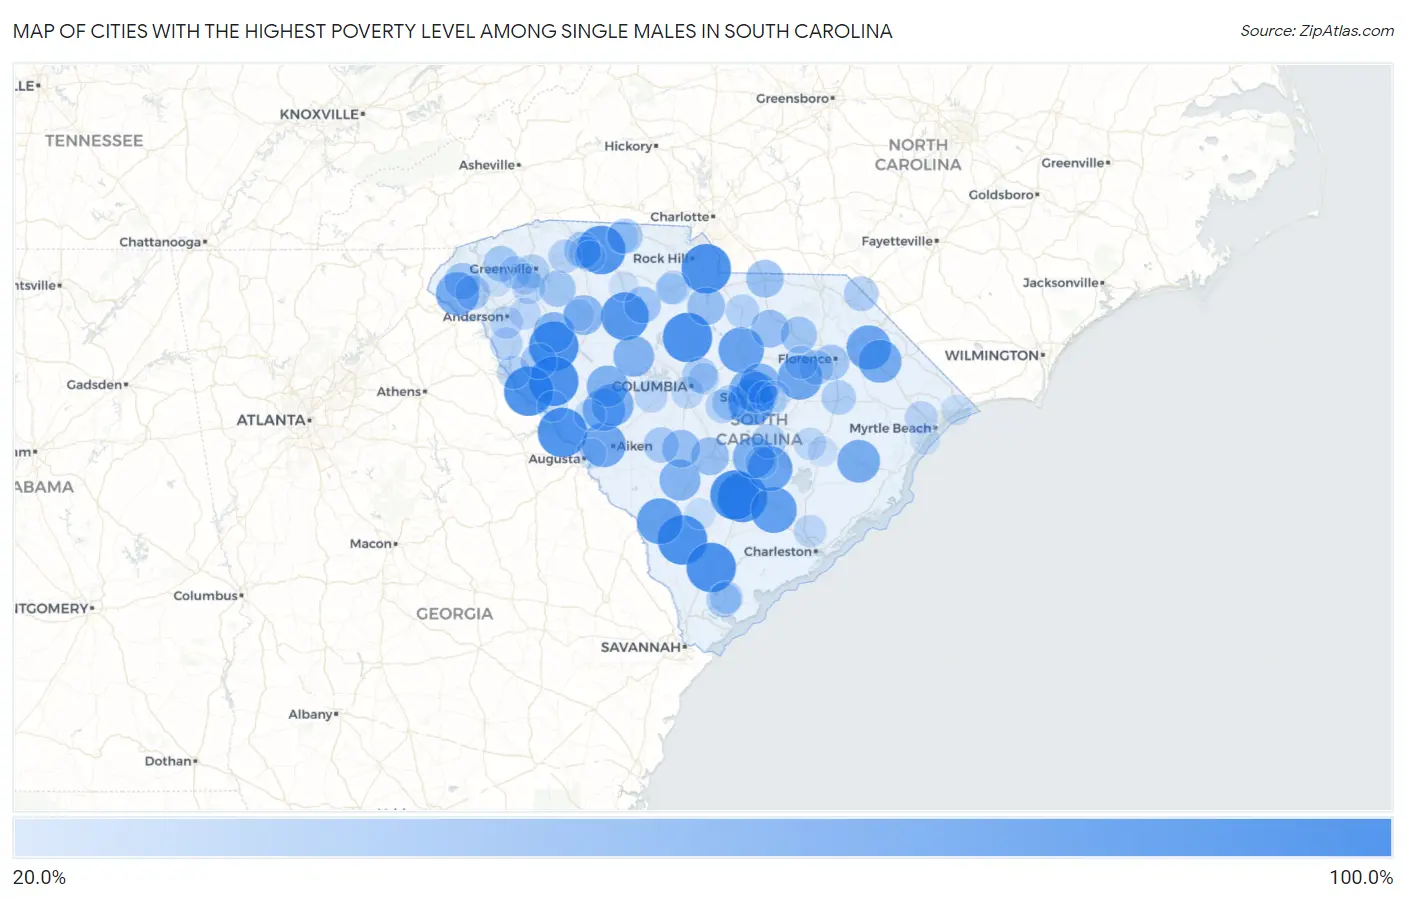
Map of Cities with the Highest Poverty Level Among Single Males in South Carolina
0.0%
100.0%
Cities with the Highest Poverty Level Among Single Males in South Carolina
| City | Single Male Poverty | vs State | vs National | |
| 1. | Hampton | 100.0% | 15.6%(+84.4)#1 | 12.4%(+87.6)#61 |
| 2. | St George | 100.0% | 15.6%(+84.4)#2 | 12.4%(+87.6)#107 |
| 3. | Winnsboro Mills | 100.0% | 15.6%(+84.4)#3 | 12.4%(+87.6)#127 |
| 4. | Catawba | 100.0% | 15.6%(+84.4)#4 | 12.4%(+87.6)#156 |
| 5. | Seabrook | 100.0% | 15.6%(+84.4)#5 | 12.4%(+87.6)#216 |
| 6. | Yemassee | 100.0% | 15.6%(+84.4)#6 | 12.4%(+87.6)#248 |
| 7. | Dovesville | 100.0% | 15.6%(+84.4)#7 | 12.4%(+87.6)#254 |
| 8. | Reevesville | 100.0% | 15.6%(+84.4)#8 | 12.4%(+87.6)#568 |
| 9. | Hodges | 100.0% | 15.6%(+84.4)#9 | 12.4%(+87.6)#692 |
| 10. | Bradley | 100.0% | 15.6%(+84.4)#10 | 12.4%(+87.6)#712 |
| 11. | Willington | 100.0% | 15.6%(+84.4)#11 | 12.4%(+87.6)#825 |
| 12. | Clarks Hill | 100.0% | 15.6%(+84.4)#12 | 12.4%(+87.6)#832 |
| 13. | Clifton | 96.1% | 15.6%(+80.5)#13 | 12.4%(+83.7)#914 |
| 14. | Whitmire | 93.2% | 15.6%(+77.6)#14 | 12.4%(+80.7)#926 |
| 15. | Ridgeville | 85.7% | 15.6%(+70.1)#15 | 12.4%(+73.3)#995 |
| 16. | Allendale | 85.5% | 15.6%(+69.9)#16 | 12.4%(+73.1)#1,008 |
| 17. | Wedgefield | 84.8% | 15.6%(+69.2)#17 | 12.4%(+72.4)#1,017 |
| 18. | Camden | 84.2% | 15.6%(+68.5)#18 | 12.4%(+71.7)#1,029 |
| 19. | Eutawville | 81.8% | 15.6%(+66.2)#19 | 12.4%(+69.4)#1,066 |
| 20. | Lynchburg | 80.0% | 15.6%(+64.4)#20 | 12.4%(+67.6)#1,101 |
| 21. | Sellers | 80.0% | 15.6%(+64.4)#21 | 12.4%(+67.6)#1,111 |
| 22. | Graniteville | 79.2% | 15.6%(+63.5)#22 | 12.4%(+66.7)#1,117 |
| 23. | Westminster | 75.6% | 15.6%(+60.0)#23 | 12.4%(+63.2)#1,179 |
| 24. | Marion | 74.6% | 15.6%(+59.0)#24 | 12.4%(+62.2)#1,229 |
| 25. | Andrews | 73.6% | 15.6%(+58.0)#25 | 12.4%(+61.2)#1,241 |
| 26. | Johnston | 71.7% | 15.6%(+56.1)#26 | 12.4%(+59.3)#1,275 |
| 27. | Ward | 71.4% | 15.6%(+55.8)#27 | 12.4%(+59.0)#1,305 |
| 28. | Santee | 70.0% | 15.6%(+54.4)#28 | 12.4%(+57.6)#1,338 |
| 29. | Saluda | 68.2% | 15.6%(+52.6)#29 | 12.4%(+55.8)#1,391 |
| 30. | Stateburg | 68.2% | 15.6%(+52.6)#30 | 12.4%(+55.7)#1,393 |
| 31. | Denmark | 66.7% | 15.6%(+51.0)#31 | 12.4%(+54.2)#1,415 |
| 32. | Cherryvale | 66.7% | 15.6%(+51.0)#32 | 12.4%(+54.2)#1,416 |
| 33. | Prosperity | 65.7% | 15.6%(+50.1)#33 | 12.4%(+53.3)#1,497 |
| 34. | Ware Shoals | 65.3% | 15.6%(+49.7)#34 | 12.4%(+52.9)#1,508 |
| 35. | Dalzell | 64.7% | 15.6%(+49.1)#35 | 12.4%(+52.3)#1,526 |
| 36. | Watts Mills | 61.7% | 15.6%(+46.0)#36 | 12.4%(+49.2)#1,647 |
| 37. | Orangeburg | 54.8% | 15.6%(+39.2)#37 | 12.4%(+42.4)#1,972 |
| 38. | Great Falls | 54.5% | 15.6%(+38.9)#38 | 12.4%(+42.1)#1,981 |
| 39. | Bethune | 54.5% | 15.6%(+38.9)#39 | 12.4%(+42.1)#1,991 |
| 40. | Neeses | 54.5% | 15.6%(+38.9)#40 | 12.4%(+42.1)#1,992 |
| 41. | Pageland | 53.2% | 15.6%(+37.6)#41 | 12.4%(+40.8)#2,063 |
| 42. | Arkwright | 52.1% | 15.6%(+36.5)#42 | 12.4%(+39.7)#2,129 |
| 43. | Carlisle | 50.0% | 15.6%(+34.4)#43 | 12.4%(+37.6)#2,277 |
| 44. | West Union | 50.0% | 15.6%(+34.4)#44 | 12.4%(+37.6)#2,295 |
| 45. | Hartsville | 49.5% | 15.6%(+33.8)#45 | 12.4%(+37.0)#2,403 |
| 46. | Southern Shops | 48.4% | 15.6%(+32.8)#46 | 12.4%(+36.0)#2,447 |
| 47. | Fountain Inn | 48.4% | 15.6%(+32.7)#47 | 12.4%(+35.9)#2,450 |
| 48. | Abbeville | 46.9% | 15.6%(+31.3)#48 | 12.4%(+34.5)#2,524 |
| 49. | Florence | 46.3% | 15.6%(+30.7)#49 | 12.4%(+33.9)#2,563 |
| 50. | Pickens | 45.9% | 15.6%(+30.3)#50 | 12.4%(+33.5)#2,599 |
| 51. | Salley | 45.5% | 15.6%(+29.8)#51 | 12.4%(+33.0)#2,629 |
| 52. | East Gaffney | 44.1% | 15.6%(+28.5)#52 | 12.4%(+31.7)#2,712 |
| 53. | Dentsville | 43.7% | 15.6%(+28.0)#53 | 12.4%(+31.2)#2,751 |
| 54. | Seneca | 42.9% | 15.6%(+27.2)#54 | 12.4%(+30.4)#2,783 |
| 55. | Eastover | 42.9% | 15.6%(+27.2)#55 | 12.4%(+30.4)#2,802 |
| 56. | Mccoll | 42.5% | 15.6%(+26.9)#56 | 12.4%(+30.1)#2,835 |
| 57. | Burton | 42.1% | 15.6%(+26.4)#57 | 12.4%(+29.6)#2,869 |
| 58. | Timmonsville | 41.9% | 15.6%(+26.3)#58 | 12.4%(+29.5)#2,875 |
| 59. | Summerton | 41.7% | 15.6%(+26.0)#59 | 12.4%(+29.2)#2,901 |
| 60. | Scranton | 41.2% | 15.6%(+25.6)#60 | 12.4%(+28.7)#2,944 |
| 61. | Eureka Mill | 39.3% | 15.6%(+23.7)#61 | 12.4%(+26.9)#3,145 |
| 62. | Gadsden | 39.2% | 15.6%(+23.6)#62 | 12.4%(+26.7)#3,156 |
| 63. | Kershaw | 38.8% | 15.6%(+23.2)#63 | 12.4%(+26.4)#3,182 |
| 64. | Judson | 38.2% | 15.6%(+22.6)#64 | 12.4%(+25.8)#3,225 |
| 65. | Duncan | 37.4% | 15.6%(+21.8)#65 | 12.4%(+25.0)#3,310 |
| 66. | Calhoun Falls | 37.1% | 15.6%(+21.5)#66 | 12.4%(+24.7)#3,328 |
| 67. | Lamar | 37.0% | 15.6%(+21.4)#67 | 12.4%(+24.6)#3,333 |
| 68. | Piedmont | 36.4% | 15.6%(+20.8)#68 | 12.4%(+24.0)#3,371 |
| 69. | Iva | 35.9% | 15.6%(+20.3)#69 | 12.4%(+23.5)#3,441 |
| 70. | Beaufort | 35.8% | 15.6%(+20.2)#70 | 12.4%(+23.4)#3,449 |
| 71. | Homeland Park | 35.6% | 15.6%(+20.0)#71 | 12.4%(+23.2)#3,471 |
| 72. | Saxon | 35.4% | 15.6%(+19.8)#72 | 12.4%(+23.0)#3,493 |
| 73. | Easley | 35.2% | 15.6%(+19.6)#73 | 12.4%(+22.7)#3,516 |
| 74. | Gilbert | 35.0% | 15.6%(+19.4)#74 | 12.4%(+22.6)#3,545 |
| 75. | Red Hill | 35.0% | 15.6%(+19.4)#75 | 12.4%(+22.5)#3,546 |
| 76. | Hanahan | 34.3% | 15.6%(+18.7)#76 | 12.4%(+21.9)#3,602 |
| 77. | Greeleyville | 33.3% | 15.6%(+17.7)#77 | 12.4%(+20.9)#3,751 |
| 78. | Vance | 33.3% | 15.6%(+17.7)#78 | 12.4%(+20.9)#3,823 |
| 79. | Cayce | 33.2% | 15.6%(+17.5)#79 | 12.4%(+20.7)#3,836 |
| 80. | Gaffney | 32.9% | 15.6%(+17.3)#80 | 12.4%(+20.5)#3,847 |
| 81. | Belton | 31.9% | 15.6%(+16.3)#81 | 12.4%(+19.5)#3,950 |
| 82. | Laurens | 31.5% | 15.6%(+15.8)#82 | 12.4%(+19.0)#3,999 |
| 83. | Edgefield | 31.4% | 15.6%(+15.8)#83 | 12.4%(+19.0)#4,007 |
| 84. | Powdersville | 31.4% | 15.6%(+15.8)#84 | 12.4%(+19.0)#4,010 |
| 85. | Woodfield | 30.8% | 15.6%(+15.1)#85 | 12.4%(+18.3)#4,065 |
| 86. | Chester | 29.6% | 15.6%(+14.0)#86 | 12.4%(+17.1)#4,228 |
| 87. | Spartanburg | 29.6% | 15.6%(+13.9)#87 | 12.4%(+17.1)#4,233 |
| 88. | Camp Croft | 29.0% | 15.6%(+13.4)#88 | 12.4%(+16.6)#4,284 |
| 89. | East Sumter | 28.6% | 15.6%(+12.9)#89 | 12.4%(+16.1)#4,342 |
| 90. | Norris | 28.6% | 15.6%(+12.9)#90 | 12.4%(+16.1)#4,344 |
| 91. | Lodge | 28.6% | 15.6%(+12.9)#91 | 12.4%(+16.1)#4,372 |
| 92. | Plum Branch | 28.6% | 15.6%(+12.9)#92 | 12.4%(+16.1)#4,377 |
| 93. | South Sumter | 27.8% | 15.6%(+12.2)#93 | 12.4%(+15.3)#4,471 |
| 94. | Clearwater | 27.5% | 15.6%(+11.8)#94 | 12.4%(+15.0)#4,519 |
| 95. | Olympia | 27.3% | 15.6%(+11.6)#95 | 12.4%(+14.8)#4,540 |
| 96. | North Myrtle Beach | 25.8% | 15.6%(+10.1)#96 | 12.4%(+13.3)#4,754 |
| 97. | Sumter | 25.4% | 15.6%(+9.75)#97 | 12.4%(+12.9)#4,792 |
| 98. | Union | 25.0% | 15.6%(+9.37)#98 | 12.4%(+12.6)#4,821 |
| 99. | Surfside Beach | 25.0% | 15.6%(+9.37)#99 | 12.4%(+12.6)#4,826 |
| 100. | Lane | 25.0% | 15.6%(+9.37)#100 | 12.4%(+12.6)#4,902 |
Common Questions
What are the Top 10 Cities with the Highest Poverty Level Among Single Males in South Carolina?
Top 10 Cities with the Highest Poverty Level Among Single Males in South Carolina are:
#1
100.0%
#2
100.0%
#3
100.0%
#4
100.0%
#5
100.0%
#6
100.0%
#7
100.0%
#8
100.0%
#9
100.0%
#10
100.0%
What city has the Highest Poverty Level Among Single Males in South Carolina?
Hampton has the Highest Poverty Level Among Single Males in South Carolina with 100.0%.
What is the Poverty Level Among Single Males in the State of South Carolina?
Poverty Level Among Single Males in South Carolina is 15.6%.
What is the Poverty Level Among Single Males in the United States?
Poverty Level Among Single Males in the United States is 12.4%.