Cities with the Highest Poverty Level Among Single Males in Mississippi
RELATED REPORTS & OPTIONS
Highest Poverty | Single Male
Mississippi
Compare Cities
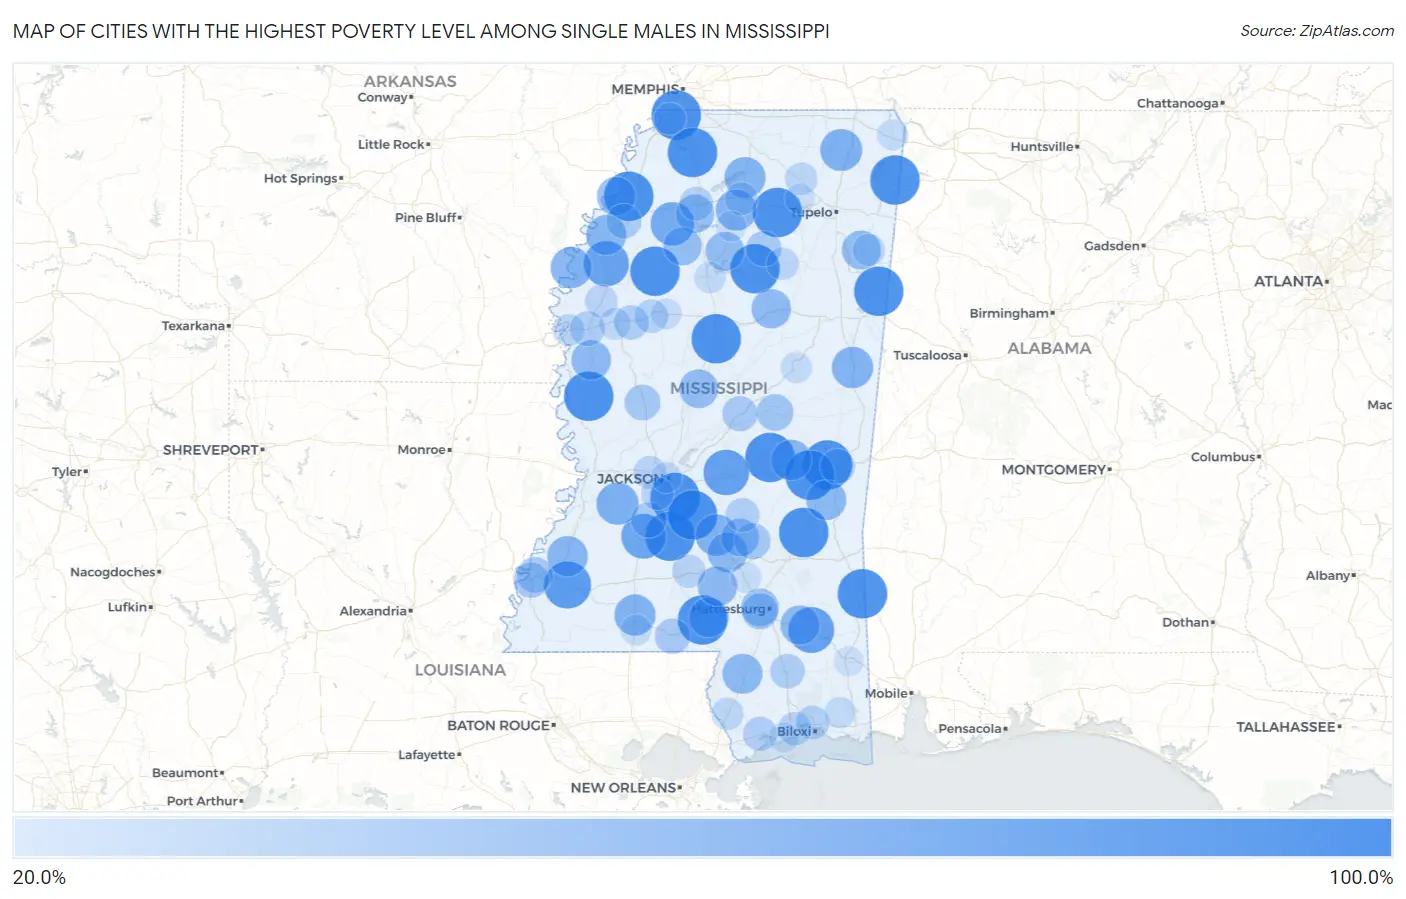
Map of Cities with the Highest Poverty Level Among Single Males in Mississippi
0.0%
100.0%
Cities with the Highest Poverty Level Among Single Males in Mississippi
| City | Single Male Poverty | vs State | vs National | |
| 1. | Florence | 100.0% | 19.7%(+80.3)#1 | 12.4%(+87.6)#16 |
| 2. | Rolling Fork | 100.0% | 19.7%(+80.3)#2 | 12.4%(+87.6)#93 |
| 3. | Lynchburg | 100.0% | 19.7%(+80.3)#3 | 12.4%(+87.6)#103 |
| 4. | Nellieburg | 100.0% | 19.7%(+80.3)#4 | 12.4%(+87.6)#171 |
| 5. | Conehatta | 100.0% | 19.7%(+80.3)#5 | 12.4%(+87.6)#185 |
| 6. | Coldwater | 100.0% | 19.7%(+80.3)#6 | 12.4%(+87.6)#186 |
| 7. | Caledonia | 100.0% | 19.7%(+80.3)#7 | 12.4%(+87.6)#196 |
| 8. | Vaiden | 100.0% | 19.7%(+80.3)#8 | 12.4%(+87.6)#208 |
| 9. | State Line | 100.0% | 19.7%(+80.3)#9 | 12.4%(+87.6)#283 |
| 10. | Heidelberg | 100.0% | 19.7%(+80.3)#10 | 12.4%(+87.6)#311 |
| 11. | Foxworth | 100.0% | 19.7%(+80.3)#11 | 12.4%(+87.6)#364 |
| 12. | Paris | 100.0% | 19.7%(+80.3)#12 | 12.4%(+87.6)#483 |
| 13. | Chunky | 100.0% | 19.7%(+80.3)#13 | 12.4%(+87.6)#574 |
| 14. | Toccopola | 100.0% | 19.7%(+80.3)#14 | 12.4%(+87.6)#580 |
| 15. | Georgetown | 100.0% | 19.7%(+80.3)#15 | 12.4%(+87.6)#589 |
| 16. | Bond | 100.0% | 19.7%(+80.3)#16 | 12.4%(+87.6)#612 |
| 17. | Glen Allan | 100.0% | 19.7%(+80.3)#17 | 12.4%(+87.6)#615 |
| 18. | Braxton | 100.0% | 19.7%(+80.3)#18 | 12.4%(+87.6)#632 |
| 19. | Golden | 100.0% | 19.7%(+80.3)#19 | 12.4%(+87.6)#640 |
| 20. | Coahoma | 100.0% | 19.7%(+80.3)#20 | 12.4%(+87.6)#669 |
| 21. | Big Creek | 100.0% | 19.7%(+80.3)#21 | 12.4%(+87.6)#738 |
| 22. | Glendora | 100.0% | 19.7%(+80.3)#22 | 12.4%(+87.6)#744 |
| 23. | Roxie | 90.9% | 19.7%(+71.2)#23 | 12.4%(+78.5)#939 |
| 24. | Beaumont | 85.7% | 19.7%(+66.0)#24 | 12.4%(+73.3)#998 |
| 25. | Morton | 84.9% | 19.7%(+65.2)#25 | 12.4%(+72.4)#1,015 |
| 26. | Mound Bayou | 83.3% | 19.7%(+63.7)#26 | 12.4%(+70.9)#1,034 |
| 27. | Hazlehurst | 81.2% | 19.7%(+61.6)#27 | 12.4%(+68.8)#1,071 |
| 28. | Crowder | 76.5% | 19.7%(+56.8)#28 | 12.4%(+64.0)#1,167 |
| 29. | Utica | 70.8% | 19.7%(+51.2)#29 | 12.4%(+58.4)#1,319 |
| 30. | Jumpertown | 70.0% | 19.7%(+50.3)#30 | 12.4%(+57.6)#1,348 |
| 31. | Magee | 68.8% | 19.7%(+49.1)#31 | 12.4%(+56.3)#1,372 |
| 32. | Macon | 68.0% | 19.7%(+48.3)#32 | 12.4%(+55.6)#1,395 |
| 33. | Rosedale | 67.5% | 19.7%(+47.8)#33 | 12.4%(+55.0)#1,406 |
| 34. | Summit | 67.2% | 19.7%(+47.6)#34 | 12.4%(+54.8)#1,411 |
| 35. | Abbeville | 66.7% | 19.7%(+47.0)#35 | 12.4%(+54.2)#1,459 |
| 36. | Taylor | 66.7% | 19.7%(+47.0)#36 | 12.4%(+54.2)#1,474 |
| 37. | Decatur | 64.9% | 19.7%(+45.2)#37 | 12.4%(+52.4)#1,524 |
| 38. | Fayette | 64.7% | 19.7%(+45.0)#38 | 12.4%(+52.3)#1,528 |
| 39. | Alligator | 63.2% | 19.7%(+43.5)#39 | 12.4%(+50.7)#1,591 |
| 40. | Stonewall | 63.0% | 19.7%(+43.3)#40 | 12.4%(+50.5)#1,598 |
| 41. | Poplarville | 62.5% | 19.7%(+42.8)#41 | 12.4%(+50.1)#1,608 |
| 42. | Mount Olive | 62.5% | 19.7%(+42.8)#42 | 12.4%(+50.1)#1,613 |
| 43. | Columbia | 61.4% | 19.7%(+41.7)#43 | 12.4%(+48.9)#1,659 |
| 44. | Bassfield | 61.1% | 19.7%(+41.4)#44 | 12.4%(+48.7)#1,676 |
| 45. | Hollandale | 60.9% | 19.7%(+41.2)#45 | 12.4%(+48.5)#1,679 |
| 46. | Eupora | 60.0% | 19.7%(+40.3)#46 | 12.4%(+47.6)#1,710 |
| 47. | New Augusta | 60.0% | 19.7%(+40.3)#47 | 12.4%(+47.6)#1,740 |
| 48. | Amory | 58.3% | 19.7%(+38.7)#48 | 12.4%(+45.9)#1,804 |
| 49. | Coffeeville | 58.3% | 19.7%(+38.7)#49 | 12.4%(+45.9)#1,812 |
| 50. | Goodman | 58.1% | 19.7%(+38.4)#50 | 12.4%(+45.6)#1,823 |
| 51. | Friars Point | 57.9% | 19.7%(+38.2)#51 | 12.4%(+45.5)#1,827 |
| 52. | Courtland | 56.5% | 19.7%(+36.8)#52 | 12.4%(+44.1)#1,889 |
| 53. | Charleston | 55.9% | 19.7%(+36.2)#53 | 12.4%(+43.4)#1,917 |
| 54. | Mize | 54.5% | 19.7%(+34.9)#54 | 12.4%(+42.1)#1,994 |
| 55. | Arnold Line | 53.8% | 19.7%(+34.2)#55 | 12.4%(+41.4)#2,020 |
| 56. | Pearl River | 50.0% | 19.7%(+30.3)#56 | 12.4%(+37.6)#2,190 |
| 57. | West Hattiesburg | 48.0% | 19.7%(+28.3)#57 | 12.4%(+35.6)#2,464 |
| 58. | Taylorsville | 47.6% | 19.7%(+27.9)#58 | 12.4%(+35.2)#2,485 |
| 59. | Morgantown | 46.3% | 19.7%(+26.7)#59 | 12.4%(+33.9)#2,562 |
| 60. | Yazoo City | 46.3% | 19.7%(+26.6)#60 | 12.4%(+33.9)#2,566 |
| 61. | Tylertown | 45.2% | 19.7%(+25.5)#61 | 12.4%(+32.7)#2,643 |
| 62. | Bruce | 45.0% | 19.7%(+25.3)#62 | 12.4%(+32.6)#2,653 |
| 63. | Crystal Springs | 44.9% | 19.7%(+25.3)#63 | 12.4%(+32.5)#2,659 |
| 64. | Natchez | 44.9% | 19.7%(+25.2)#64 | 12.4%(+32.5)#2,660 |
| 65. | Redwater | 44.4% | 19.7%(+24.8)#65 | 12.4%(+32.0)#2,693 |
| 66. | Clarksdale | 43.2% | 19.7%(+23.5)#66 | 12.4%(+30.8)#2,772 |
| 67. | Leland | 42.8% | 19.7%(+23.1)#67 | 12.4%(+30.3)#2,829 |
| 68. | Meridian | 42.3% | 19.7%(+22.6)#68 | 12.4%(+29.9)#2,844 |
| 69. | Wiggins | 41.5% | 19.7%(+21.8)#69 | 12.4%(+29.1)#2,920 |
| 70. | Moorhead | 41.2% | 19.7%(+21.5)#70 | 12.4%(+28.7)#2,938 |
| 71. | Diamondhead | 40.0% | 19.7%(+20.3)#71 | 12.4%(+27.6)#3,013 |
| 72. | Raleigh | 40.0% | 19.7%(+20.3)#72 | 12.4%(+27.6)#3,033 |
| 73. | Batesville | 39.3% | 19.7%(+19.6)#73 | 12.4%(+26.9)#3,142 |
| 74. | D Iberville | 38.7% | 19.7%(+19.0)#74 | 12.4%(+26.3)#3,185 |
| 75. | Itta Bena | 38.5% | 19.7%(+18.8)#75 | 12.4%(+26.0)#3,204 |
| 76. | Gulfport | 37.0% | 19.7%(+17.4)#76 | 12.4%(+24.6)#3,330 |
| 77. | Silver Creek | 36.4% | 19.7%(+16.7)#77 | 12.4%(+23.9)#3,411 |
| 78. | Clinton | 36.0% | 19.7%(+16.4)#78 | 12.4%(+23.6)#3,424 |
| 79. | Oxford | 35.2% | 19.7%(+15.5)#79 | 12.4%(+22.8)#3,513 |
| 80. | Byram | 34.9% | 19.7%(+15.2)#80 | 12.4%(+22.5)#3,549 |
| 81. | Shaw | 34.6% | 19.7%(+14.9)#81 | 12.4%(+22.1)#3,580 |
| 82. | New Albany | 34.3% | 19.7%(+14.6)#82 | 12.4%(+21.8)#3,603 |
| 83. | Vardaman | 33.3% | 19.7%(+13.7)#83 | 12.4%(+20.9)#3,698 |
| 84. | Hatley | 33.3% | 19.7%(+13.7)#84 | 12.4%(+20.9)#3,723 |
| 85. | Picayune | 32.9% | 19.7%(+13.2)#85 | 12.4%(+20.4)#3,856 |
| 86. | Greenville | 32.2% | 19.7%(+12.5)#86 | 12.4%(+19.8)#3,922 |
| 87. | Indianola | 31.6% | 19.7%(+12.0)#87 | 12.4%(+19.2)#3,975 |
| 88. | Walls | 31.6% | 19.7%(+11.9)#88 | 12.4%(+19.1)#3,983 |
| 89. | Grenada | 29.9% | 19.7%(+10.3)#89 | 12.4%(+17.5)#4,198 |
| 90. | Louisville | 29.3% | 19.7%(+9.67)#90 | 12.4%(+16.9)#4,256 |
| 91. | Vancleave | 28.9% | 19.7%(+9.27)#91 | 12.4%(+16.5)#4,297 |
| 92. | Jackson | 28.5% | 19.7%(+8.84)#92 | 12.4%(+16.1)#4,379 |
| 93. | Iuka | 28.4% | 19.7%(+8.68)#93 | 12.4%(+15.9)#4,388 |
| 94. | Magnolia | 28.2% | 19.7%(+8.53)#94 | 12.4%(+15.8)#4,410 |
| 95. | Greenwood | 27.7% | 19.7%(+8.03)#95 | 12.4%(+15.3)#4,488 |
| 96. | Seminary | 27.3% | 19.7%(+7.60)#96 | 12.4%(+14.8)#4,566 |
| 97. | Water Valley | 26.0% | 19.7%(+6.35)#97 | 12.4%(+13.6)#4,716 |
| 98. | Long Beach | 25.7% | 19.7%(+6.01)#98 | 12.4%(+13.2)#4,761 |
| 99. | Lucedale | 25.0% | 19.7%(+5.32)#99 | 12.4%(+12.6)#4,827 |
| 100. | Ecru | 25.0% | 19.7%(+5.32)#100 | 12.4%(+12.6)#4,862 |
Common Questions
What are the Top 10 Cities with the Highest Poverty Level Among Single Males in Mississippi?
Top 10 Cities with the Highest Poverty Level Among Single Males in Mississippi are:
#1
100.0%
#2
100.0%
#3
100.0%
#4
100.0%
#5
100.0%
#6
100.0%
#7
100.0%
#8
100.0%
#9
100.0%
#10
100.0%
What city has the Highest Poverty Level Among Single Males in Mississippi?
Florence has the Highest Poverty Level Among Single Males in Mississippi with 100.0%.
What is the Poverty Level Among Single Males in the State of Mississippi?
Poverty Level Among Single Males in Mississippi is 19.7%.
What is the Poverty Level Among Single Males in the United States?
Poverty Level Among Single Males in the United States is 12.4%.