Cities with the Highest Poverty Level Among Single Males in Indiana
RELATED REPORTS & OPTIONS
Highest Poverty | Single Male
Indiana
Compare Cities
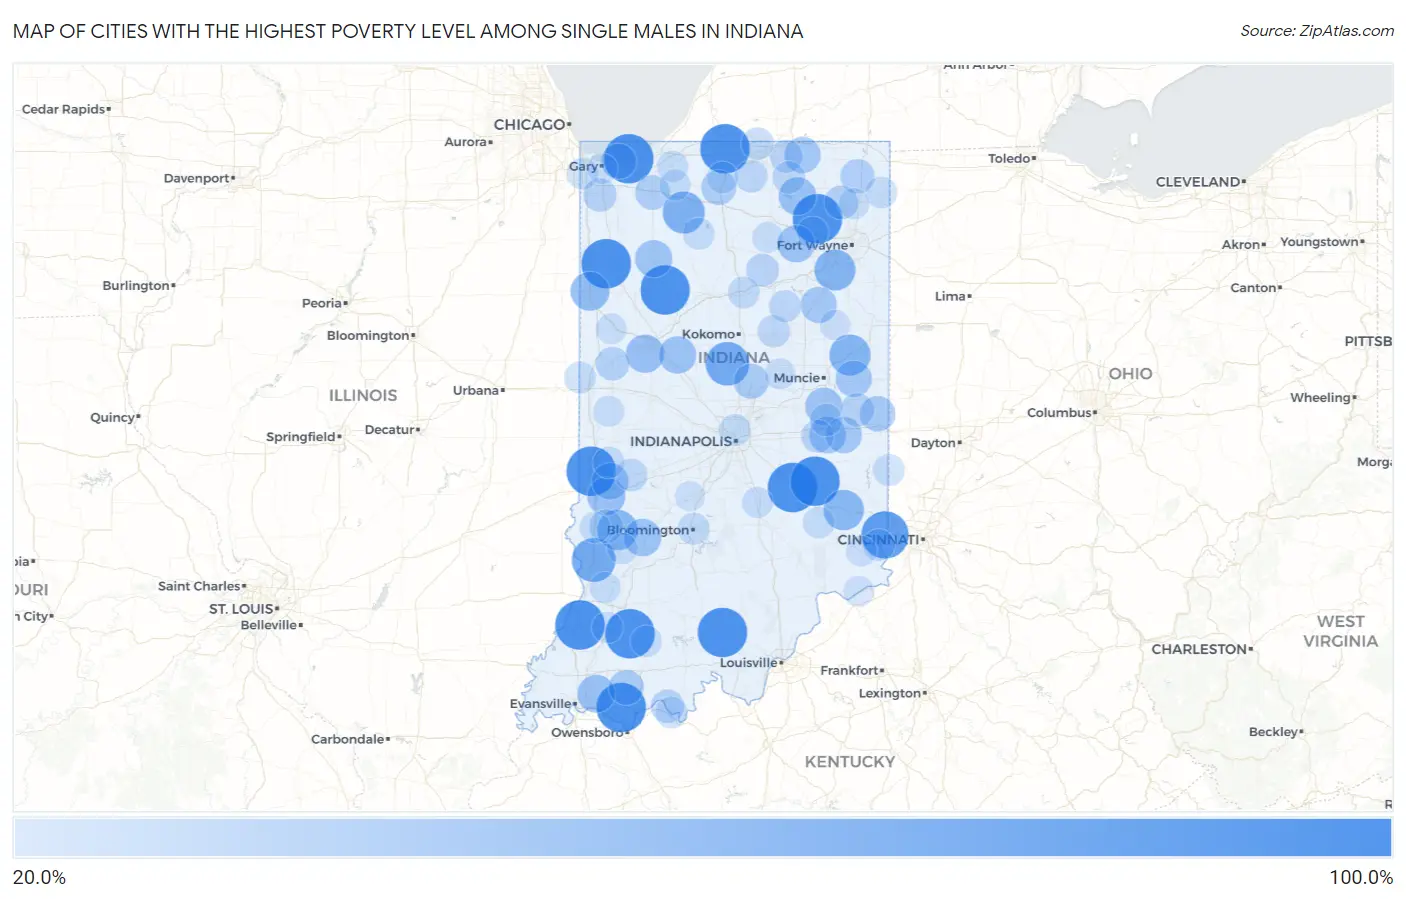
Map of Cities with the Highest Poverty Level Among Single Males in Indiana
0.0%
100.0%
Cities with the Highest Poverty Level Among Single Males in Indiana
| City | Single Male Poverty | vs State | vs National | |
| 1. | Tri Lakes | 100.0% | 13.2%(+86.8)#1 | 12.4%(+87.6)#181 |
| 2. | Waldron | 100.0% | 13.2%(+86.8)#2 | 12.4%(+87.6)#285 |
| 3. | Tecumseh | 100.0% | 13.2%(+86.8)#3 | 12.4%(+87.6)#291 |
| 4. | Roseland | 100.0% | 13.2%(+86.8)#4 | 12.4%(+87.6)#293 |
| 5. | Milroy | 100.0% | 13.2%(+86.8)#5 | 12.4%(+87.6)#344 |
| 6. | Richland | 100.0% | 13.2%(+86.8)#6 | 12.4%(+87.6)#390 |
| 7. | Otwell | 100.0% | 13.2%(+86.8)#7 | 12.4%(+87.6)#491 |
| 8. | Homer | 100.0% | 13.2%(+86.8)#8 | 12.4%(+87.6)#514 |
| 9. | Dune Acres | 100.0% | 13.2%(+86.8)#9 | 12.4%(+87.6)#548 |
| 10. | Norway | 100.0% | 13.2%(+86.8)#10 | 12.4%(+87.6)#575 |
| 11. | Prairie Creek | 100.0% | 13.2%(+86.8)#11 | 12.4%(+87.6)#588 |
| 12. | Burnett | 100.0% | 13.2%(+86.8)#12 | 12.4%(+87.6)#658 |
| 13. | Adams | 100.0% | 13.2%(+86.8)#13 | 12.4%(+87.6)#677 |
| 14. | Hardinsburg | 100.0% | 13.2%(+86.8)#14 | 12.4%(+87.6)#687 |
| 15. | Decker | 100.0% | 13.2%(+86.8)#15 | 12.4%(+87.6)#695 |
| 16. | Pence | 100.0% | 13.2%(+86.8)#16 | 12.4%(+87.6)#709 |
| 17. | Pittsburg | 100.0% | 13.2%(+86.8)#18 | 12.4%(+87.6)#720 |
| 18. | Webster | 100.0% | 13.2%(+86.8)#19 | 12.4%(+87.6)#722 |
| 19. | Mount Ayr | 100.0% | 13.2%(+86.8)#20 | 12.4%(+87.6)#815 |
| 20. | Pleasantville | 100.0% | 13.2%(+86.8)#21 | 12.4%(+87.6)#833 |
| 21. | Lake Cicott | 100.0% | 13.2%(+86.8)#22 | 12.4%(+87.6)#844 |
| 22. | Greendale | 91.7% | 13.2%(+78.5)#23 | 12.4%(+79.2)#933 |
| 23. | Carlisle | 78.3% | 13.2%(+65.1)#24 | 12.4%(+65.8)#1,133 |
| 24. | Kempton | 77.8% | 13.2%(+64.6)#25 | 12.4%(+65.3)#1,145 |
| 25. | Knox | 71.4% | 13.2%(+58.3)#26 | 12.4%(+59.0)#1,277 |
| 26. | Redkey | 68.0% | 13.2%(+54.8)#27 | 12.4%(+55.6)#1,396 |
| 27. | Zanesville | 67.7% | 13.2%(+54.6)#28 | 12.4%(+55.3)#1,400 |
| 28. | Batesville | 65.6% | 13.2%(+52.5)#29 | 12.4%(+53.2)#1,501 |
| 29. | Jasonville | 65.2% | 13.2%(+52.1)#30 | 12.4%(+52.8)#1,513 |
| 30. | Kentland | 60.0% | 13.2%(+46.8)#31 | 12.4%(+47.6)#1,713 |
| 31. | Shadeland | 57.1% | 13.2%(+44.0)#32 | 12.4%(+44.7)#1,844 |
| 32. | Riley | 56.5% | 13.2%(+43.4)#33 | 12.4%(+44.1)#1,892 |
| 33. | Chandler | 55.9% | 13.2%(+42.7)#34 | 12.4%(+43.4)#1,916 |
| 34. | Cromwell | 55.6% | 13.2%(+42.4)#35 | 12.4%(+43.1)#1,941 |
| 35. | Worthington | 54.8% | 13.2%(+41.7)#36 | 12.4%(+42.4)#1,970 |
| 36. | Mulberry | 54.2% | 13.2%(+41.0)#37 | 12.4%(+41.7)#2,009 |
| 37. | South Whitley | 54.2% | 13.2%(+41.0)#38 | 12.4%(+41.7)#2,010 |
| 38. | Francesville | 53.6% | 13.2%(+40.4)#39 | 12.4%(+41.1)#2,034 |
| 39. | Mount Summit | 53.3% | 13.2%(+40.2)#40 | 12.4%(+40.9)#2,057 |
| 40. | Lewisville | 52.2% | 13.2%(+39.0)#41 | 12.4%(+39.7)#2,128 |
| 41. | Seelyville | 51.7% | 13.2%(+38.6)#42 | 12.4%(+39.3)#2,149 |
| 42. | Farmland | 50.0% | 13.2%(+36.8)#43 | 12.4%(+37.6)#2,222 |
| 43. | Warren | 50.0% | 13.2%(+36.8)#44 | 12.4%(+37.6)#2,223 |
| 44. | Dublin | 50.0% | 13.2%(+36.8)#45 | 12.4%(+37.6)#2,237 |
| 45. | Shipshewana | 50.0% | 13.2%(+36.8)#46 | 12.4%(+37.6)#2,240 |
| 46. | Fountain City | 47.2% | 13.2%(+34.1)#47 | 12.4%(+34.8)#2,507 |
| 47. | Ogden Dunes | 46.7% | 13.2%(+33.5)#48 | 12.4%(+34.2)#2,538 |
| 48. | Arcadia | 45.5% | 13.2%(+32.3)#49 | 12.4%(+33.0)#2,618 |
| 49. | Tennyson | 45.5% | 13.2%(+32.3)#50 | 12.4%(+33.0)#2,632 |
| 50. | La Paz | 45.0% | 13.2%(+31.8)#51 | 12.4%(+32.6)#2,656 |
| 51. | Wanatah | 44.1% | 13.2%(+31.0)#52 | 12.4%(+31.7)#2,713 |
| 52. | Hudson | 42.9% | 13.2%(+29.7)#53 | 12.4%(+30.4)#2,804 |
| 53. | Avilla | 40.9% | 13.2%(+27.8)#54 | 12.4%(+28.5)#2,963 |
| 54. | Attica | 40.7% | 13.2%(+27.6)#55 | 12.4%(+28.3)#2,978 |
| 55. | Hymera | 40.0% | 13.2%(+26.8)#56 | 12.4%(+27.6)#3,036 |
| 56. | Economy | 40.0% | 13.2%(+26.8)#57 | 12.4%(+27.6)#3,104 |
| 57. | Crown Point | 39.5% | 13.2%(+26.4)#58 | 12.4%(+27.1)#3,128 |
| 58. | Tell City | 39.3% | 13.2%(+26.2)#59 | 12.4%(+26.9)#3,140 |
| 59. | Roann | 37.5% | 13.2%(+24.3)#60 | 12.4%(+25.1)#3,291 |
| 60. | Dunreith | 37.5% | 13.2%(+24.3)#61 | 12.4%(+25.1)#3,301 |
| 61. | Middlebury | 37.3% | 13.2%(+24.1)#62 | 12.4%(+24.8)#3,316 |
| 62. | Harmony | 36.8% | 13.2%(+23.7)#63 | 12.4%(+24.4)#3,348 |
| 63. | Wakarusa | 36.4% | 13.2%(+23.2)#64 | 12.4%(+23.9)#3,377 |
| 64. | Millersburg | 36.4% | 13.2%(+23.2)#65 | 12.4%(+23.9)#3,396 |
| 65. | New Castle | 35.9% | 13.2%(+22.7)#66 | 12.4%(+23.4)#3,444 |
| 66. | Swayzee | 35.7% | 13.2%(+22.6)#67 | 12.4%(+23.3)#3,461 |
| 67. | Simonton Lake | 35.6% | 13.2%(+22.5)#68 | 12.4%(+23.2)#3,472 |
| 68. | La Fontaine | 35.0% | 13.2%(+21.8)#69 | 12.4%(+22.6)#3,543 |
| 69. | Bloomington | 34.4% | 13.2%(+21.3)#70 | 12.4%(+22.0)#3,589 |
| 70. | Aurora | 34.2% | 13.2%(+21.1)#71 | 12.4%(+21.8)#3,606 |
| 71. | Peru | 33.5% | 13.2%(+20.3)#72 | 12.4%(+21.1)#3,649 |
| 72. | Cannelton | 33.3% | 13.2%(+20.2)#73 | 12.4%(+20.9)#3,684 |
| 73. | Lakeville | 33.3% | 13.2%(+20.2)#74 | 12.4%(+20.9)#3,716 |
| 74. | Rocky Ripple | 33.3% | 13.2%(+20.2)#75 | 12.4%(+20.9)#3,727 |
| 75. | Rosedale | 33.3% | 13.2%(+20.2)#76 | 12.4%(+20.9)#3,729 |
| 76. | West College Corner | 33.3% | 13.2%(+20.2)#77 | 12.4%(+20.9)#3,736 |
| 77. | Monterey | 33.3% | 13.2%(+20.2)#78 | 12.4%(+20.9)#3,767 |
| 78. | Millhousen | 33.3% | 13.2%(+20.2)#79 | 12.4%(+20.9)#3,784 |
| 79. | State Line City | 33.3% | 13.2%(+20.2)#80 | 12.4%(+20.9)#3,817 |
| 80. | Columbia City | 33.2% | 13.2%(+20.0)#81 | 12.4%(+20.8)#3,834 |
| 81. | Butler | 32.8% | 13.2%(+19.7)#82 | 12.4%(+20.4)#3,859 |
| 82. | Munster | 32.4% | 13.2%(+19.3)#83 | 12.4%(+20.0)#3,892 |
| 83. | Jasper | 32.1% | 13.2%(+18.9)#84 | 12.4%(+19.6)#3,936 |
| 84. | La Porte | 31.8% | 13.2%(+18.6)#85 | 12.4%(+19.3)#3,964 |
| 85. | Shelburn | 31.6% | 13.2%(+18.4)#86 | 12.4%(+19.1)#3,985 |
| 86. | Kingsford Heights | 31.4% | 13.2%(+18.3)#87 | 12.4%(+19.0)#4,008 |
| 87. | Bicknell | 31.4% | 13.2%(+18.2)#88 | 12.4%(+18.9)#4,013 |
| 88. | Edinburgh | 31.2% | 13.2%(+18.1)#89 | 12.4%(+18.8)#4,022 |
| 89. | Petersburg | 31.2% | 13.2%(+18.1)#90 | 12.4%(+18.8)#4,030 |
| 90. | Kingman | 31.0% | 13.2%(+17.8)#91 | 12.4%(+18.5)#4,054 |
| 91. | Garrett | 30.8% | 13.2%(+17.7)#92 | 12.4%(+18.4)#4,061 |
| 92. | Frankton | 30.4% | 13.2%(+17.3)#93 | 12.4%(+18.0)#4,116 |
| 93. | Linton | 30.3% | 13.2%(+17.2)#94 | 12.4%(+17.9)#4,128 |
| 94. | Oxford | 30.0% | 13.2%(+16.8)#95 | 12.4%(+17.6)#4,162 |
| 95. | Claypool | 30.0% | 13.2%(+16.8)#96 | 12.4%(+17.6)#4,183 |
| 96. | Dillsboro | 29.7% | 13.2%(+16.6)#97 | 12.4%(+17.3)#4,216 |
| 97. | Vevay | 29.4% | 13.2%(+16.3)#98 | 12.4%(+17.0)#4,242 |
| 98. | Montpelier | 28.9% | 13.2%(+15.8)#99 | 12.4%(+16.5)#4,299 |
| 99. | Gary | 28.3% | 13.2%(+15.2)#100 | 12.4%(+15.9)#4,396 |
| 100. | Paragon | 28.0% | 13.2%(+14.8)#101 | 12.4%(+15.6)#4,445 |
Common Questions
What are the Top 10 Cities with the Highest Poverty Level Among Single Males in Indiana?
Top 10 Cities with the Highest Poverty Level Among Single Males in Indiana are:
#1
100.0%
#2
100.0%
#3
100.0%
#4
100.0%
#5
100.0%
#6
100.0%
#7
100.0%
#8
100.0%
#9
100.0%
#10
100.0%
What city has the Highest Poverty Level Among Single Males in Indiana?
Tri Lakes has the Highest Poverty Level Among Single Males in Indiana with 100.0%.
What is the Poverty Level Among Single Males in the State of Indiana?
Poverty Level Among Single Males in Indiana is 13.2%.
What is the Poverty Level Among Single Males in the United States?
Poverty Level Among Single Males in the United States is 12.4%.