Cities with the Highest Poverty Level Among Single Males in West Virginia
RELATED REPORTS & OPTIONS
Highest Poverty | Single Male
West Virginia
Compare Cities
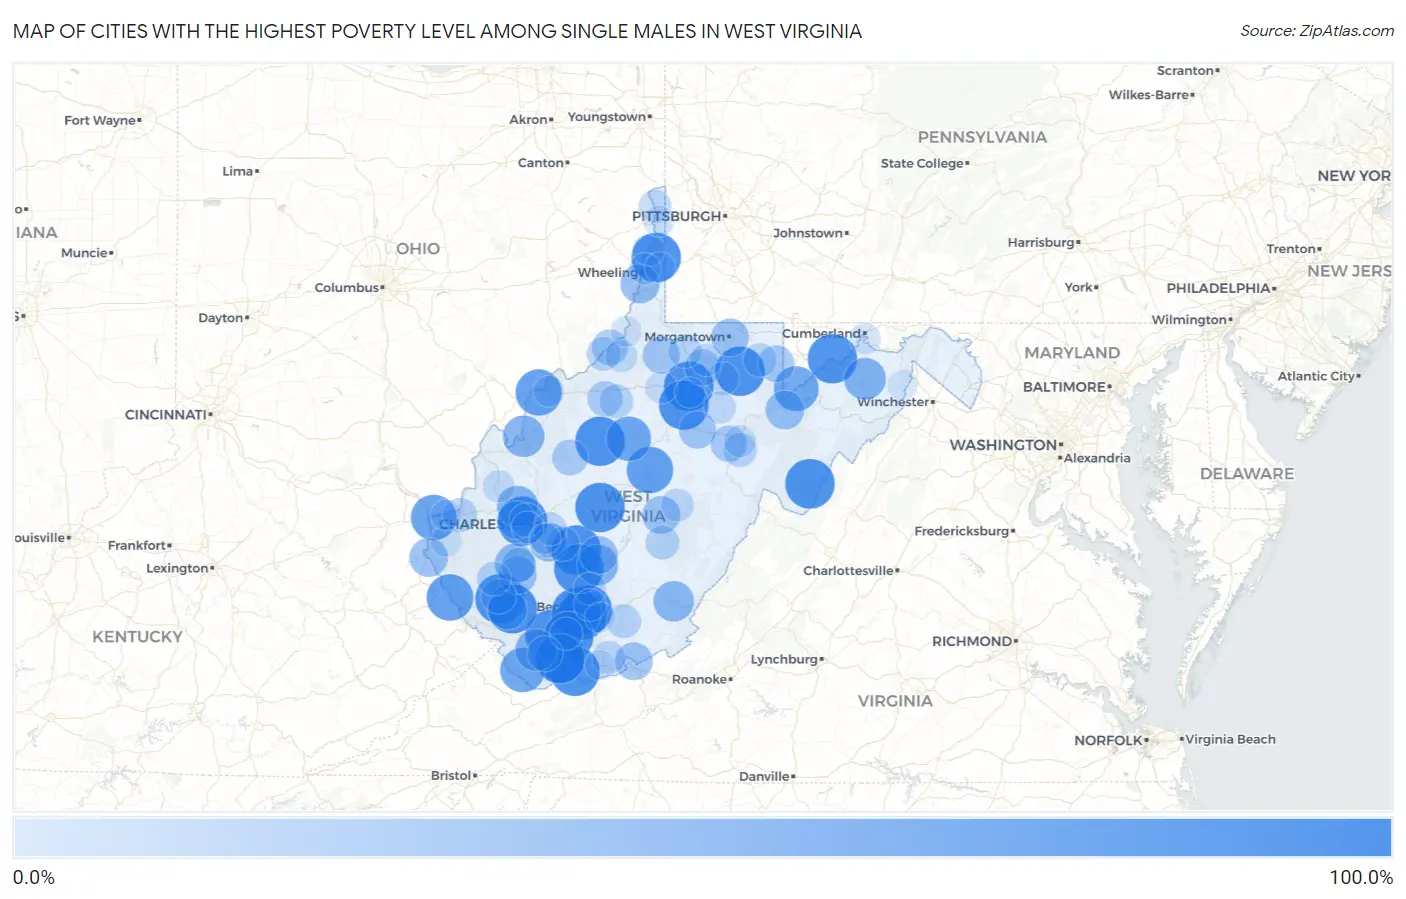
Map of Cities with the Highest Poverty Level Among Single Males in West Virginia
0.0%
100.0%
Cities with the Highest Poverty Level Among Single Males in West Virginia
| City | Single Male Poverty | vs State | vs National | |
| 1. | West Liberty | 100.0% | 20.7%(+79.3)#1 | 12.4%(+87.6)#119 |
| 2. | Sophia | 100.0% | 20.7%(+79.3)#2 | 12.4%(+87.6)#122 |
| 3. | Macarthur | 100.0% | 20.7%(+79.3)#3 | 12.4%(+87.6)#164 |
| 4. | Piedmont | 100.0% | 20.7%(+79.3)#4 | 12.4%(+87.6)#239 |
| 5. | Despard | 100.0% | 20.7%(+79.3)#5 | 12.4%(+87.6)#244 |
| 6. | Mcconnell | 100.0% | 20.7%(+79.3)#6 | 12.4%(+87.6)#267 |
| 7. | Smithers | 100.0% | 20.7%(+79.3)#7 | 12.4%(+87.6)#279 |
| 8. | Jefferson | 100.0% | 20.7%(+79.3)#8 | 12.4%(+87.6)#356 |
| 9. | Pineville | 100.0% | 20.7%(+79.3)#9 | 12.4%(+87.6)#389 |
| 10. | Clay | 100.0% | 20.7%(+79.3)#10 | 12.4%(+87.6)#400 |
| 11. | Lester | 100.0% | 20.7%(+79.3)#11 | 12.4%(+87.6)#441 |
| 12. | Northfork | 100.0% | 20.7%(+79.3)#12 | 12.4%(+87.6)#467 |
| 13. | Lost Creek | 100.0% | 20.7%(+79.3)#13 | 12.4%(+87.6)#474 |
| 14. | Grantsville | 100.0% | 20.7%(+79.3)#14 | 12.4%(+87.6)#487 |
| 15. | Corinne | 100.0% | 20.7%(+79.3)#15 | 12.4%(+87.6)#539 |
| 16. | Kincaid | 100.0% | 20.7%(+79.3)#16 | 12.4%(+87.6)#552 |
| 17. | Kistler | 100.0% | 20.7%(+79.3)#17 | 12.4%(+87.6)#579 |
| 18. | Newburg | 100.0% | 20.7%(+79.3)#18 | 12.4%(+87.6)#608 |
| 19. | Brandywine | 100.0% | 20.7%(+79.3)#19 | 12.4%(+87.6)#683 |
| 20. | Bramwell | 100.0% | 20.7%(+79.3)#20 | 12.4%(+87.6)#684 |
| 21. | Baxter | 100.0% | 20.7%(+79.3)#21 | 12.4%(+87.6)#730 |
| 22. | Keystone | 100.0% | 20.7%(+79.3)#22 | 12.4%(+87.6)#792 |
| 23. | Kermit | 87.5% | 20.7%(+66.8)#23 | 12.4%(+75.1)#978 |
| 24. | Flatwoods | 86.7% | 20.7%(+66.0)#24 | 12.4%(+74.2)#987 |
| 25. | Blennerhassett | 85.7% | 20.7%(+65.1)#25 | 12.4%(+73.3)#994 |
| 26. | Ceredo | 83.3% | 20.7%(+62.7)#26 | 12.4%(+70.9)#1,035 |
| 27. | Bayard | 80.0% | 20.7%(+59.3)#27 | 12.4%(+67.6)#1,099 |
| 28. | Glenville | 78.8% | 20.7%(+58.1)#28 | 12.4%(+66.4)#1,124 |
| 29. | Raysal | 78.8% | 20.7%(+58.1)#29 | 12.4%(+66.4)#1,125 |
| 30. | Romney | 66.7% | 20.7%(+46.0)#30 | 12.4%(+54.2)#1,421 |
| 31. | Davy | 66.7% | 20.7%(+46.0)#31 | 12.4%(+54.2)#1,471 |
| 32. | Ravenswood | 65.6% | 20.7%(+45.0)#32 | 12.4%(+53.2)#1,499 |
| 33. | Poca | 63.3% | 20.7%(+42.6)#33 | 12.4%(+50.9)#1,581 |
| 34. | Fayetteville | 62.8% | 20.7%(+42.1)#34 | 12.4%(+50.3)#1,603 |
| 35. | Lewisburg | 61.3% | 20.7%(+40.6)#35 | 12.4%(+48.9)#1,664 |
| 36. | Danville | 60.0% | 20.7%(+39.3)#36 | 12.4%(+47.6)#1,730 |
| 37. | Mcmechen | 55.4% | 20.7%(+34.7)#37 | 12.4%(+42.9)#1,954 |
| 38. | Man | 54.8% | 20.7%(+34.2)#38 | 12.4%(+42.4)#1,971 |
| 39. | Davis | 53.3% | 20.7%(+32.7)#39 | 12.4%(+40.9)#2,052 |
| 40. | Fort Gay | 53.3% | 20.7%(+32.7)#40 | 12.4%(+40.9)#2,055 |
| 41. | Chesapeake | 51.4% | 20.7%(+30.7)#41 | 12.4%(+38.9)#2,160 |
| 42. | Greenview | 51.2% | 20.7%(+30.6)#42 | 12.4%(+38.8)#2,164 |
| 43. | Ansted | 50.0% | 20.7%(+29.3)#43 | 12.4%(+37.6)#2,224 |
| 44. | Peterstown | 50.0% | 20.7%(+29.3)#44 | 12.4%(+37.6)#2,263 |
| 45. | Cowen | 50.0% | 20.7%(+29.3)#45 | 12.4%(+37.6)#2,272 |
| 46. | Morgantown | 49.4% | 20.7%(+28.7)#46 | 12.4%(+36.9)#2,408 |
| 47. | St Albans | 49.3% | 20.7%(+28.7)#47 | 12.4%(+36.9)#2,409 |
| 48. | Buckhannon | 47.1% | 20.7%(+26.5)#48 | 12.4%(+34.7)#2,510 |
| 49. | Smithfield | 47.1% | 20.7%(+26.4)#49 | 12.4%(+34.6)#2,521 |
| 50. | Terra Alta | 44.2% | 20.7%(+23.6)#50 | 12.4%(+31.8)#2,708 |
| 51. | White Hall | 42.9% | 20.7%(+22.2)#51 | 12.4%(+30.4)#2,796 |
| 52. | Womelsdorf Coalton | 42.9% | 20.7%(+22.2)#52 | 12.4%(+30.4)#2,823 |
| 53. | Sistersville | 41.7% | 20.7%(+21.0)#53 | 12.4%(+29.2)#2,894 |
| 54. | Spencer | 40.7% | 20.7%(+20.1)#54 | 12.4%(+28.3)#2,979 |
| 55. | Ranson Corporation | 39.6% | 20.7%(+19.0)#55 | 12.4%(+27.2)#3,122 |
| 56. | Welch | 39.4% | 20.7%(+18.7)#56 | 12.4%(+27.0)#3,135 |
| 57. | Harrisville | 38.9% | 20.7%(+18.2)#57 | 12.4%(+26.5)#3,172 |
| 58. | Logan | 37.5% | 20.7%(+16.8)#58 | 12.4%(+25.1)#3,267 |
| 59. | Belle | 37.5% | 20.7%(+16.8)#59 | 12.4%(+25.1)#3,270 |
| 60. | Madison | 35.9% | 20.7%(+15.2)#60 | 12.4%(+23.5)#3,440 |
| 61. | Glasgow | 34.8% | 20.7%(+14.1)#61 | 12.4%(+22.3)#3,564 |
| 62. | Pea Ridge | 33.6% | 20.7%(+13.0)#62 | 12.4%(+21.2)#3,643 |
| 63. | Richwood | 33.3% | 20.7%(+12.7)#63 | 12.4%(+20.9)#3,672 |
| 64. | Hinton | 33.3% | 20.7%(+12.7)#64 | 12.4%(+20.9)#3,676 |
| 65. | Chapmanville | 33.3% | 20.7%(+12.7)#65 | 12.4%(+20.9)#3,705 |
| 66. | Beverly | 33.3% | 20.7%(+12.7)#66 | 12.4%(+20.9)#3,717 |
| 67. | Pullman | 33.3% | 20.7%(+12.7)#67 | 12.4%(+20.9)#3,777 |
| 68. | Friendly | 33.3% | 20.7%(+12.7)#68 | 12.4%(+20.9)#3,820 |
| 69. | Dunbar | 33.0% | 20.7%(+12.4)#69 | 12.4%(+20.6)#3,839 |
| 70. | Kingwood | 32.3% | 20.7%(+11.6)#70 | 12.4%(+19.8)#3,915 |
| 71. | Mannington | 31.2% | 20.7%(+10.6)#71 | 12.4%(+18.8)#4,031 |
| 72. | Coal Fork | 30.2% | 20.7%(+9.54)#72 | 12.4%(+17.8)#4,141 |
| 73. | Athens | 30.0% | 20.7%(+9.35)#73 | 12.4%(+17.6)#4,167 |
| 74. | Grafton | 29.9% | 20.7%(+9.25)#74 | 12.4%(+17.5)#4,201 |
| 75. | New Cumberland | 28.8% | 20.7%(+8.16)#75 | 12.4%(+16.4)#4,311 |
| 76. | Addison Webster Springs | 28.6% | 20.7%(+7.92)#76 | 12.4%(+16.1)#4,338 |
| 77. | Fairmont | 27.6% | 20.7%(+6.95)#77 | 12.4%(+15.2)#4,497 |
| 78. | Mullens | 27.0% | 20.7%(+6.38)#78 | 12.4%(+14.6)#4,580 |
| 79. | Mount Hope | 26.9% | 20.7%(+6.27)#79 | 12.4%(+14.5)#4,596 |
| 80. | Philippi | 26.1% | 20.7%(+5.44)#80 | 12.4%(+13.7)#4,701 |
| 81. | Elkins | 25.0% | 20.7%(+4.35)#81 | 12.4%(+12.6)#4,823 |
| 82. | Salem | 25.0% | 20.7%(+4.35)#82 | 12.4%(+12.6)#4,843 |
| 83. | Buffalo | 25.0% | 20.7%(+4.35)#83 | 12.4%(+12.6)#4,866 |
| 84. | Middlebourne | 25.0% | 20.7%(+4.35)#84 | 12.4%(+12.6)#4,881 |
| 85. | Beech Bottom | 25.0% | 20.7%(+4.35)#85 | 12.4%(+12.6)#4,892 |
| 86. | South Charleston | 24.9% | 20.7%(+4.22)#86 | 12.4%(+12.4)#4,964 |
| 87. | Beckley | 24.8% | 20.7%(+4.17)#87 | 12.4%(+12.4)#4,971 |
| 88. | Wheeling | 22.1% | 20.7%(+1.48)#88 | 12.4%(+9.69)#5,428 |
| 89. | Wiley Ford | 22.0% | 20.7%(+1.30)#89 | 12.4%(+9.52)#5,453 |
| 90. | Wayne | 21.7% | 20.7%(+1.09)#90 | 12.4%(+9.30)#5,477 |
| 91. | Parkersburg | 20.8% | 20.7%(+0.110)#91 | 12.4%(+8.33)#5,681 |
| 92. | Marmet | 20.5% | 20.7%(-0.139)#92 | 12.4%(+8.08)#5,715 |
| 93. | Weirton | 20.3% | 20.7%(-0.371)#93 | 12.4%(+7.85)#5,760 |
| 94. | New Martinsville | 19.2% | 20.7%(-1.42)#94 | 12.4%(+6.80)#6,012 |
| 95. | Huntington | 19.2% | 20.7%(-1.44)#95 | 12.4%(+6.78)#6,024 |
| 96. | Valley Grove | 19.0% | 20.7%(-1.60)#96 | 12.4%(+6.61)#6,063 |
| 97. | Stonewood | 18.5% | 20.7%(-2.13)#97 | 12.4%(+6.08)#6,153 |
| 98. | Shady Spring | 17.6% | 20.7%(-3.00)#98 | 12.4%(+5.21)#6,329 |
| 99. | Capon Bridge | 17.6% | 20.7%(-3.00)#99 | 12.4%(+5.21)#6,339 |
| 100. | Princeton | 17.6% | 20.7%(-3.09)#100 | 12.4%(+5.13)#6,363 |
Common Questions
What are the Top 10 Cities with the Highest Poverty Level Among Single Males in West Virginia?
Top 10 Cities with the Highest Poverty Level Among Single Males in West Virginia are:
What city has the Highest Poverty Level Among Single Males in West Virginia?
West Liberty has the Highest Poverty Level Among Single Males in West Virginia with 100.0%.
What is the Poverty Level Among Single Males in the State of West Virginia?
Poverty Level Among Single Males in West Virginia is 20.7%.
What is the Poverty Level Among Single Males in the United States?
Poverty Level Among Single Males in the United States is 12.4%.