Cities with the Highest Poverty Level Among Single Males in Oklahoma
RELATED REPORTS & OPTIONS
Highest Poverty | Single Male
Oklahoma
Compare Cities
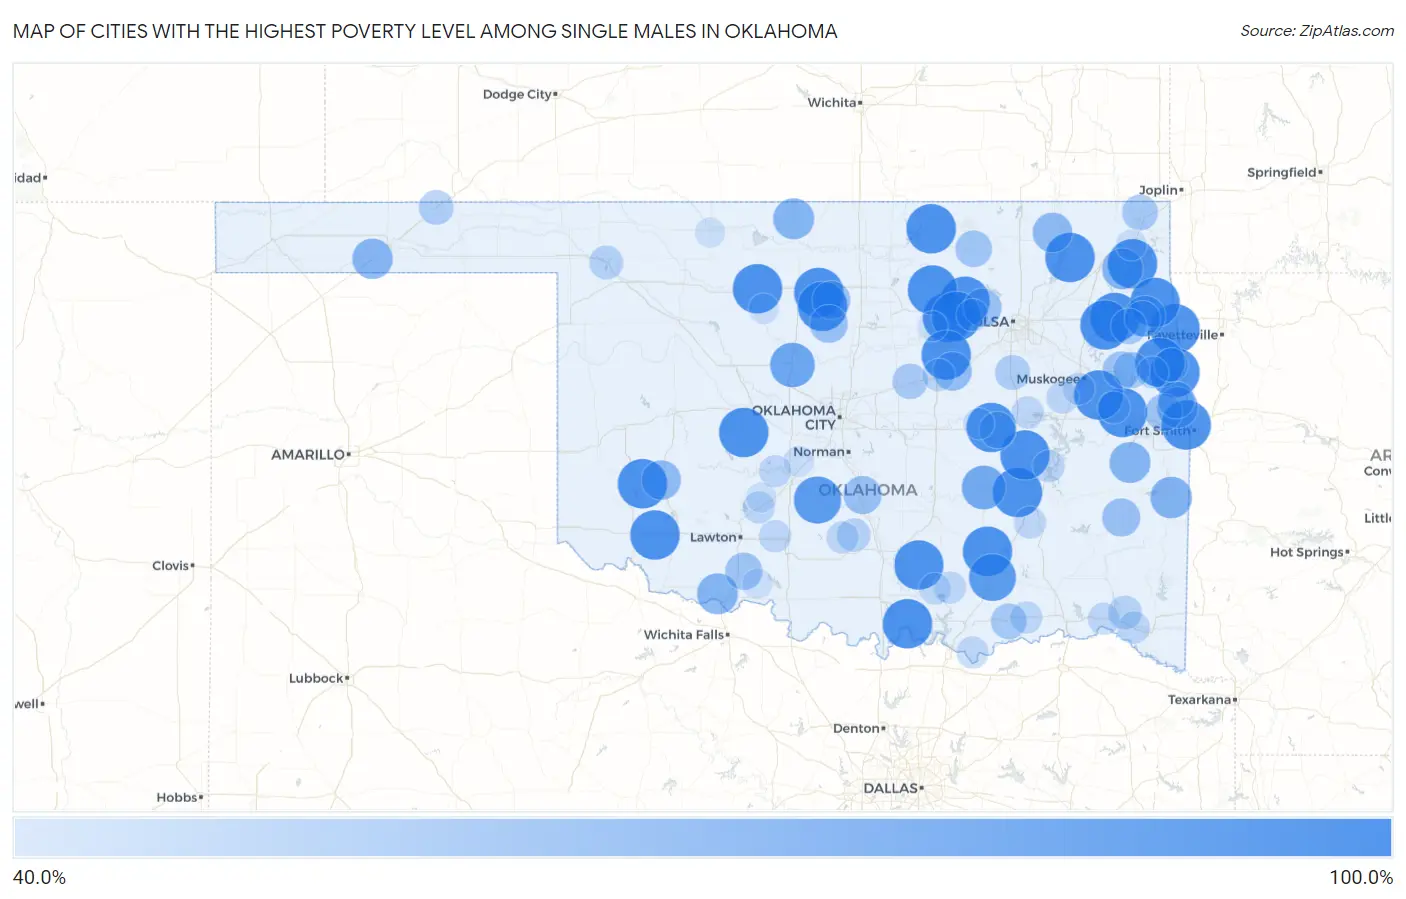
Map of Cities with the Highest Poverty Level Among Single Males in Oklahoma
0.0%
100.0%
Cities with the Highest Poverty Level Among Single Males in Oklahoma
| City | Single Male Poverty | vs State | vs National | |
| 1. | Cleora | 100.0% | 15.8%(+84.2)#1 | 12.4%(+87.6)#142 |
| 2. | Carlisle | 100.0% | 15.8%(+84.2)#2 | 12.4%(+87.6)#381 |
| 3. | Ringwood | 100.0% | 15.8%(+84.2)#3 | 12.4%(+87.6)#392 |
| 4. | Lone Wolf | 100.0% | 15.8%(+84.2)#4 | 12.4%(+87.6)#447 |
| 5. | Arpelar | 100.0% | 15.8%(+84.2)#5 | 12.4%(+87.6)#524 |
| 6. | Snake Creek | 100.0% | 15.8%(+84.2)#6 | 12.4%(+87.6)#547 |
| 7. | Jennings | 100.0% | 15.8%(+84.2)#7 | 12.4%(+87.6)#549 |
| 8. | Mill Creek | 100.0% | 15.8%(+84.2)#8 | 12.4%(+87.6)#583 |
| 9. | Cedar Crest | 100.0% | 15.8%(+84.2)#10 | 12.4%(+87.6)#590 |
| 10. | Watts | 100.0% | 15.8%(+84.2)#11 | 12.4%(+87.6)#591 |
| 11. | River Bottom | 100.0% | 15.8%(+84.2)#12 | 12.4%(+87.6)#604 |
| 12. | Lebanon | 100.0% | 15.8%(+84.2)#13 | 12.4%(+87.6)#643 |
| 13. | Cloud Creek | 100.0% | 15.8%(+84.2)#14 | 12.4%(+87.6)#649 |
| 14. | Elm Grove | 100.0% | 15.8%(+84.2)#15 | 12.4%(+87.6)#728 |
| 15. | Fairmont | 100.0% | 15.8%(+84.2)#16 | 12.4%(+87.6)#755 |
| 16. | Phillips | 100.0% | 15.8%(+84.2)#17 | 12.4%(+87.6)#796 |
| 17. | Lookeba | 100.0% | 15.8%(+84.2)#18 | 12.4%(+87.6)#811 |
| 18. | Osage | 100.0% | 15.8%(+84.2)#19 | 12.4%(+87.6)#813 |
| 19. | Headrick | 100.0% | 15.8%(+84.2)#20 | 12.4%(+87.6)#814 |
| 20. | Hanna | 100.0% | 15.8%(+84.2)#21 | 12.4%(+87.6)#822 |
| 21. | Mulberry | 100.0% | 15.8%(+84.2)#22 | 12.4%(+87.6)#847 |
| 22. | New Alluwe | 100.0% | 15.8%(+84.2)#23 | 12.4%(+87.6)#852 |
| 23. | Moffett | 100.0% | 15.8%(+84.2)#24 | 12.4%(+87.6)#864 |
| 24. | Skedee | 100.0% | 15.8%(+84.2)#25 | 12.4%(+87.6)#874 |
| 25. | Webb City | 100.0% | 15.8%(+84.2)#26 | 12.4%(+87.6)#877 |
| 26. | Terlton | 100.0% | 15.8%(+84.2)#27 | 12.4%(+87.6)#880 |
| 27. | Clearview | 100.0% | 15.8%(+84.2)#28 | 12.4%(+87.6)#884 |
| 28. | Shamrock | 100.0% | 15.8%(+84.2)#29 | 12.4%(+87.6)#887 |
| 29. | Douglas | 100.0% | 15.8%(+84.2)#30 | 12.4%(+87.6)#897 |
| 30. | Bradley | 93.3% | 15.8%(+77.6)#31 | 12.4%(+80.9)#925 |
| 31. | Tushka | 92.9% | 15.8%(+77.1)#32 | 12.4%(+80.4)#928 |
| 32. | Kingfisher | 85.7% | 15.8%(+69.9)#33 | 12.4%(+73.3)#993 |
| 33. | Calvin | 83.3% | 15.8%(+67.6)#34 | 12.4%(+70.9)#1,042 |
| 34. | Heavener | 76.9% | 15.8%(+61.2)#35 | 12.4%(+64.5)#1,157 |
| 35. | Ketchum | 75.0% | 15.8%(+59.2)#36 | 12.4%(+62.6)#1,202 |
| 36. | Mccurtain | 75.0% | 15.8%(+59.2)#37 | 12.4%(+62.6)#1,206 |
| 37. | Wakita | 75.0% | 15.8%(+59.2)#38 | 12.4%(+62.6)#1,210 |
| 38. | Twin Oaks | 75.0% | 15.8%(+59.2)#39 | 12.4%(+62.6)#1,213 |
| 39. | Belfonte | 75.0% | 15.8%(+59.2)#40 | 12.4%(+62.6)#1,216 |
| 40. | Devol | 75.0% | 15.8%(+59.2)#41 | 12.4%(+62.6)#1,222 |
| 41. | Goodwell | 73.7% | 15.8%(+57.9)#42 | 12.4%(+61.2)#1,235 |
| 42. | Delaware | 71.4% | 15.8%(+55.7)#43 | 12.4%(+59.0)#1,301 |
| 43. | Moodys | 70.8% | 15.8%(+55.1)#44 | 12.4%(+58.4)#1,318 |
| 44. | Hobart | 70.7% | 15.8%(+55.0)#45 | 12.4%(+58.3)#1,322 |
| 45. | Depew | 68.6% | 15.8%(+52.8)#46 | 12.4%(+56.1)#1,379 |
| 46. | Talihina | 66.7% | 15.8%(+50.9)#47 | 12.4%(+54.2)#1,438 |
| 47. | Wayne | 66.7% | 15.8%(+50.9)#48 | 12.4%(+54.2)#1,442 |
| 48. | Prue | 66.7% | 15.8%(+50.9)#49 | 12.4%(+54.2)#1,456 |
| 49. | Covington | 66.7% | 15.8%(+50.9)#50 | 12.4%(+54.2)#1,460 |
| 50. | Marshall | 66.7% | 15.8%(+50.9)#51 | 12.4%(+54.2)#1,463 |
| 51. | Zeb | 64.3% | 15.8%(+48.5)#52 | 12.4%(+51.9)#1,542 |
| 52. | Akins | 64.3% | 15.8%(+48.5)#53 | 12.4%(+51.9)#1,544 |
| 53. | Walters | 64.1% | 15.8%(+48.3)#54 | 12.4%(+51.7)#1,554 |
| 54. | Nicut | 63.6% | 15.8%(+47.9)#55 | 12.4%(+51.2)#1,572 |
| 55. | Pawhuska | 62.5% | 15.8%(+46.7)#56 | 12.4%(+50.1)#1,607 |
| 56. | Weleetka | 62.2% | 15.8%(+46.4)#57 | 12.4%(+49.7)#1,634 |
| 57. | Keys | 61.4% | 15.8%(+45.6)#58 | 12.4%(+48.9)#1,662 |
| 58. | Sunray | 60.0% | 15.8%(+44.2)#59 | 12.4%(+47.6)#1,727 |
| 59. | Bennington | 60.0% | 15.8%(+44.2)#60 | 12.4%(+47.6)#1,746 |
| 60. | North Miami | 60.0% | 15.8%(+44.2)#61 | 12.4%(+47.6)#1,747 |
| 61. | Oaks | 60.0% | 15.8%(+44.2)#62 | 12.4%(+47.6)#1,748 |
| 62. | Teresita | 60.0% | 15.8%(+44.2)#63 | 12.4%(+47.6)#1,750 |
| 63. | Chandler | 59.1% | 15.8%(+43.3)#64 | 12.4%(+46.7)#1,781 |
| 64. | Winchester | 57.6% | 15.8%(+41.8)#65 | 12.4%(+45.1)#1,834 |
| 65. | Tyrone | 57.1% | 15.8%(+41.4)#66 | 12.4%(+44.7)#1,852 |
| 66. | Shady Grove Cdp Cherokee County | 54.7% | 15.8%(+38.9)#67 | 12.4%(+42.3)#1,974 |
| 67. | Fairfield | 54.5% | 15.8%(+38.8)#68 | 12.4%(+42.1)#1,989 |
| 68. | Fort Supply | 54.5% | 15.8%(+38.8)#69 | 12.4%(+42.1)#1,993 |
| 69. | Elmore City | 53.8% | 15.8%(+38.1)#70 | 12.4%(+41.4)#2,025 |
| 70. | Wright City | 53.8% | 15.8%(+38.1)#71 | 12.4%(+41.4)#2,026 |
| 71. | Stroud | 51.1% | 15.8%(+35.3)#72 | 12.4%(+38.7)#2,168 |
| 72. | Central High | 50.0% | 15.8%(+34.2)#73 | 12.4%(+37.6)#2,213 |
| 73. | Fletcher | 50.0% | 15.8%(+34.2)#74 | 12.4%(+37.6)#2,231 |
| 74. | Gore | 50.0% | 15.8%(+34.2)#75 | 12.4%(+37.6)#2,232 |
| 75. | Boswell | 50.0% | 15.8%(+34.2)#76 | 12.4%(+37.6)#2,252 |
| 76. | Rocky Mountain | 50.0% | 15.8%(+34.2)#77 | 12.4%(+37.6)#2,269 |
| 77. | Verden | 50.0% | 15.8%(+34.2)#78 | 12.4%(+37.6)#2,278 |
| 78. | Crowder | 50.0% | 15.8%(+34.2)#79 | 12.4%(+37.6)#2,301 |
| 79. | Westport | 50.0% | 15.8%(+34.2)#80 | 12.4%(+37.6)#2,311 |
| 80. | Canadian Shores | 50.0% | 15.8%(+34.2)#81 | 12.4%(+37.6)#2,331 |
| 81. | Milburn | 50.0% | 15.8%(+34.2)#82 | 12.4%(+37.6)#2,337 |
| 82. | Foster | 50.0% | 15.8%(+34.2)#83 | 12.4%(+37.6)#2,341 |
| 83. | Kemp | 50.0% | 15.8%(+34.2)#84 | 12.4%(+37.6)#2,345 |
| 84. | Pittsburg | 50.0% | 15.8%(+34.2)#85 | 12.4%(+37.6)#2,368 |
| 85. | Garvin | 50.0% | 15.8%(+34.2)#86 | 12.4%(+37.6)#2,371 |
| 86. | Grayson | 50.0% | 15.8%(+34.2)#87 | 12.4%(+37.6)#2,375 |
| 87. | Wainwright | 50.0% | 15.8%(+34.2)#88 | 12.4%(+37.6)#2,380 |
| 88. | Summit | 50.0% | 15.8%(+34.2)#89 | 12.4%(+37.6)#2,389 |
| 89. | Swink | 50.0% | 15.8%(+34.2)#90 | 12.4%(+37.6)#2,396 |
| 90. | Tishomingo | 48.9% | 15.8%(+33.1)#91 | 12.4%(+36.4)#2,424 |
| 91. | Okemah | 47.1% | 15.8%(+31.3)#92 | 12.4%(+34.7)#2,513 |
| 92. | Afton | 46.7% | 15.8%(+30.9)#93 | 12.4%(+34.2)#2,539 |
| 93. | Toppers | 46.2% | 15.8%(+30.4)#94 | 12.4%(+33.7)#2,584 |
| 94. | Tonkawa Tribal Housing | 46.2% | 15.8%(+30.4)#95 | 12.4%(+33.7)#2,594 |
| 95. | Amber | 45.5% | 15.8%(+29.7)#96 | 12.4%(+33.0)#2,625 |
| 96. | Ames | 45.5% | 15.8%(+29.7)#97 | 12.4%(+33.0)#2,630 |
| 97. | Temple | 44.8% | 15.8%(+29.1)#98 | 12.4%(+32.4)#2,664 |
| 98. | Alva | 44.7% | 15.8%(+29.0)#99 | 12.4%(+32.3)#2,669 |
| 99. | Yale | 44.4% | 15.8%(+28.7)#100 | 12.4%(+32.0)#2,681 |
| 100. | Cyril | 44.4% | 15.8%(+28.7)#101 | 12.4%(+32.0)#2,687 |
Common Questions
What are the Top 10 Cities with the Highest Poverty Level Among Single Males in Oklahoma?
Top 10 Cities with the Highest Poverty Level Among Single Males in Oklahoma are:
#1
100.0%
#2
100.0%
#3
100.0%
#4
100.0%
#5
100.0%
#6
100.0%
#7
100.0%
#8
100.0%
#9
100.0%
#10
100.0%
What city has the Highest Poverty Level Among Single Males in Oklahoma?
Cleora has the Highest Poverty Level Among Single Males in Oklahoma with 100.0%.
What is the Poverty Level Among Single Males in the State of Oklahoma?
Poverty Level Among Single Males in Oklahoma is 15.8%.
What is the Poverty Level Among Single Males in the United States?
Poverty Level Among Single Males in the United States is 12.4%.