Cities with the Highest Poverty Level Among Single Males in Maryland
RELATED REPORTS & OPTIONS
Highest Poverty | Single Male
Maryland
Compare Cities
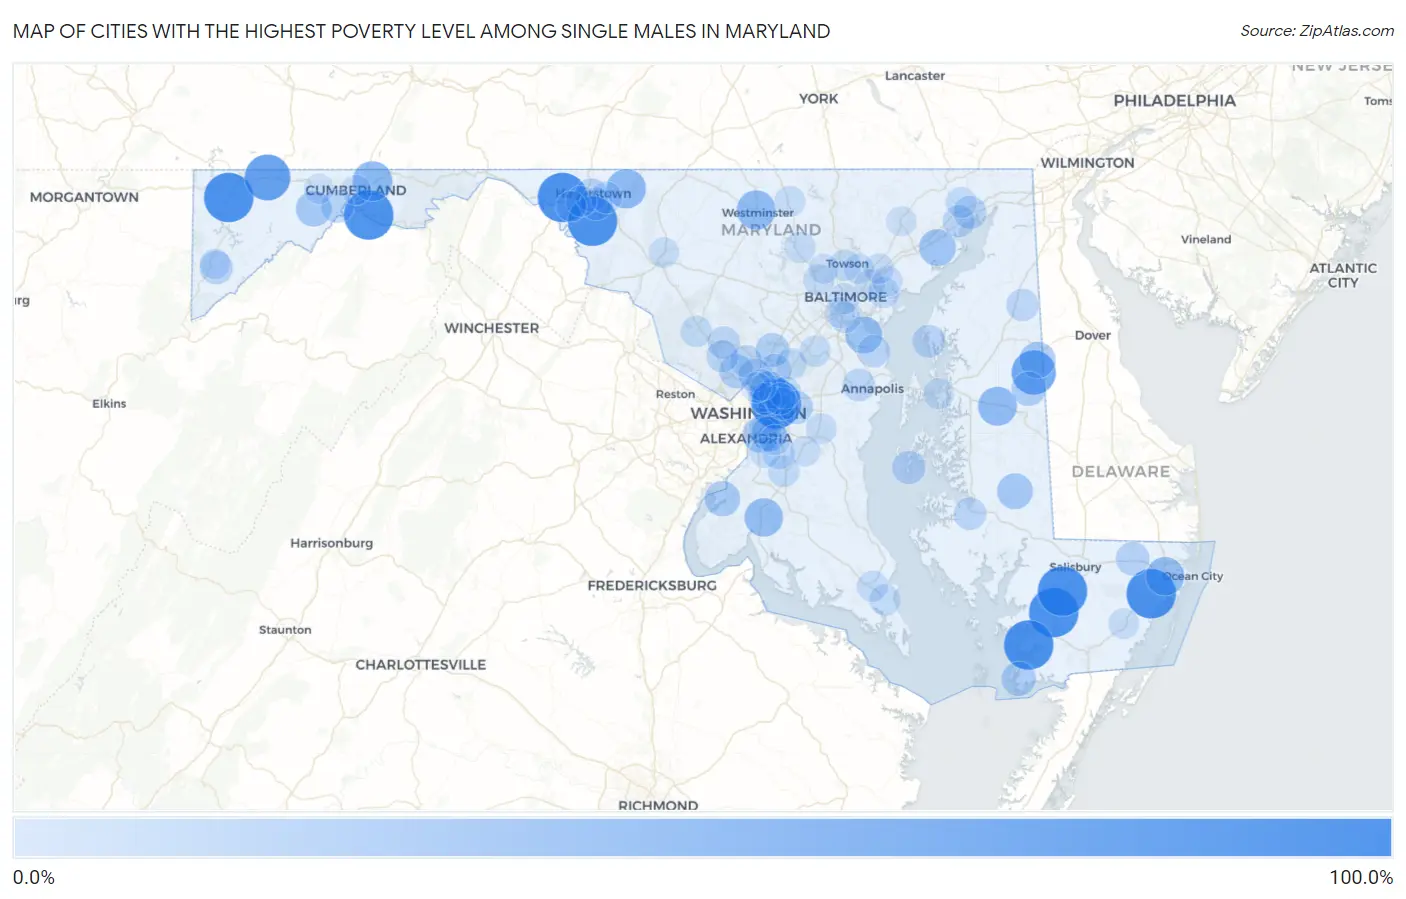
Map of Cities with the Highest Poverty Level Among Single Males in Maryland
0.0%
100.0%
Cities with the Highest Poverty Level Among Single Males in Maryland
| City | Single Male Poverty | vs State | vs National | |
| 1. | Cheverly | 100.0% | 8.3%(+91.7)#1 | 12.4%(+87.6)#6 |
| 2. | Princess Anne | 100.0% | 8.3%(+91.7)#2 | 12.4%(+87.6)#34 |
| 3. | Eden | 100.0% | 8.3%(+91.7)#3 | 12.4%(+87.6)#235 |
| 4. | Pinesburg | 100.0% | 8.3%(+91.7)#4 | 12.4%(+87.6)#405 |
| 5. | Fairmount | 100.0% | 8.3%(+91.7)#5 | 12.4%(+87.6)#461 |
| 6. | Accident | 100.0% | 8.3%(+91.7)#6 | 12.4%(+87.6)#471 |
| 7. | Newark | 100.0% | 8.3%(+91.7)#7 | 12.4%(+87.6)#562 |
| 8. | Breathedsville | 100.0% | 8.3%(+91.7)#8 | 12.4%(+87.6)#645 |
| 9. | Spring Gap | 100.0% | 8.3%(+91.7)#9 | 12.4%(+87.6)#885 |
| 10. | Grantsville | 82.2% | 8.3%(+73.9)#10 | 12.4%(+69.8)#1,054 |
| 11. | Ten Mile Creek | 80.6% | 8.3%(+72.3)#11 | 12.4%(+68.2)#1,077 |
| 12. | Goldsboro | 75.0% | 8.3%(+66.7)#12 | 12.4%(+62.6)#1,218 |
| 13. | Pleasant Grove | 54.5% | 8.3%(+46.2)#13 | 12.4%(+42.1)#1,996 |
| 14. | Smithsburg | 52.3% | 8.3%(+44.0)#14 | 12.4%(+39.8)#2,123 |
| 15. | Westminster | 51.2% | 8.3%(+42.9)#15 | 12.4%(+38.8)#2,165 |
| 16. | Hillsboro | 50.0% | 8.3%(+41.7)#16 | 12.4%(+37.6)#2,373 |
| 17. | Berlin | 48.1% | 8.3%(+39.8)#17 | 12.4%(+35.7)#2,459 |
| 18. | La Plata | 47.8% | 8.3%(+39.5)#18 | 12.4%(+35.4)#2,470 |
| 19. | University Park | 42.9% | 8.3%(+34.6)#19 | 12.4%(+30.4)#2,789 |
| 20. | Fairmount Heights | 41.9% | 8.3%(+33.6)#20 | 12.4%(+29.5)#2,876 |
| 21. | Riviera Beach | 41.0% | 8.3%(+32.7)#21 | 12.4%(+28.5)#2,962 |
| 22. | Perryman | 40.2% | 8.3%(+31.9)#22 | 12.4%(+27.8)#3,011 |
| 23. | Henderson | 37.5% | 8.3%(+29.2)#23 | 12.4%(+25.1)#3,304 |
| 24. | Hurlock | 35.6% | 8.3%(+27.3)#24 | 12.4%(+23.1)#3,478 |
| 25. | Midland | 35.1% | 8.3%(+26.8)#25 | 12.4%(+22.7)#3,525 |
| 26. | Glassmanor | 33.9% | 8.3%(+25.6)#26 | 12.4%(+21.5)#3,626 |
| 27. | Indian Head | 33.3% | 8.3%(+25.0)#27 | 12.4%(+20.9)#3,665 |
| 28. | Marlow Heights | 32.2% | 8.3%(+23.9)#28 | 12.4%(+19.8)#3,921 |
| 29. | Greensboro | 29.2% | 8.3%(+20.9)#29 | 12.4%(+16.7)#4,268 |
| 30. | Crisfield | 29.0% | 8.3%(+20.7)#30 | 12.4%(+16.6)#4,293 |
| 31. | Garrett Park | 28.6% | 8.3%(+20.3)#31 | 12.4%(+16.1)#4,340 |
| 32. | Burtonsville | 27.4% | 8.3%(+19.1)#32 | 12.4%(+15.0)#4,521 |
| 33. | Willards | 25.0% | 8.3%(+16.7)#33 | 12.4%(+12.6)#4,865 |
| 34. | Loch Lynn Heights | 25.0% | 8.3%(+16.7)#34 | 12.4%(+12.6)#4,911 |
| 35. | Lake Arbor | 24.9% | 8.3%(+16.6)#35 | 12.4%(+12.5)#4,958 |
| 36. | Tilghman Island | 24.0% | 8.3%(+15.7)#36 | 12.4%(+11.6)#5,098 |
| 37. | Hagerstown | 24.0% | 8.3%(+15.7)#37 | 12.4%(+11.5)#5,105 |
| 38. | Perryville | 23.6% | 8.3%(+15.3)#38 | 12.4%(+11.2)#5,153 |
| 39. | Cresaptown | 23.5% | 8.3%(+15.2)#39 | 12.4%(+11.1)#5,160 |
| 40. | Four Corners | 22.7% | 8.3%(+14.4)#40 | 12.4%(+10.3)#5,301 |
| 41. | Cottage City | 22.7% | 8.3%(+14.4)#41 | 12.4%(+10.3)#5,308 |
| 42. | Rock Hall | 22.2% | 8.3%(+13.9)#42 | 12.4%(+9.79)#5,389 |
| 43. | Funkstown | 22.2% | 8.3%(+13.9)#43 | 12.4%(+9.79)#5,396 |
| 44. | Cambridge | 21.4% | 8.3%(+13.1)#44 | 12.4%(+8.96)#5,560 |
| 45. | Riverdale Park | 21.1% | 8.3%(+12.8)#45 | 12.4%(+8.64)#5,596 |
| 46. | Lake Shore | 20.8% | 8.3%(+12.5)#46 | 12.4%(+8.35)#5,674 |
| 47. | Beltsville | 20.5% | 8.3%(+12.2)#47 | 12.4%(+8.08)#5,711 |
| 48. | Parole | 20.3% | 8.3%(+12.0)#48 | 12.4%(+7.89)#5,751 |
| 49. | Redland | 20.2% | 8.3%(+11.9)#49 | 12.4%(+7.80)#5,769 |
| 50. | Millington | 20.0% | 8.3%(+11.7)#50 | 12.4%(+7.56)#5,857 |
| 51. | Glenmont | 19.9% | 8.3%(+11.6)#51 | 12.4%(+7.47)#5,910 |
| 52. | Havre De Grace | 19.5% | 8.3%(+11.2)#52 | 12.4%(+7.07)#5,961 |
| 53. | Hillcrest Heights | 19.5% | 8.3%(+11.2)#53 | 12.4%(+7.03)#5,966 |
| 54. | Landover | 19.0% | 8.3%(+10.7)#54 | 12.4%(+6.60)#6,067 |
| 55. | Rockville | 18.7% | 8.3%(+10.4)#55 | 12.4%(+6.30)#6,127 |
| 56. | Mount Rainier | 18.4% | 8.3%(+10.1)#56 | 12.4%(+5.96)#6,176 |
| 57. | New Carrollton | 17.9% | 8.3%(+9.65)#57 | 12.4%(+5.51)#6,277 |
| 58. | Robinwood | 17.8% | 8.3%(+9.55)#58 | 12.4%(+5.41)#6,292 |
| 59. | Cedar Heights | 17.5% | 8.3%(+9.16)#59 | 12.4%(+5.02)#6,381 |
| 60. | Green Valley | 17.4% | 8.3%(+9.10)#60 | 12.4%(+4.96)#6,389 |
| 61. | Brandywine | 16.8% | 8.3%(+8.53)#61 | 12.4%(+4.39)#6,503 |
| 62. | Towson | 16.8% | 8.3%(+8.51)#62 | 12.4%(+4.37)#6,508 |
| 63. | Clinton | 16.4% | 8.3%(+8.10)#63 | 12.4%(+3.96)#6,648 |
| 64. | Landover Hills | 16.4% | 8.3%(+8.07)#64 | 12.4%(+3.93)#6,653 |
| 65. | Woodlawn Cdp Baltimore County | 16.3% | 8.3%(+8.02)#65 | 12.4%(+3.88)#6,662 |
| 66. | Germantown | 15.6% | 8.3%(+7.29)#66 | 12.4%(+3.15)#6,848 |
| 67. | Lexington Park | 15.5% | 8.3%(+7.17)#67 | 12.4%(+3.03)#6,879 |
| 68. | Langley Park | 15.5% | 8.3%(+7.17)#68 | 12.4%(+3.03)#6,880 |
| 69. | California | 15.3% | 8.3%(+7.02)#69 | 12.4%(+2.88)#6,933 |
| 70. | Essex | 15.3% | 8.3%(+7.02)#70 | 12.4%(+2.88)#6,935 |
| 71. | Reisterstown | 15.2% | 8.3%(+6.92)#71 | 12.4%(+2.78)#6,956 |
| 72. | Fort Meade | 14.9% | 8.3%(+6.60)#72 | 12.4%(+2.46)#7,033 |
| 73. | Lochearn | 14.7% | 8.3%(+6.44)#73 | 12.4%(+2.30)#7,068 |
| 74. | South Laurel | 14.6% | 8.3%(+6.34)#74 | 12.4%(+2.20)#7,088 |
| 75. | Brooklyn Park | 14.6% | 8.3%(+6.28)#75 | 12.4%(+2.14)#7,105 |
| 76. | Port Deposit | 14.3% | 8.3%(+5.99)#76 | 12.4%(+1.85)#7,190 |
| 77. | Flower Hill | 14.0% | 8.3%(+5.68)#77 | 12.4%(+1.54)#7,274 |
| 78. | Marlboro Meadows | 14.0% | 8.3%(+5.66)#78 | 12.4%(+1.52)#7,281 |
| 79. | Grasonville | 13.9% | 8.3%(+5.59)#79 | 12.4%(+1.45)#7,299 |
| 80. | Baltimore | 13.6% | 8.3%(+5.30)#80 | 12.4%(+1.16)#7,377 |
| 81. | Hampstead | 13.2% | 8.3%(+4.93)#81 | 12.4%(+0.788)#7,474 |
| 82. | Snow Hill | 12.9% | 8.3%(+4.61)#82 | 12.4%(+0.468)#7,553 |
| 83. | Frederick | 12.8% | 8.3%(+4.49)#83 | 12.4%(+0.353)#7,583 |
| 84. | Rosedale | 12.7% | 8.3%(+4.43)#84 | 12.4%(+0.287)#7,599 |
| 85. | Halfway | 12.7% | 8.3%(+4.37)#85 | 12.4%(+0.233)#7,607 |
| 86. | Friendly | 12.6% | 8.3%(+4.30)#86 | 12.4%(+0.163)#7,622 |
| 87. | Middle River | 12.5% | 8.3%(+4.20)#87 | 12.4%(+0.065)#7,637 |
| 88. | Camp Springs | 12.4% | 8.3%(+4.11)#88 | 12.4%(-0.025)#7,715 |
| 89. | Woodlawn Cdp Prince George S County | 12.4% | 8.3%(+4.11)#89 | 12.4%(-0.027)#7,716 |
| 90. | White Marsh | 12.0% | 8.3%(+3.75)#90 | 12.4%(-0.393)#7,807 |
| 91. | Parkville | 12.0% | 8.3%(+3.74)#91 | 12.4%(-0.399)#7,808 |
| 92. | Baltimore Highlands | 12.0% | 8.3%(+3.72)#92 | 12.4%(-0.422)#7,812 |
| 93. | Marlton | 11.5% | 8.3%(+3.18)#93 | 12.4%(-0.960)#7,977 |
| 94. | Takoma Park | 11.4% | 8.3%(+3.06)#94 | 12.4%(-1.08)#8,003 |
| 95. | Williamsport | 11.0% | 8.3%(+2.70)#95 | 12.4%(-1.44)#8,140 |
| 96. | Frostburg | 10.8% | 8.3%(+2.47)#96 | 12.4%(-1.67)#8,216 |
| 97. | Bel Air North | 10.6% | 8.3%(+2.28)#97 | 12.4%(-1.86)#8,263 |
| 98. | Mountain Lake Park | 10.5% | 8.3%(+2.23)#98 | 12.4%(-1.91)#8,275 |
| 99. | Pikesville | 10.4% | 8.3%(+2.07)#99 | 12.4%(-2.07)#8,320 |
| 100. | Cumberland | 10.3% | 8.3%(+1.98)#100 | 12.4%(-2.16)#8,353 |
Common Questions
What are the Top 10 Cities with the Highest Poverty Level Among Single Males in Maryland?
Top 10 Cities with the Highest Poverty Level Among Single Males in Maryland are:
#1
100.0%
#2
100.0%
#3
100.0%
#4
100.0%
#5
100.0%
#6
100.0%
#7
100.0%
#8
100.0%
#9
100.0%
#10
82.2%
What city has the Highest Poverty Level Among Single Males in Maryland?
Cheverly has the Highest Poverty Level Among Single Males in Maryland with 100.0%.
What is the Poverty Level Among Single Males in the State of Maryland?
Poverty Level Among Single Males in Maryland is 8.3%.
What is the Poverty Level Among Single Males in the United States?
Poverty Level Among Single Males in the United States is 12.4%.