Cities with the Highest Child Poverty Level Among Girls Under the Age of 16 in Massachusetts
RELATED REPORTS & OPTIONS
Highest Poverty | Girls 0-16
Massachusetts
Compare Cities
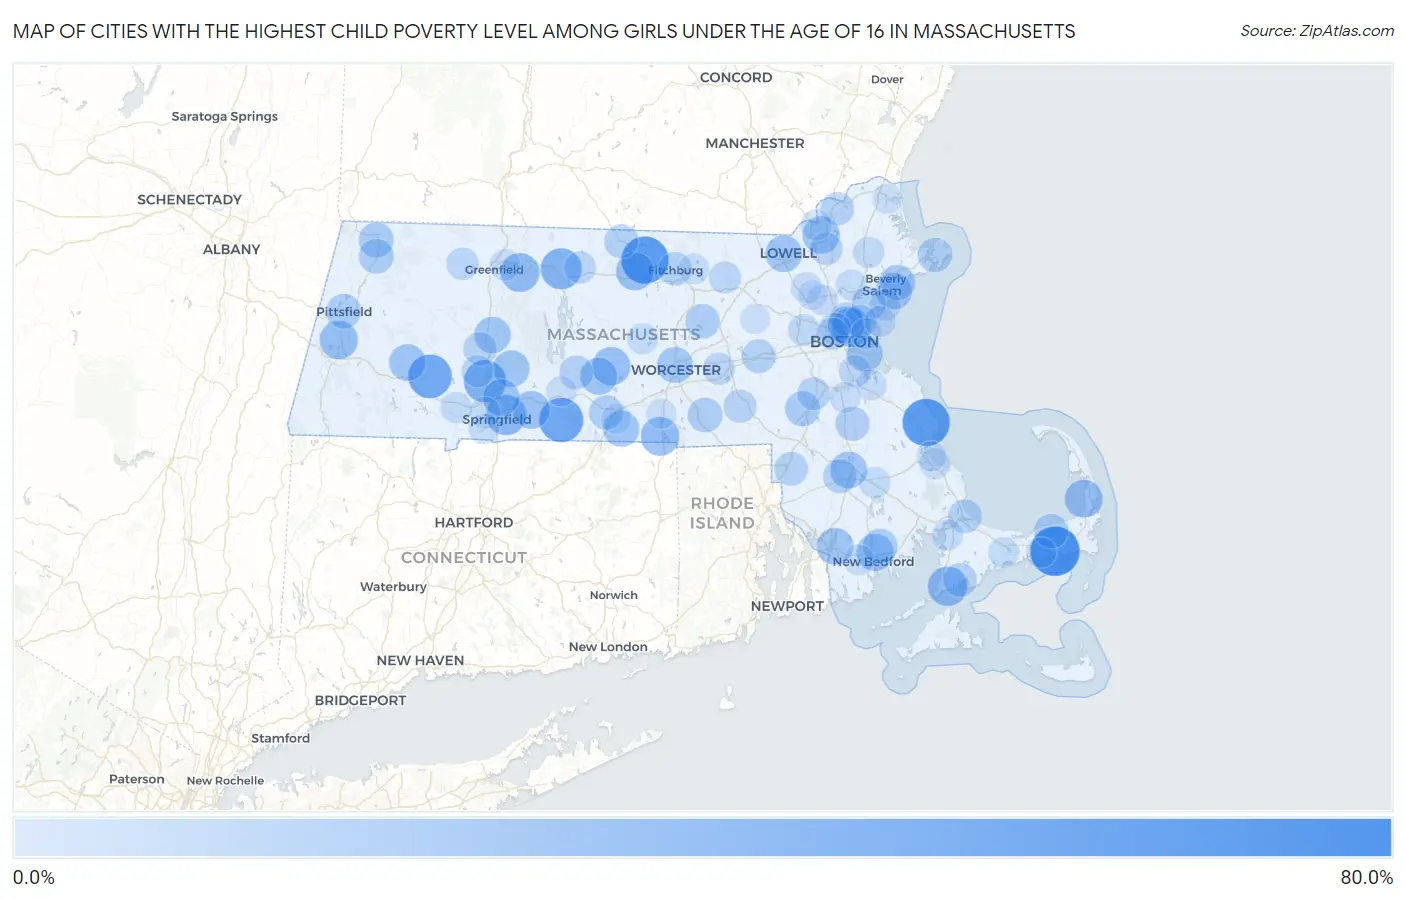
Map of Cities with the Highest Child Poverty Level Among Girls Under the Age of 16 in Massachusetts
0.0%
80.0%
Cities with the Highest Child Poverty Level Among Girls Under the Age of 16 in Massachusetts
| City | Child Poverty (Girls) | vs State | vs National | |
| 1. | Dennis Port | 61.8% | 11.8%(+49.9)#1 | 17.0%(+44.8)#1,962 |
| 2. | Marshfield | 55.2% | 11.8%(+43.3)#2 | 17.0%(+38.2)#2,512 |
| 3. | South Ashburnham | 55.0% | 11.8%(+43.2)#3 | 17.0%(+38.0)#2,518 |
| 4. | Monson Center | 46.6% | 11.8%(+34.8)#4 | 17.0%(+29.6)#3,483 |
| 5. | Huntington | 44.7% | 11.8%(+32.9)#5 | 17.0%(+27.7)#3,728 |
| 6. | Holyoke | 41.0% | 11.8%(+29.1)#6 | 17.0%(+24.0)#4,282 |
| 7. | Orange | 37.4% | 11.8%(+25.6)#7 | 17.0%(+20.4)#4,947 |
| 8. | Springfield | 34.7% | 11.8%(+22.9)#8 | 17.0%(+17.7)#5,520 |
| 9. | Falmouth | 32.8% | 11.8%(+21.0)#9 | 17.0%(+15.8)#6,021 |
| 10. | Millers Falls | 31.3% | 11.8%(+19.5)#10 | 17.0%(+14.4)#6,349 |
| 11. | Chelsea | 31.0% | 11.8%(+19.2)#11 | 17.0%(+14.0)#6,438 |
| 12. | Webster | 30.9% | 11.8%(+19.1)#12 | 17.0%(+13.9)#6,451 |
| 13. | Lenox | 29.3% | 11.8%(+17.4)#13 | 17.0%(+12.3)#6,875 |
| 14. | Gardner | 29.2% | 11.8%(+17.3)#14 | 17.0%(+12.2)#6,910 |
| 15. | North Brookfield | 28.9% | 11.8%(+17.0)#15 | 17.0%(+11.9)#6,976 |
| 16. | North Eastham | 28.4% | 11.8%(+16.6)#16 | 17.0%(+11.4)#7,107 |
| 17. | Wilbraham | 27.3% | 11.8%(+15.5)#17 | 17.0%(+10.3)#7,375 |
| 18. | New Bedford | 26.4% | 11.8%(+14.6)#18 | 17.0%(+9.43)#7,661 |
| 19. | Lawrence | 26.2% | 11.8%(+14.4)#19 | 17.0%(+9.21)#7,728 |
| 20. | West Brookfield | 26.1% | 11.8%(+14.3)#20 | 17.0%(+9.11)#7,755 |
| 21. | Everett | 26.0% | 11.8%(+14.2)#21 | 17.0%(+9.00)#7,799 |
| 22. | Fall River | 25.3% | 11.8%(+13.5)#22 | 17.0%(+8.35)#8,003 |
| 23. | Chester | 25.2% | 11.8%(+13.4)#23 | 17.0%(+8.20)#8,038 |
| 24. | Granby | 25.0% | 11.8%(+13.2)#24 | 17.0%(+8.02)#8,079 |
| 25. | Raynham Center | 25.0% | 11.8%(+13.1)#25 | 17.0%(+7.99)#8,193 |
| 26. | Lowell | 24.8% | 11.8%(+13.0)#26 | 17.0%(+7.81)#8,228 |
| 27. | Chicopee | 24.6% | 11.8%(+12.8)#27 | 17.0%(+7.66)#8,265 |
| 28. | Salem | 24.3% | 11.8%(+12.5)#28 | 17.0%(+7.36)#8,346 |
| 29. | Hatfield | 24.2% | 11.8%(+12.4)#29 | 17.0%(+7.22)#8,378 |
| 30. | Southbridge Town | 23.9% | 11.8%(+12.0)#30 | 17.0%(+6.90)#8,479 |
| 31. | Worcester | 23.2% | 11.8%(+11.4)#31 | 17.0%(+6.20)#8,717 |
| 32. | Boston | 22.1% | 11.8%(+10.3)#32 | 17.0%(+5.13)#9,087 |
| 33. | Beverly | 21.6% | 11.8%(+9.74)#33 | 17.0%(+4.59)#9,266 |
| 34. | North Adams | 20.2% | 11.8%(+8.42)#34 | 17.0%(+3.27)#9,750 |
| 35. | Walpole | 20.2% | 11.8%(+8.34)#35 | 17.0%(+3.19)#9,765 |
| 36. | Acushnet Center | 20.0% | 11.8%(+8.17)#36 | 17.0%(+3.02)#9,802 |
| 37. | Pittsfield | 19.6% | 11.8%(+7.82)#37 | 17.0%(+2.67)#10,002 |
| 38. | Adams | 19.6% | 11.8%(+7.75)#38 | 17.0%(+2.60)#10,025 |
| 39. | Whitinsville | 19.3% | 11.8%(+7.46)#39 | 17.0%(+2.31)#10,129 |
| 40. | East Dennis | 18.9% | 11.8%(+7.06)#40 | 17.0%(+1.91)#10,281 |
| 41. | Clinton | 18.8% | 11.8%(+7.00)#41 | 17.0%(+1.85)#10,300 |
| 42. | Gloucester | 18.4% | 11.8%(+6.56)#42 | 17.0%(+1.41)#10,473 |
| 43. | Fiskdale | 18.4% | 11.8%(+6.55)#43 | 17.0%(+1.40)#10,479 |
| 44. | Brockton | 17.4% | 11.8%(+5.60)#44 | 17.0%(+0.451)#10,855 |
| 45. | Lynn | 17.3% | 11.8%(+5.49)#45 | 17.0%(+0.339)#10,900 |
| 46. | Winchendon | 17.3% | 11.8%(+5.43)#46 | 17.0%(+0.279)#10,928 |
| 47. | Ware | 17.2% | 11.8%(+5.38)#47 | 17.0%(+0.228)#10,954 |
| 48. | Taunton | 17.1% | 11.8%(+5.32)#48 | 17.0%(+0.173)#10,972 |
| 49. | Sagamore | 17.1% | 11.8%(+5.32)#49 | 17.0%(+0.167)#10,973 |
| 50. | East Falmouth | 16.9% | 11.8%(+5.10)#50 | 17.0%(-0.048)#11,079 |
| 51. | Framingham | 16.7% | 11.8%(+4.89)#51 | 17.0%(-0.255)#11,147 |
| 52. | Attleboro | 16.5% | 11.8%(+4.66)#52 | 17.0%(-0.492)#11,281 |
| 53. | Fitchburg | 16.1% | 11.8%(+4.31)#53 | 17.0%(-0.844)#11,414 |
| 54. | Haverhill | 15.6% | 11.8%(+3.78)#54 | 17.0%(-1.37)#11,654 |
| 55. | Northampton | 15.5% | 11.8%(+3.63)#55 | 17.0%(-1.52)#11,719 |
| 56. | Milford | 15.3% | 11.8%(+3.50)#56 | 17.0%(-1.65)#11,801 |
| 57. | Norwood | 14.6% | 11.8%(+2.79)#57 | 17.0%(-2.36)#12,130 |
| 58. | Malden | 14.3% | 11.8%(+2.50)#58 | 17.0%(-2.65)#12,241 |
| 59. | Revere | 14.3% | 11.8%(+2.50)#59 | 17.0%(-2.65)#12,242 |
| 60. | Andover | 13.7% | 11.8%(+1.84)#60 | 17.0%(-3.31)#12,574 |
| 61. | Greenfield | 13.6% | 11.8%(+1.74)#61 | 17.0%(-3.41)#12,630 |
| 62. | Shelburne Falls | 13.1% | 11.8%(+1.25)#62 | 17.0%(-3.90)#12,855 |
| 63. | Somerville | 13.0% | 11.8%(+1.13)#63 | 17.0%(-4.02)#12,912 |
| 64. | Easthampton Town | 12.4% | 11.8%(+0.610)#64 | 17.0%(-4.54)#13,193 |
| 65. | Ayer | 12.2% | 11.8%(+0.401)#65 | 17.0%(-4.75)#13,285 |
| 66. | Quincy | 12.1% | 11.8%(+0.314)#66 | 17.0%(-4.84)#13,327 |
| 67. | Westborough | 12.1% | 11.8%(+0.287)#67 | 17.0%(-4.86)#13,347 |
| 68. | Athol | 12.1% | 11.8%(+0.237)#68 | 17.0%(-4.91)#13,366 |
| 69. | Cambridge | 11.9% | 11.8%(+0.031)#69 | 17.0%(-5.12)#13,465 |
| 70. | Waltham | 11.4% | 11.8%(-0.464)#70 | 17.0%(-5.61)#13,693 |
| 71. | Westfield | 10.7% | 11.8%(-1.17)#71 | 17.0%(-6.32)#14,030 |
| 72. | Swampscott | 10.6% | 11.8%(-1.20)#72 | 17.0%(-6.35)#14,056 |
| 73. | Topsfield | 10.4% | 11.8%(-1.42)#73 | 17.0%(-6.57)#14,178 |
| 74. | West Springfield Town | 10.3% | 11.8%(-1.51)#74 | 17.0%(-6.66)#14,244 |
| 75. | Methuen Town | 9.9% | 11.8%(-1.91)#75 | 17.0%(-7.06)#14,447 |
| 76. | Middleborough Center | 9.8% | 11.8%(-1.98)#76 | 17.0%(-7.13)#14,476 |
| 77. | Turners Falls | 9.8% | 11.8%(-2.05)#77 | 17.0%(-7.20)#14,513 |
| 78. | Monument Beach | 9.6% | 11.8%(-2.21)#78 | 17.0%(-7.36)#14,594 |
| 79. | Rutland | 9.6% | 11.8%(-2.25)#79 | 17.0%(-7.40)#14,617 |
| 80. | Winthrop Town | 9.4% | 11.8%(-2.40)#80 | 17.0%(-7.55)#14,700 |
| 81. | Lynnfield | 9.3% | 11.8%(-2.54)#81 | 17.0%(-7.69)#14,791 |
| 82. | Barnstable Town | 9.3% | 11.8%(-2.55)#82 | 17.0%(-7.70)#14,793 |
| 83. | Nahant | 9.2% | 11.8%(-2.60)#83 | 17.0%(-7.75)#14,823 |
| 84. | Plymouth | 9.1% | 11.8%(-2.77)#84 | 17.0%(-7.92)#14,915 |
| 85. | Randolph Town | 8.8% | 11.8%(-2.99)#85 | 17.0%(-8.14)#15,009 |
| 86. | Agawam Town | 8.7% | 11.8%(-3.14)#86 | 17.0%(-8.29)#15,089 |
| 87. | Weymouth Town | 8.6% | 11.8%(-3.22)#87 | 17.0%(-8.37)#15,123 |
| 88. | Amherst | 8.6% | 11.8%(-3.22)#88 | 17.0%(-8.37)#15,126 |
| 89. | Woburn | 8.6% | 11.8%(-3.24)#89 | 17.0%(-8.39)#15,132 |
| 90. | Lunenburg | 8.6% | 11.8%(-3.25)#90 | 17.0%(-8.40)#15,138 |
| 91. | Smith Mills | 8.5% | 11.8%(-3.29)#91 | 17.0%(-8.44)#15,157 |
| 92. | Pinehurst | 8.5% | 11.8%(-3.34)#92 | 17.0%(-8.49)#15,180 |
| 93. | Palmer Town | 7.8% | 11.8%(-4.06)#93 | 17.0%(-9.21)#15,584 |
| 94. | South Yarmouth | 7.5% | 11.8%(-4.31)#94 | 17.0%(-9.46)#15,736 |
| 95. | Oxford | 7.2% | 11.8%(-4.59)#95 | 17.0%(-9.74)#15,898 |
| 96. | Sturbridge | 7.1% | 11.8%(-4.68)#96 | 17.0%(-9.83)#15,935 |
| 97. | Burlington | 6.8% | 11.8%(-4.99)#97 | 17.0%(-10.1)#16,144 |
| 98. | Newburyport | 6.8% | 11.8%(-5.03)#98 | 17.0%(-10.2)#16,161 |
| 99. | North Plymouth | 6.8% | 11.8%(-5.06)#99 | 17.0%(-10.2)#16,182 |
| 100. | Maynard | 6.7% | 11.8%(-5.08)#100 | 17.0%(-10.2)#16,197 |
Common Questions
What are the Top 10 Cities with the Highest Child Poverty Level Among Girls Under the Age of 16 in Massachusetts?
Top 10 Cities with the Highest Child Poverty Level Among Girls Under the Age of 16 in Massachusetts are:
#1
61.8%
#2
55.2%
#3
55.0%
#4
46.6%
#5
44.7%
#6
41.0%
#7
37.4%
#8
34.7%
#9
32.8%
#10
31.3%
What city has the Highest Child Poverty Level Among Girls Under the Age of 16 in Massachusetts?
Dennis Port has the Highest Child Poverty Level Among Girls Under the Age of 16 in Massachusetts with 61.8%.
What is the Poverty Level Among Girls Under the Age of 16 in the State of Massachusetts?
Poverty Level Among Girls Under the Age of 16 in Massachusetts is 11.8%.
What is the Poverty Level Among Girls Under the Age of 16 in the United States?
Poverty Level Among Girls Under the Age of 16 in the United States is 17.0%.