Cities with the Highest Child Poverty Level Among Girls Under the Age of 16 in Arkansas
RELATED REPORTS & OPTIONS
Highest Poverty | Girls 0-16
Arkansas
Compare Cities
Map of Cities with the Highest Child Poverty Level Among Girls Under the Age of 16 in Arkansas
0.0%
100.0%
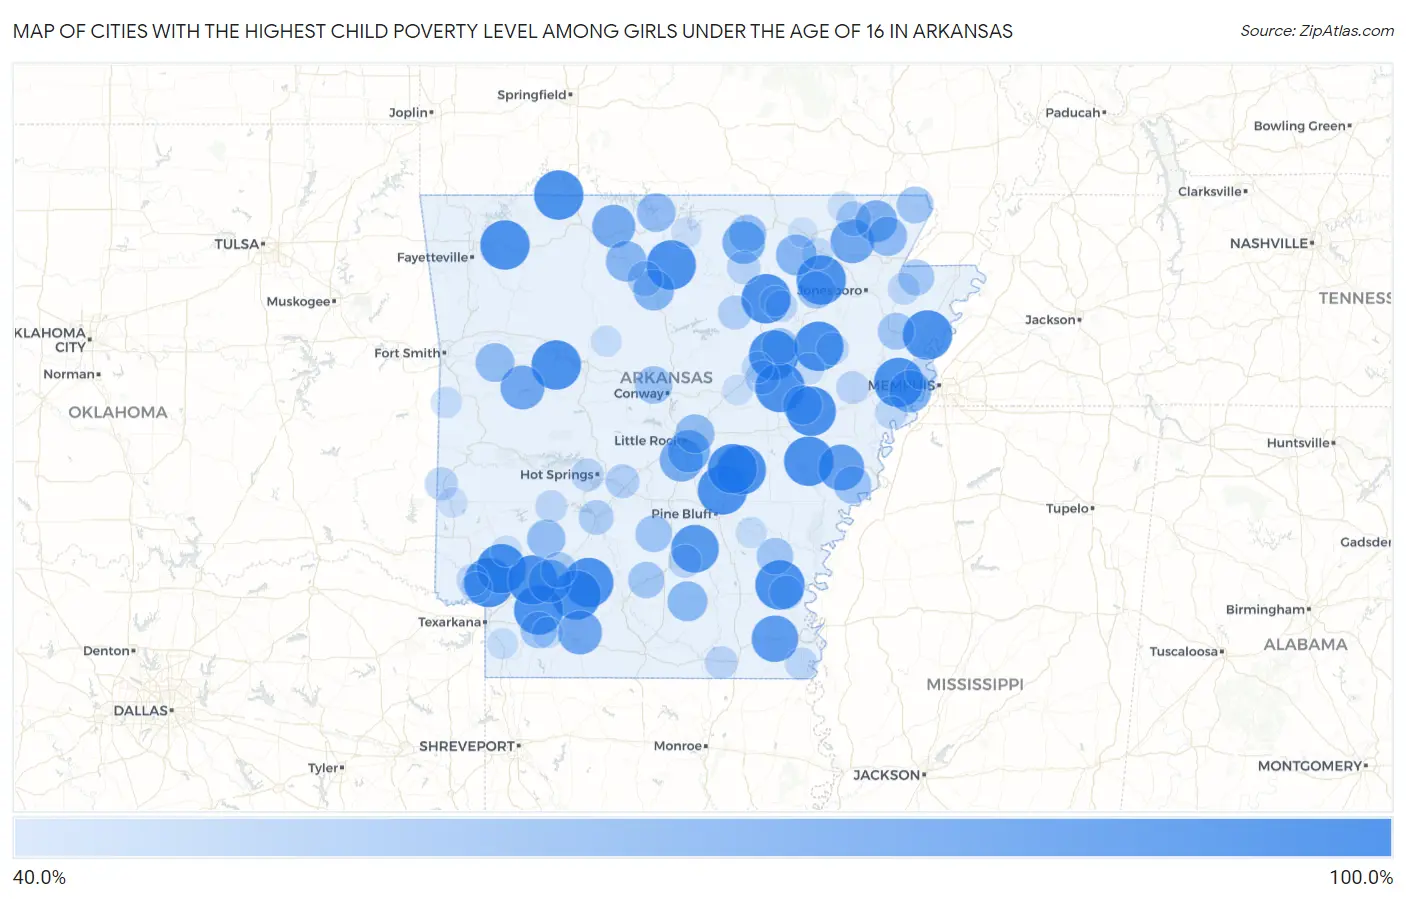
Cities with the Highest Child Poverty Level Among Girls Under the Age of 16 in Arkansas
| City | Child Poverty (Girls) | vs State | vs National | |
| 1. | Holly Grove | 100.0% | 23.3% (+76.7)#1 | 17.0% (+83.0)#138 |
| 2. | Vanndale | 100.0% | 23.3% (+76.7)#2 | 17.0% (+83.0)#162 |
| 3. | Joiner | 100.0% | 23.3% (+76.7)#3 | 17.0% (+83.0)#182 |
| 4. | Yarborough Landing | 100.0% | 23.3% (+76.7)#4 | 17.0% (+83.0)#213 |
| 5. | Batavia | 100.0% | 23.3% (+76.7)#5 | 17.0% (+83.0)#214 |
| 6. | New Blaine | 100.0% | 23.3% (+76.7)#6 | 17.0% (+83.0)#222 |
| 7. | Russell | 100.0% | 23.3% (+76.7)#7 | 17.0% (+83.0)#271 |
| 8. | Bluff City | 100.0% | 23.3% (+76.7)#8 | 17.0% (+83.0)#277 |
| 9. | Sherrill | 100.0% | 23.3% (+76.7)#9 | 17.0% (+83.0)#362 |
| 10. | Tollette | 100.0% | 23.3% (+76.7)#10 | 17.0% (+83.0)#397 |
| 11. | Reed | 100.0% | 23.3% (+76.7)#11 | 17.0% (+83.0)#406 |
| 12. | Alicia | 100.0% | 23.3% (+76.7)#12 | 17.0% (+83.0)#472 |
| 13. | Hindsville | 100.0% | 23.3% (+76.7)#13 | 17.0% (+83.0)#482 |
| 14. | Moorefield | 100.0% | 23.3% (+76.7)#14 | 17.0% (+83.0)#487 |
| 15. | Allport | 100.0% | 23.3% (+76.7)#15 | 17.0% (+83.0)#565 |
| 16. | Georgetown | 100.0% | 23.3% (+76.7)#16 | 17.0% (+83.0)#572 |
| 17. | Coy | 100.0% | 23.3% (+76.7)#17 | 17.0% (+83.0)#573 |
| 18. | Cale | 100.0% | 23.3% (+76.7)#18 | 17.0% (+83.0)#578 |
| 19. | Jennette | 100.0% | 23.3% (+76.7)#19 | 17.0% (+83.0)#582 |
| 20. | Beedeville | 100.0% | 23.3% (+76.7)#20 | 17.0% (+83.0)#584 |
| 21. | Patmos | 100.0% | 23.3% (+76.7)#21 | 17.0% (+83.0)#592 |
| 22. | Big Flat | 100.0% | 23.3% (+76.7)#22 | 17.0% (+83.0)#595 |
| 23. | Fargo | 100.0% | 23.3% (+76.7)#23 | 17.0% (+83.0)#602 |
| 24. | Oakhaven | 100.0% | 23.3% (+76.7)#24 | 17.0% (+83.0)#611 |
| 25. | Blue Eye | 100.0% | 23.3% (+76.7)#25 | 17.0% (+83.0)#662 |
| 26. | Rison | 95.4% | 23.3% (+72.1)#26 | 17.0% (+78.4)#698 |
| 27. | Montrose | 92.5% | 23.3% (+69.2)#27 | 17.0% (+75.5)#724 |
| 28. | Marvell | 90.8% | 23.3% (+67.5)#28 | 17.0% (+73.8)#748 |
| 29. | Mcneil | 85.7% | 23.3% (+62.4)#29 | 17.0% (+68.7)#856 |
| 30. | Blue Mountain | 85.7% | 23.3% (+62.4)#30 | 17.0% (+68.7)#858 |
| 31. | O Kean | 85.7% | 23.3% (+62.4)#31 | 17.0% (+68.7)#859 |
| 32. | Landmark | 83.6% | 23.3% (+60.3)#32 | 17.0% (+66.6)#915 |
| 33. | Zinc | 83.3% | 23.3% (+60.0)#33 | 17.0% (+66.4)#930 |
| 34. | Emmet | 82.9% | 23.3% (+59.6)#34 | 17.0% (+65.9)#942 |
| 35. | Franklin | 81.8% | 23.3% (+58.5)#35 | 17.0% (+64.8)#971 |
| 36. | Sweet Home | 81.6% | 23.3% (+58.3)#36 | 17.0% (+64.6)#977 |
| 37. | Edmondson | 81.5% | 23.3% (+58.2)#37 | 17.0% (+64.6)#979 |
| 38. | Knobel | 80.0% | 23.3% (+56.7)#38 | 17.0% (+63.0)#1,029 |
| 39. | Lacey | 78.4% | 23.3% (+55.0)#39 | 17.0% (+61.4)#1,093 |
| 40. | Leslie | 77.1% | 23.3% (+53.8)#40 | 17.0% (+60.1)#1,135 |
| 41. | St Joe | 76.9% | 23.3% (+53.6)#41 | 17.0% (+59.9)#1,143 |
| 42. | Smithville | 76.9% | 23.3% (+53.6)#42 | 17.0% (+59.9)#1,144 |
| 43. | Banks | 75.0% | 23.3% (+51.7)#43 | 17.0% (+58.0)#1,218 |
| 44. | Cotton Plant | 73.7% | 23.3% (+50.4)#44 | 17.0% (+56.7)#1,273 |
| 45. | Lafe | 73.5% | 23.3% (+50.2)#45 | 17.0% (+56.5)#1,282 |
| 46. | Mcalmont | 72.6% | 23.3% (+49.3)#46 | 17.0% (+55.6)#1,337 |
| 47. | Branch | 72.2% | 23.3% (+48.9)#47 | 17.0% (+55.2)#1,351 |
| 48. | Lakeview | 71.9% | 23.3% (+48.6)#48 | 17.0% (+55.0)#1,367 |
| 49. | Delight | 70.8% | 23.3% (+47.5)#49 | 17.0% (+53.9)#1,428 |
| 50. | Horseshoe Bend | 68.9% | 23.3% (+45.5)#50 | 17.0% (+51.9)#1,516 |
| 51. | Lake View | 68.8% | 23.3% (+45.4)#51 | 17.0% (+51.8)#1,522 |
| 52. | Menifee | 68.4% | 23.3% (+45.1)#52 | 17.0% (+51.4)#1,543 |
| 53. | Swifton | 68.2% | 23.3% (+44.9)#53 | 17.0% (+51.3)#1,548 |
| 54. | Marked Tree | 66.9% | 23.3% (+43.6)#54 | 17.0% (+49.9)#1,604 |
| 55. | Lewisville | 66.7% | 23.3% (+43.4)#55 | 17.0% (+49.7)#1,612 |
| 56. | Mitchellville | 66.7% | 23.3% (+43.4)#56 | 17.0% (+49.7)#1,635 |
| 57. | Pollard | 66.7% | 23.3% (+43.4)#57 | 17.0% (+49.7)#1,637 |
| 58. | Carthage | 66.7% | 23.3% (+43.4)#58 | 17.0% (+49.7)#1,638 |
| 59. | Bearden | 65.7% | 23.3% (+42.4)#59 | 17.0% (+48.8)#1,712 |
| 60. | Bradford | 65.6% | 23.3% (+42.3)#60 | 17.0% (+48.6)#1,721 |
| 61. | Leachville | 64.8% | 23.3% (+41.5)#61 | 17.0% (+47.8)#1,757 |
| 62. | Prescott | 64.1% | 23.3% (+40.8)#62 | 17.0% (+47.1)#1,796 |
| 63. | Marshall | 63.0% | 23.3% (+39.7)#63 | 17.0% (+46.0)#1,868 |
| 64. | Biggers | 61.9% | 23.3% (+38.6)#64 | 17.0% (+44.9)#1,951 |
| 65. | Caddo Valley | 61.8% | 23.3% (+38.5)#65 | 17.0% (+44.9)#1,959 |
| 66. | West Point | 60.0% | 23.3% (+36.7)#66 | 17.0% (+43.0)#2,097 |
| 67. | Concord | 60.0% | 23.3% (+36.7)#67 | 17.0% (+43.0)#2,100 |
| 68. | Magnet Cove | 59.6% | 23.3% (+36.3)#68 | 17.0% (+42.6)#2,131 |
| 69. | Mcgehee | 59.6% | 23.3% (+36.3)#69 | 17.0% (+42.6)#2,132 |
| 70. | Mount Pleasant | 58.3% | 23.3% (+35.0)#70 | 17.0% (+41.4)#2,234 |
| 71. | Kingsland | 57.9% | 23.3% (+34.6)#71 | 17.0% (+40.9)#2,267 |
| 72. | Cove | 57.6% | 23.3% (+34.3)#72 | 17.0% (+40.6)#2,285 |
| 73. | Piney | 57.0% | 23.3% (+33.7)#73 | 17.0% (+40.1)#2,339 |
| 74. | Crossett | 56.8% | 23.3% (+33.5)#74 | 17.0% (+39.8)#2,358 |
| 75. | Colt | 56.5% | 23.3% (+33.2)#75 | 17.0% (+39.5)#2,378 |
| 76. | Hughes | 56.0% | 23.3% (+32.7)#76 | 17.0% (+39.0)#2,413 |
| 77. | Hickory Ridge | 56.0% | 23.3% (+32.7)#77 | 17.0% (+39.0)#2,419 |
| 78. | Eudora | 55.8% | 23.3% (+32.5)#78 | 17.0% (+38.8)#2,450 |
| 79. | Wilton | 55.3% | 23.3% (+32.0)#79 | 17.0% (+38.3)#2,501 |
| 80. | Black Oak | 55.2% | 23.3% (+31.9)#80 | 17.0% (+38.2)#2,510 |
| 81. | Amity | 55.1% | 23.3% (+31.8)#81 | 17.0% (+38.1)#2,516 |
| 82. | Sunset | 54.5% | 23.3% (+31.2)#82 | 17.0% (+37.6)#2,570 |
| 83. | Newark | 54.3% | 23.3% (+31.0)#83 | 17.0% (+37.3)#2,592 |
| 84. | Powhatan | 54.2% | 23.3% (+30.9)#84 | 17.0% (+37.2)#2,598 |
| 85. | Judsonia | 54.0% | 23.3% (+30.7)#85 | 17.0% (+37.1)#2,611 |
| 86. | Mccrory | 53.8% | 23.3% (+30.5)#86 | 17.0% (+36.9)#2,624 |
| 87. | Ashdown | 53.2% | 23.3% (+29.9)#87 | 17.0% (+36.2)#2,712 |
| 88. | Stamps | 53.1% | 23.3% (+29.8)#88 | 17.0% (+36.1)#2,720 |
| 89. | Morrow | 52.9% | 23.3% (+29.6)#89 | 17.0% (+36.0)#2,743 |
| 90. | Nashville | 52.7% | 23.3% (+29.4)#90 | 17.0% (+35.8)#2,765 |
| 91. | Grady | 52.7% | 23.3% (+29.4)#91 | 17.0% (+35.8)#2,766 |
| 92. | Fouke | 52.5% | 23.3% (+29.2)#92 | 17.0% (+35.5)#2,786 |
| 93. | Hartford | 52.4% | 23.3% (+29.1)#93 | 17.0% (+35.4)#2,797 |
| 94. | Hector | 52.3% | 23.3% (+29.0)#94 | 17.0% (+35.3)#2,806 |
| 95. | Sulphur Rock | 52.1% | 23.3% (+28.8)#95 | 17.0% (+35.1)#2,827 |
| 96. | Mcrae | 51.5% | 23.3% (+28.2)#96 | 17.0% (+34.6)#2,872 |
| 97. | Salesville | 51.0% | 23.3% (+27.7)#97 | 17.0% (+34.0)#2,918 |
| 98. | Wickes | 50.6% | 23.3% (+27.3)#98 | 17.0% (+33.6)#2,949 |
| 99. | Ravenden | 50.0% | 23.3% (+26.7)#99 | 17.0% (+33.0)#3,026 |
| 100. | Maynard | 50.0% | 23.3% (+26.7)#100 | 17.0% (+33.0)#3,027 |
Common Questions
What are the Top 10 Cities with the Highest Child Poverty Level Among Girls Under the Age of 16 in Arkansas?
Top 10 Cities with the Highest Child Poverty Level Among Girls Under the Age of 16 in Arkansas are:
#1
100.0%
#2
100.0%
#3
100.0%
#4
100.0%
#5
100.0%
#6
100.0%
#7
100.0%
#8
100.0%
#9
100.0%
#10
100.0%
What city has the Highest Child Poverty Level Among Girls Under the Age of 16 in Arkansas?
Holly Grove has the Highest Child Poverty Level Among Girls Under the Age of 16 in Arkansas with 100.0%.
What is the Poverty Level Among Girls Under the Age of 16 in the State of Arkansas?
Poverty Level Among Girls Under the Age of 16 in Arkansas is 23.3%.
What is the Poverty Level Among Girls Under the Age of 16 in the United States?
Poverty Level Among Girls Under the Age of 16 in the United States is 17.0%.