Cities with the Highest Child Poverty Level Among Girls Under the Age of 16 in Oklahoma
RELATED REPORTS & OPTIONS
Highest Poverty | Girls 0-16
Oklahoma
Compare Cities
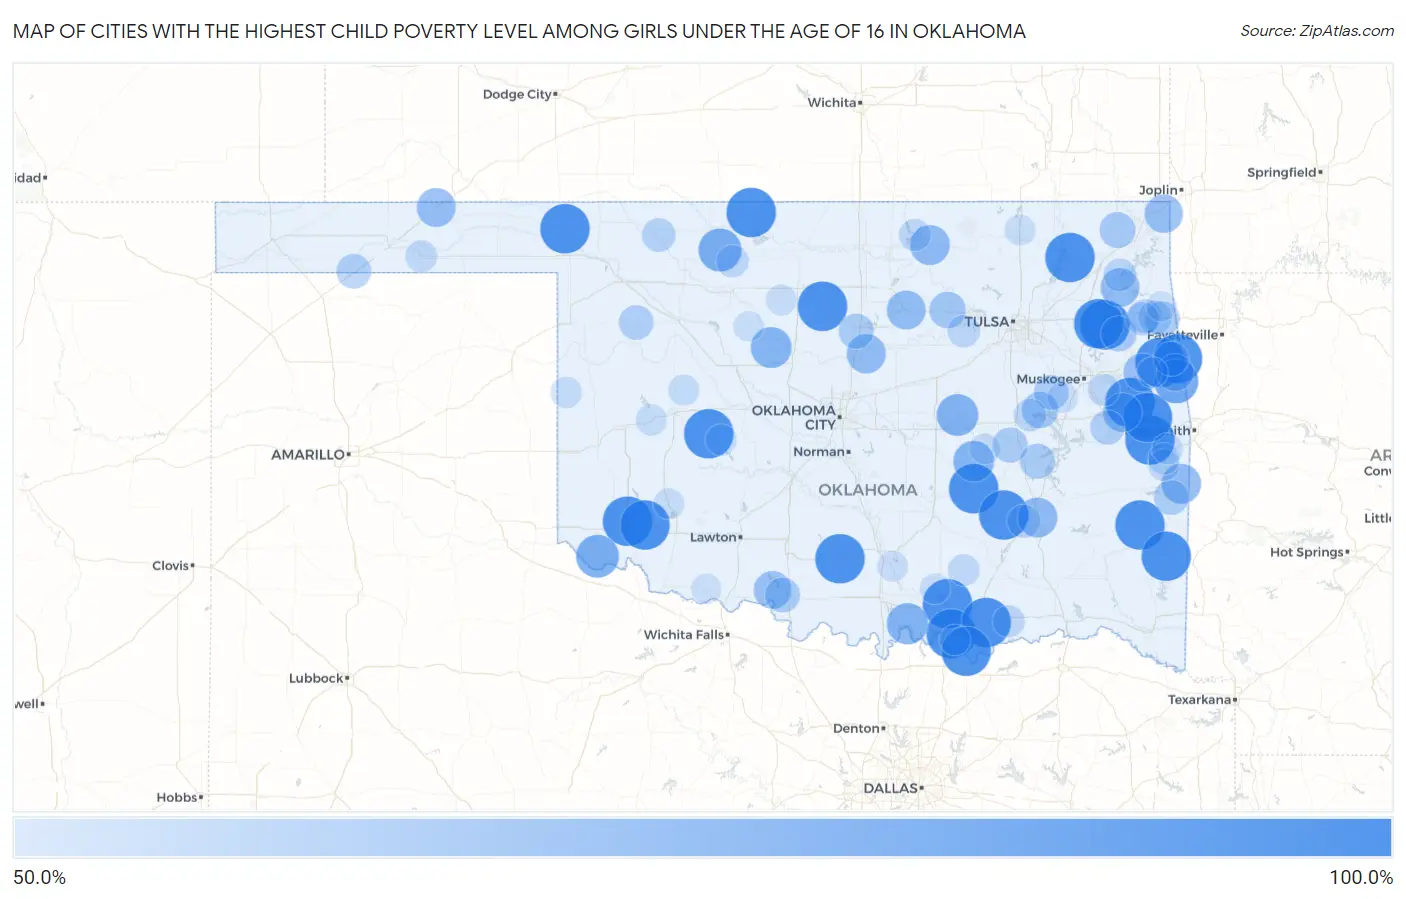
Map of Cities with the Highest Child Poverty Level Among Girls Under the Age of 16 in Oklahoma
0.0%
100.0%
Cities with the Highest Child Poverty Level Among Girls Under the Age of 16 in Oklahoma
| City | Child Poverty (Girls) | vs State | vs National | |
| 1. | Cedar Crest | 100.0% | 20.8%(+79.2)#1 | 17.0%(+83.0)#291 |
| 2. | Colony | 100.0% | 20.8%(+79.2)#2 | 17.0%(+83.0)#424 |
| 3. | Whitesboro | 100.0% | 20.8%(+79.2)#4 | 17.0%(+83.0)#435 |
| 4. | Bee | 100.0% | 20.8%(+79.2)#5 | 17.0%(+83.0)#436 |
| 5. | Box | 100.0% | 20.8%(+79.2)#6 | 17.0%(+83.0)#452 |
| 6. | Murphy | 100.0% | 20.8%(+79.2)#7 | 17.0%(+83.0)#454 |
| 7. | Martha | 100.0% | 20.8%(+79.2)#8 | 17.0%(+83.0)#467 |
| 8. | Moyers | 100.0% | 20.8%(+79.2)#9 | 17.0%(+83.0)#495 |
| 9. | Platter | 100.0% | 20.8%(+79.2)#10 | 17.0%(+83.0)#509 |
| 10. | Ratliff City | 100.0% | 20.8%(+79.2)#11 | 17.0%(+83.0)#521 |
| 11. | Smithville | 100.0% | 20.8%(+79.2)#12 | 17.0%(+83.0)#531 |
| 12. | Hoyt | 100.0% | 20.8%(+79.2)#13 | 17.0%(+83.0)#532 |
| 13. | Blue | 100.0% | 20.8%(+79.2)#14 | 17.0%(+83.0)#536 |
| 14. | Atwood | 100.0% | 20.8%(+79.2)#15 | 17.0%(+83.0)#540 |
| 15. | Cowlington | 100.0% | 20.8%(+79.2)#16 | 17.0%(+83.0)#543 |
| 16. | Mulberry | 100.0% | 20.8%(+79.2)#17 | 17.0%(+83.0)#585 |
| 17. | New Alluwe | 100.0% | 20.8%(+79.2)#18 | 17.0%(+83.0)#594 |
| 18. | Hendrix | 100.0% | 20.8%(+79.2)#19 | 17.0%(+83.0)#604 |
| 19. | Emet | 100.0% | 20.8%(+79.2)#20 | 17.0%(+83.0)#625 |
| 20. | Whippoorwill | 100.0% | 20.8%(+79.2)#21 | 17.0%(+83.0)#634 |
| 21. | Ashland | 100.0% | 20.8%(+79.2)#22 | 17.0%(+83.0)#638 |
| 22. | Badger Lee | 100.0% | 20.8%(+79.2)#23 | 17.0%(+83.0)#642 |
| 23. | Bunch | 100.0% | 20.8%(+79.2)#24 | 17.0%(+83.0)#655 |
| 24. | Douglas | 100.0% | 20.8%(+79.2)#25 | 17.0%(+83.0)#663 |
| 25. | Rosston | 100.0% | 20.8%(+79.2)#26 | 17.0%(+83.0)#666 |
| 26. | Amorita | 100.0% | 20.8%(+79.2)#27 | 17.0%(+83.0)#672 |
| 27. | Piney | 100.0% | 20.8%(+79.2)#28 | 17.0%(+83.0)#674 |
| 28. | Friendship | 100.0% | 20.8%(+79.2)#29 | 17.0%(+83.0)#680 |
| 29. | Bell | 86.3% | 20.8%(+65.4)#30 | 17.0%(+69.3)#843 |
| 30. | Dacoma | 83.3% | 20.8%(+62.5)#31 | 17.0%(+66.4)#929 |
| 31. | Eldorado | 83.0% | 20.8%(+62.1)#32 | 17.0%(+66.0)#936 |
| 32. | Boley | 80.0% | 20.8%(+59.2)#33 | 17.0%(+63.0)#1,017 |
| 33. | Lebanon | 78.9% | 20.8%(+58.1)#34 | 17.0%(+62.0)#1,075 |
| 34. | Yeager | 77.8% | 20.8%(+56.9)#35 | 17.0%(+60.8)#1,112 |
| 35. | Loyal | 77.8% | 20.8%(+56.9)#36 | 17.0%(+60.8)#1,113 |
| 36. | Monroe | 75.0% | 20.8%(+54.2)#37 | 17.0%(+58.0)#1,228 |
| 37. | Burbank | 75.0% | 20.8%(+54.2)#38 | 17.0%(+58.0)#1,229 |
| 38. | Bowring | 75.0% | 20.8%(+54.2)#39 | 17.0%(+58.0)#1,233 |
| 39. | Blanco | 75.0% | 20.8%(+54.2)#40 | 17.0%(+58.0)#1,234 |
| 40. | Langston | 73.6% | 20.8%(+52.8)#41 | 17.0%(+56.6)#1,276 |
| 41. | Spavinaw | 73.1% | 20.8%(+52.2)#42 | 17.0%(+56.1)#1,300 |
| 42. | Glencoe | 72.9% | 20.8%(+52.1)#43 | 17.0%(+55.9)#1,309 |
| 43. | Tyrone | 72.8% | 20.8%(+52.0)#44 | 17.0%(+55.9)#1,316 |
| 44. | Carlisle | 72.7% | 20.8%(+51.9)#45 | 17.0%(+55.8)#1,322 |
| 45. | Peoria | 71.4% | 20.8%(+50.6)#46 | 17.0%(+54.5)#1,398 |
| 46. | Avard | 71.4% | 20.8%(+50.6)#47 | 17.0%(+54.5)#1,399 |
| 47. | Tenkiller | 71.0% | 20.8%(+50.1)#48 | 17.0%(+54.0)#1,421 |
| 48. | Hastings | 70.0% | 20.8%(+49.2)#49 | 17.0%(+53.0)#1,465 |
| 49. | Elm Grove | 68.4% | 20.8%(+47.6)#50 | 17.0%(+51.4)#1,544 |
| 50. | Hallett | 66.7% | 20.8%(+45.8)#51 | 17.0%(+49.7)#1,660 |
| 51. | Hitchita | 66.7% | 20.8%(+45.8)#52 | 17.0%(+49.7)#1,668 |
| 52. | Bluejacket | 65.2% | 20.8%(+44.4)#53 | 17.0%(+48.2)#1,742 |
| 53. | Peggs | 64.2% | 20.8%(+43.3)#54 | 17.0%(+47.2)#1,795 |
| 54. | Mulhall | 63.6% | 20.8%(+42.8)#55 | 17.0%(+46.7)#1,839 |
| 55. | Dustin | 63.4% | 20.8%(+42.5)#56 | 17.0%(+46.4)#1,849 |
| 56. | Indianola | 63.3% | 20.8%(+42.5)#57 | 17.0%(+46.4)#1,850 |
| 57. | Waurika | 63.2% | 20.8%(+42.4)#58 | 17.0%(+46.2)#1,856 |
| 58. | Boynton | 62.5% | 20.8%(+41.7)#59 | 17.0%(+45.5)#1,911 |
| 59. | Dripping Springs | 62.5% | 20.8%(+41.7)#60 | 17.0%(+45.5)#1,916 |
| 60. | Heavener | 62.5% | 20.8%(+41.6)#61 | 17.0%(+45.5)#1,917 |
| 61. | Texhoma | 62.4% | 20.8%(+41.5)#62 | 17.0%(+45.4)#1,920 |
| 62. | Vici | 62.2% | 20.8%(+41.3)#63 | 17.0%(+45.2)#1,934 |
| 63. | Peavine | 61.9% | 20.8%(+41.1)#64 | 17.0%(+44.9)#1,953 |
| 64. | Simms | 61.7% | 20.8%(+40.8)#65 | 17.0%(+44.7)#1,966 |
| 65. | Twin Oaks | 60.0% | 20.8%(+39.2)#66 | 17.0%(+43.0)#2,090 |
| 66. | Freedom | 60.0% | 20.8%(+39.2)#67 | 17.0%(+43.0)#2,095 |
| 67. | Flint Creek | 59.8% | 20.8%(+39.0)#68 | 17.0%(+42.8)#2,115 |
| 68. | Oaks | 59.1% | 20.8%(+38.3)#69 | 17.0%(+42.1)#2,158 |
| 69. | Kiowa | 58.6% | 20.8%(+37.7)#70 | 17.0%(+41.6)#2,207 |
| 70. | White Eagle | 58.1% | 20.8%(+37.3)#71 | 17.0%(+41.1)#2,254 |
| 71. | Langley | 57.9% | 20.8%(+37.1)#72 | 17.0%(+40.9)#2,266 |
| 72. | Lawrence Creek | 57.1% | 20.8%(+36.3)#73 | 17.0%(+40.2)#2,333 |
| 73. | Hoffman | 57.1% | 20.8%(+36.3)#74 | 17.0%(+40.2)#2,335 |
| 74. | Elohim | 57.1% | 20.8%(+36.3)#75 | 17.0%(+40.2)#2,338 |
| 75. | Carmen | 56.8% | 20.8%(+35.9)#76 | 17.0%(+39.8)#2,361 |
| 76. | Bennington | 56.0% | 20.8%(+35.2)#77 | 17.0%(+39.0)#2,416 |
| 77. | Kaw City | 56.0% | 20.8%(+35.2)#78 | 17.0%(+39.0)#2,418 |
| 78. | Braggs | 56.0% | 20.8%(+35.2)#79 | 17.0%(+39.0)#2,421 |
| 79. | Hardesty | 55.6% | 20.8%(+34.7)#80 | 17.0%(+38.6)#2,470 |
| 80. | Wapanucka | 55.4% | 20.8%(+34.6)#81 | 17.0%(+38.5)#2,487 |
| 81. | Shady Point | 55.3% | 20.8%(+34.5)#82 | 17.0%(+38.3)#2,498 |
| 82. | Panama | 54.8% | 20.8%(+34.0)#83 | 17.0%(+37.9)#2,535 |
| 83. | Eakly | 54.0% | 20.8%(+33.2)#84 | 17.0%(+37.0)#2,614 |
| 84. | Reydon | 53.8% | 20.8%(+33.0)#85 | 17.0%(+36.9)#2,640 |
| 85. | Foss | 53.8% | 20.8%(+33.0)#86 | 17.0%(+36.9)#2,641 |
| 86. | Spiro | 53.8% | 20.8%(+32.9)#87 | 17.0%(+36.8)#2,650 |
| 87. | Custer City | 53.7% | 20.8%(+32.9)#88 | 17.0%(+36.8)#2,652 |
| 88. | Roosevelt | 53.3% | 20.8%(+32.5)#89 | 17.0%(+36.4)#2,690 |
| 89. | Wetumka | 53.1% | 20.8%(+32.2)#90 | 17.0%(+36.1)#2,725 |
| 90. | Dewey | 52.9% | 20.8%(+32.0)#91 | 17.0%(+35.9)#2,749 |
| 91. | Drummond | 52.8% | 20.8%(+32.0)#92 | 17.0%(+35.9)#2,751 |
| 92. | Dougherty | 52.6% | 20.8%(+31.8)#93 | 17.0%(+35.7)#2,778 |
| 93. | Wainwright | 52.6% | 20.8%(+31.8)#94 | 17.0%(+35.7)#2,779 |
| 94. | Colbert | 52.5% | 20.8%(+31.7)#95 | 17.0%(+35.6)#2,781 |
| 95. | Tishomingo | 52.5% | 20.8%(+31.7)#96 | 17.0%(+35.6)#2,783 |
| 96. | Rocky Mountain | 52.5% | 20.8%(+31.6)#97 | 17.0%(+35.5)#2,792 |
| 97. | Lowrey | 52.1% | 20.8%(+31.2)#98 | 17.0%(+35.1)#2,825 |
| 98. | Okeene | 51.9% | 20.8%(+31.1)#99 | 17.0%(+34.9)#2,842 |
| 99. | Grandfield | 51.7% | 20.8%(+30.9)#100 | 17.0%(+34.8)#2,856 |
| 100. | Colcord | 51.5% | 20.8%(+30.6)#101 | 17.0%(+34.5)#2,880 |
Common Questions
What are the Top 10 Cities with the Highest Child Poverty Level Among Girls Under the Age of 16 in Oklahoma?
Top 10 Cities with the Highest Child Poverty Level Among Girls Under the Age of 16 in Oklahoma are:
#1
100.0%
#2
100.0%
#3
100.0%
#4
100.0%
#5
100.0%
#6
100.0%
#7
100.0%
#8
100.0%
#9
100.0%
#10
100.0%
What city has the Highest Child Poverty Level Among Girls Under the Age of 16 in Oklahoma?
Cedar Crest has the Highest Child Poverty Level Among Girls Under the Age of 16 in Oklahoma with 100.0%.
What is the Poverty Level Among Girls Under the Age of 16 in the State of Oklahoma?
Poverty Level Among Girls Under the Age of 16 in Oklahoma is 20.8%.
What is the Poverty Level Among Girls Under the Age of 16 in the United States?
Poverty Level Among Girls Under the Age of 16 in the United States is 17.0%.