Cities with the Highest Child Poverty Level Among Girls Under the Age of 16 in Ohio
RELATED REPORTS & OPTIONS
Highest Poverty | Girls 0-16
Ohio
Compare Cities
Map of Cities with the Highest Child Poverty Level Among Girls Under the Age of 16 in Ohio
0.0%
100.0%
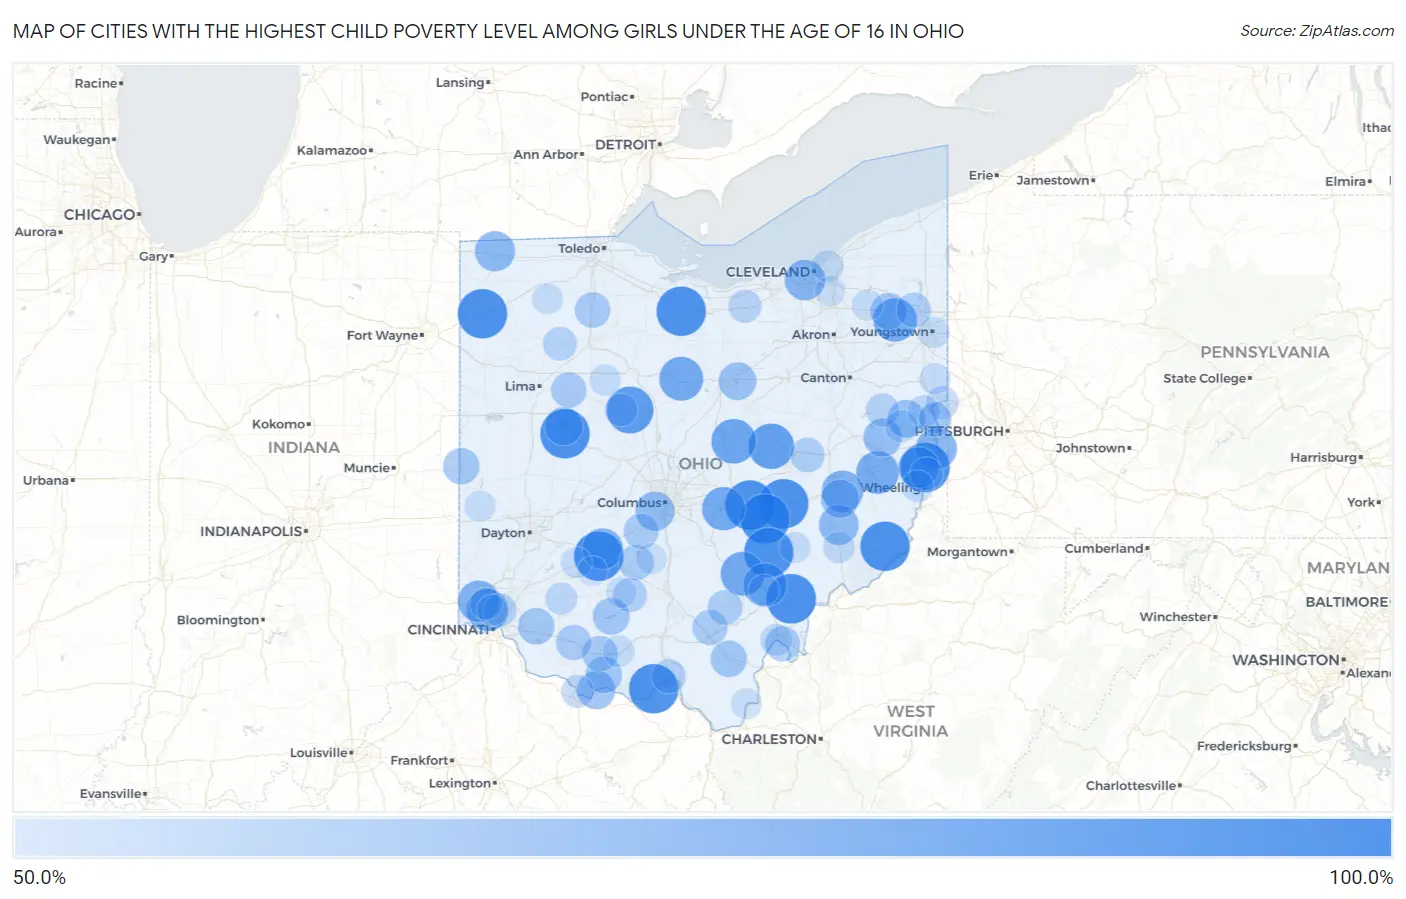
Cities with the Highest Child Poverty Level Among Girls Under the Age of 16 in Ohio
| City | Child Poverty (Girls) | vs State | vs National | |
| 1. | Pleasant Grove | 100.0% | 18.7% (+81.3)#1 | 17.0% (+83.0)#37 |
| 2. | Suffield | 100.0% | 18.7% (+81.3)#2 | 17.0% (+83.0)#52 |
| 3. | Kingsville | 100.0% | 18.7% (+81.3)#3 | 17.0% (+83.0)#112 |
| 4. | Friendship | 100.0% | 18.7% (+81.3)#4 | 17.0% (+83.0)#154 |
| 5. | Ai | 100.0% | 18.7% (+81.3)#5 | 17.0% (+83.0)#163 |
| 6. | Madison Place | 100.0% | 18.7% (+81.3)#6 | 17.0% (+83.0)#165 |
| 7. | Hamburg | 100.0% | 18.7% (+81.3)#7 | 17.0% (+83.0)#218 |
| 8. | Brownsville | 100.0% | 18.7% (+81.3)#8 | 17.0% (+83.0)#223 |
| 9. | Petersburg | 100.0% | 18.7% (+81.3)#9 | 17.0% (+83.0)#234 |
| 10. | Stewart | 100.0% | 18.7% (+81.3)#10 | 17.0% (+83.0)#241 |
| 11. | Flat Rock | 100.0% | 18.7% (+81.3)#11 | 17.0% (+83.0)#265 |
| 12. | Lewistown | 100.0% | 18.7% (+81.3)#13 | 17.0% (+83.0)#439 |
| 13. | East Fultonham | 100.0% | 18.7% (+81.3)#14 | 17.0% (+83.0)#440 |
| 14. | Cecil | 100.0% | 18.7% (+81.3)#15 | 17.0% (+83.0)#457 |
| 15. | Connorville | 100.0% | 18.7% (+81.3)#16 | 17.0% (+83.0)#510 |
| 16. | Milledgeville | 100.0% | 18.7% (+81.3)#17 | 17.0% (+83.0)#546 |
| 17. | Rendville | 100.0% | 18.7% (+81.3)#18 | 17.0% (+83.0)#617 |
| 18. | Antioch | 100.0% | 18.7% (+81.3)#19 | 17.0% (+83.0)#635 |
| 19. | New Bloomington | 93.5% | 18.7% (+74.9)#20 | 17.0% (+76.6)#715 |
| 20. | Nellie | 90.0% | 18.7% (+71.3)#21 | 17.0% (+73.0)#760 |
| 21. | Gambier | 87.5% | 18.7% (+68.8)#22 | 17.0% (+70.5)#817 |
| 22. | North Robinson | 85.7% | 18.7% (+67.0)#23 | 17.0% (+68.7)#857 |
| 23. | Haydenville | 85.1% | 18.7% (+66.4)#24 | 17.0% (+68.1)#876 |
| 24. | Fairfield Beach | 84.6% | 18.7% (+65.9)#25 | 17.0% (+67.6)#886 |
| 25. | Chauncey | 84.6% | 18.7% (+65.9)#26 | 17.0% (+67.6)#887 |
| 26. | South Canal | 84.4% | 18.7% (+65.7)#27 | 17.0% (+67.4)#893 |
| 27. | Holloway | 82.7% | 18.7% (+64.0)#28 | 17.0% (+65.7)#947 |
| 28. | Skyline Acres | 81.1% | 18.7% (+62.4)#29 | 17.0% (+64.1)#990 |
| 29. | Reno Beach | 80.0% | 18.7% (+61.3)#30 | 17.0% (+63.0)#1,019 |
| 30. | Dunlap | 79.7% | 18.7% (+61.0)#31 | 17.0% (+62.7)#1,044 |
| 31. | Old Washington | 79.5% | 18.7% (+60.8)#32 | 17.0% (+62.5)#1,051 |
| 32. | Mingo Junction | 78.9% | 18.7% (+60.3)#33 | 17.0% (+62.0)#1,072 |
| 33. | Dillonvale | 78.0% | 18.7% (+59.4)#34 | 17.0% (+61.1)#1,102 |
| 34. | Jeffersonville | 77.9% | 18.7% (+59.2)#35 | 17.0% (+60.9)#1,108 |
| 35. | Linndale | 76.9% | 18.7% (+58.2)#36 | 17.0% (+59.9)#1,142 |
| 36. | Kunkle | 76.0% | 18.7% (+57.3)#37 | 17.0% (+59.0)#1,169 |
| 37. | Sarahsville | 75.0% | 18.7% (+56.3)#38 | 17.0% (+58.0)#1,230 |
| 38. | Urbancrest | 73.5% | 18.7% (+54.8)#39 | 17.0% (+56.5)#1,280 |
| 39. | Scio | 71.2% | 18.7% (+52.5)#40 | 17.0% (+54.2)#1,405 |
| 40. | Russells Point | 71.0% | 18.7% (+52.3)#41 | 17.0% (+54.0)#1,418 |
| 41. | Lore City | 71.0% | 18.7% (+52.3)#42 | 17.0% (+54.0)#1,420 |
| 42. | South Mount Vernon | 70.9% | 18.7% (+52.2)#43 | 17.0% (+53.9)#1,426 |
| 43. | Manchester | 70.7% | 18.7% (+52.0)#44 | 17.0% (+53.7)#1,433 |
| 44. | Mifflin | 70.0% | 18.7% (+51.3)#45 | 17.0% (+53.0)#1,461 |
| 45. | Bergholz | 69.7% | 18.7% (+51.0)#46 | 17.0% (+52.7)#1,481 |
| 46. | Highland Holiday | 67.6% | 18.7% (+48.9)#47 | 17.0% (+50.7)#1,571 |
| 47. | West Union | 67.1% | 18.7% (+48.4)#48 | 17.0% (+50.1)#1,597 |
| 48. | Windham | 67.0% | 18.7% (+48.4)#49 | 17.0% (+50.1)#1,598 |
| 49. | Owensville | 66.7% | 18.7% (+48.0)#50 | 17.0% (+49.7)#1,615 |
| 50. | Centerville Thurman | 66.7% | 18.7% (+48.0)#51 | 17.0% (+49.7)#1,670 |
| 51. | Union City | 66.4% | 18.7% (+47.7)#52 | 17.0% (+49.5)#1,679 |
| 52. | Seaman | 64.9% | 18.7% (+46.2)#53 | 17.0% (+47.9)#1,756 |
| 53. | Cygnet | 64.5% | 18.7% (+45.8)#54 | 17.0% (+47.5)#1,765 |
| 54. | Sardinia | 64.1% | 18.7% (+45.4)#55 | 17.0% (+47.1)#1,798 |
| 55. | Alger | 64.0% | 18.7% (+45.3)#56 | 17.0% (+47.0)#1,819 |
| 56. | Syracuse | 63.9% | 18.7% (+45.2)#57 | 17.0% (+46.9)#1,823 |
| 57. | New Holland | 63.8% | 18.7% (+45.1)#58 | 17.0% (+46.8)#1,829 |
| 58. | Derby | 63.6% | 18.7% (+45.0)#59 | 17.0% (+46.7)#1,836 |
| 59. | Coalton | 63.6% | 18.7% (+45.0)#60 | 17.0% (+46.7)#1,837 |
| 60. | Mcarthur | 62.8% | 18.7% (+44.1)#61 | 17.0% (+45.8)#1,884 |
| 61. | West Logan | 62.5% | 18.7% (+43.8)#62 | 17.0% (+45.5)#1,904 |
| 62. | Warren | 62.2% | 18.7% (+43.5)#63 | 17.0% (+45.2)#1,933 |
| 63. | West Lafayette | 62.1% | 18.7% (+43.4)#64 | 17.0% (+45.1)#1,941 |
| 64. | Rosemount | 61.0% | 18.7% (+42.3)#65 | 17.0% (+44.0)#2,009 |
| 65. | South Salem | 60.7% | 18.7% (+42.0)#66 | 17.0% (+43.7)#2,032 |
| 66. | Gilboa | 60.3% | 18.7% (+41.7)#67 | 17.0% (+43.4)#2,064 |
| 67. | Carrollton | 59.2% | 18.7% (+40.6)#68 | 17.0% (+42.3)#2,145 |
| 68. | Lockland | 59.0% | 18.7% (+40.3)#69 | 17.0% (+42.0)#2,169 |
| 69. | Empire | 58.3% | 18.7% (+39.7)#70 | 17.0% (+41.4)#2,239 |
| 70. | Kipton | 58.3% | 18.7% (+39.7)#71 | 17.0% (+41.4)#2,241 |
| 71. | Yorkville | 58.0% | 18.7% (+39.3)#72 | 17.0% (+41.0)#2,261 |
| 72. | Aberdeen | 57.5% | 18.7% (+38.8)#73 | 17.0% (+40.5)#2,296 |
| 73. | East Liverpool | 57.5% | 18.7% (+38.8)#74 | 17.0% (+40.5)#2,299 |
| 74. | La Rue | 57.4% | 18.7% (+38.8)#75 | 17.0% (+40.5)#2,300 |
| 75. | Amsterdam | 56.5% | 18.7% (+37.8)#76 | 17.0% (+39.5)#2,379 |
| 76. | Midland | 56.2% | 18.7% (+37.6)#77 | 17.0% (+39.3)#2,395 |
| 77. | Irondale | 56.0% | 18.7% (+37.3)#78 | 17.0% (+39.0)#2,417 |
| 78. | Mount Healthy Heights | 55.9% | 18.7% (+37.2)#79 | 17.0% (+38.9)#2,441 |
| 79. | Pomeroy | 55.8% | 18.7% (+37.1)#80 | 17.0% (+38.8)#2,452 |
| 80. | Wolfhurst | 55.6% | 18.7% (+36.9)#81 | 17.0% (+38.6)#2,462 |
| 81. | Stratton | 55.6% | 18.7% (+36.9)#82 | 17.0% (+38.6)#2,474 |
| 82. | East Cleveland | 55.4% | 18.7% (+36.7)#83 | 17.0% (+38.4)#2,493 |
| 83. | Dexter City | 55.0% | 18.7% (+36.3)#84 | 17.0% (+38.0)#2,526 |
| 84. | Peebles | 54.8% | 18.7% (+36.1)#85 | 17.0% (+37.8)#2,545 |
| 85. | Patterson | 54.5% | 18.7% (+35.9)#86 | 17.0% (+37.6)#2,566 |
| 86. | Mantua | 53.8% | 18.7% (+35.2)#87 | 17.0% (+36.9)#2,627 |
| 87. | Rogers | 53.8% | 18.7% (+35.2)#88 | 17.0% (+36.9)#2,638 |
| 88. | Castine | 53.8% | 18.7% (+35.2)#89 | 17.0% (+36.9)#2,642 |
| 89. | Oakwood Village Paulding County | 53.4% | 18.7% (+34.8)#90 | 17.0% (+36.5)#2,676 |
| 90. | Youngstown | 53.4% | 18.7% (+34.7)#91 | 17.0% (+36.4)#2,678 |
| 91. | Malta | 53.3% | 18.7% (+34.7)#92 | 17.0% (+36.4)#2,683 |
| 92. | Malinta | 53.3% | 18.7% (+34.7)#93 | 17.0% (+36.4)#2,688 |
| 93. | Port William | 53.3% | 18.7% (+34.7)#94 | 17.0% (+36.4)#2,689 |
| 94. | Williamsport | 53.1% | 18.7% (+34.4)#95 | 17.0% (+36.1)#2,722 |
| 95. | Crown City | 53.0% | 18.7% (+34.3)#96 | 17.0% (+36.0)#2,728 |
| 96. | Greenfield | 52.9% | 18.7% (+34.2)#97 | 17.0% (+36.0)#2,745 |
| 97. | Pleasant Hills | 52.8% | 18.7% (+34.1)#98 | 17.0% (+35.8)#2,757 |
| 98. | The Plains | 52.6% | 18.7% (+34.0)#99 | 17.0% (+35.7)#2,770 |
| 99. | Walton Hills | 51.5% | 18.7% (+32.8)#100 | 17.0% (+34.5)#2,874 |
| 100. | Sabina | 51.2% | 18.7% (+32.6)#101 | 17.0% (+34.3)#2,900 |
Common Questions
What are the Top 10 Cities with the Highest Child Poverty Level Among Girls Under the Age of 16 in Ohio?
Top 10 Cities with the Highest Child Poverty Level Among Girls Under the Age of 16 in Ohio are:
#1
100.0%
#2
100.0%
#3
100.0%
#4
100.0%
#5
100.0%
#6
100.0%
#7
100.0%
#8
100.0%
#9
100.0%
#10
100.0%
What city has the Highest Child Poverty Level Among Girls Under the Age of 16 in Ohio?
Pleasant Grove has the Highest Child Poverty Level Among Girls Under the Age of 16 in Ohio with 100.0%.
What is the Poverty Level Among Girls Under the Age of 16 in the State of Ohio?
Poverty Level Among Girls Under the Age of 16 in Ohio is 18.7%.
What is the Poverty Level Among Girls Under the Age of 16 in the United States?
Poverty Level Among Girls Under the Age of 16 in the United States is 17.0%.