Cities with the Highest Child Poverty Level Among Girls Under the Age of 16 in Indiana
RELATED REPORTS & OPTIONS
Highest Poverty | Girls 0-16
Indiana
Compare Cities
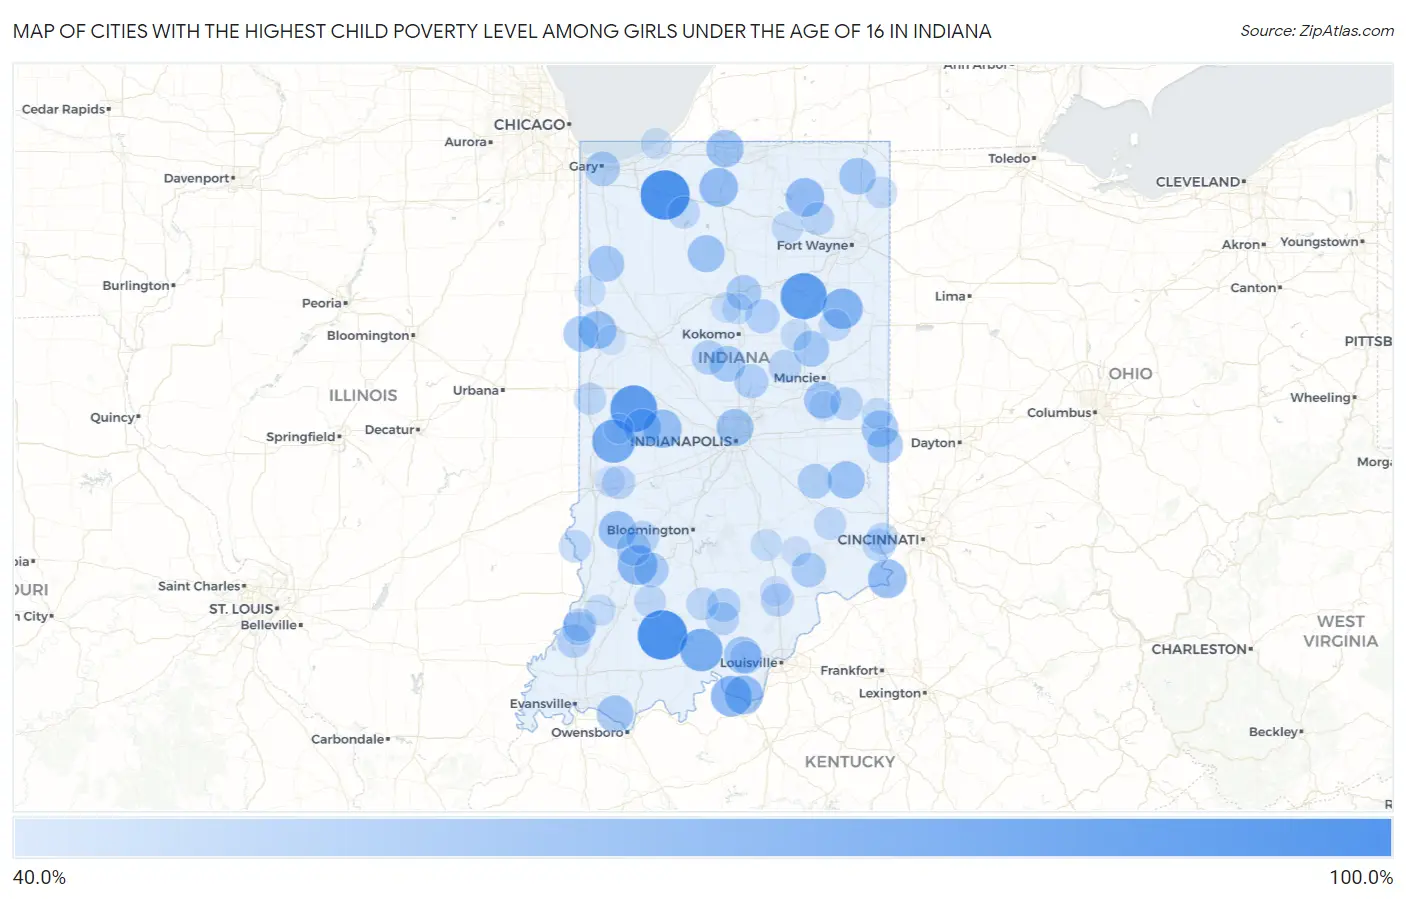
Map of Cities with the Highest Child Poverty Level Among Girls Under the Age of 16 in Indiana
0.0%
100.0%
Cities with the Highest Child Poverty Level Among Girls Under the Age of 16 in Indiana
| City | Child Poverty (Girls) | vs State | vs National | |
| 1. | Lewis | 100.0% | 16.6%(+83.4)#1 | 17.0%(+83.0)#145 |
| 2. | Hanna | 100.0% | 16.6%(+83.4)#2 | 17.0%(+83.0)#161 |
| 3. | Dubois | 100.0% | 16.6%(+83.4)#3 | 17.0%(+83.0)#209 |
| 4. | Prairie Creek | 100.0% | 16.6%(+83.4)#4 | 17.0%(+83.0)#288 |
| 5. | Abington | 100.0% | 16.6%(+83.4)#5 | 17.0%(+83.0)#293 |
| 6. | Burnett | 100.0% | 16.6%(+83.4)#6 | 17.0%(+83.0)#350 |
| 7. | Millville | 100.0% | 16.6%(+83.4)#7 | 17.0%(+83.0)#363 |
| 8. | Adams | 100.0% | 16.6%(+83.4)#8 | 17.0%(+83.0)#367 |
| 9. | Alford | 100.0% | 16.6%(+83.4)#9 | 17.0%(+83.0)#374 |
| 10. | Deer Creek | 100.0% | 16.6%(+83.4)#10 | 17.0%(+83.0)#396 |
| 11. | Pence | 100.0% | 16.6%(+83.4)#11 | 17.0%(+83.0)#400 |
| 12. | Eugene | 100.0% | 16.6%(+83.4)#12 | 17.0%(+83.0)#405 |
| 13. | Billtown | 100.0% | 16.6%(+83.4)#13 | 17.0%(+83.0)#430 |
| 14. | Grayford | 100.0% | 16.6%(+83.4)#14 | 17.0%(+83.0)#470 |
| 15. | Linn Grove | 100.0% | 16.6%(+83.4)#15 | 17.0%(+83.0)#490 |
| 16. | Otisco | 100.0% | 16.6%(+83.4)#16 | 17.0%(+83.0)#496 |
| 17. | Pleasantville | 100.0% | 16.6%(+83.4)#17 | 17.0%(+83.0)#566 |
| 18. | Lake Holiday Hideaway | 95.0% | 16.6%(+78.4)#18 | 17.0%(+78.0)#701 |
| 19. | Alamo | 91.7% | 16.6%(+75.1)#19 | 17.0%(+74.7)#734 |
| 20. | Mount Etna | 90.0% | 16.6%(+73.4)#20 | 17.0%(+73.0)#762 |
| 21. | Rockville | 80.3% | 16.6%(+63.8)#21 | 17.0%(+63.4)#1,010 |
| 22. | English | 78.7% | 16.6%(+62.1)#22 | 17.0%(+61.7)#1,084 |
| 23. | Mauckport | 72.7% | 16.6%(+56.2)#23 | 17.0%(+55.8)#1,332 |
| 24. | Poneto | 72.2% | 16.6%(+55.7)#24 | 17.0%(+55.2)#1,352 |
| 25. | Newberry | 69.2% | 16.6%(+52.7)#25 | 17.0%(+52.3)#1,504 |
| 26. | La Paz | 66.7% | 16.6%(+50.1)#26 | 17.0%(+49.7)#1,621 |
| 27. | Patriot | 66.7% | 16.6%(+50.1)#27 | 17.0%(+49.7)#1,636 |
| 28. | Coal | 66.7% | 16.6%(+50.1)#28 | 17.0%(+49.7)#1,661 |
| 29. | Laconia | 66.7% | 16.6%(+50.1)#29 | 17.0%(+49.7)#1,665 |
| 30. | Kimmell | 66.3% | 16.6%(+49.7)#30 | 17.0%(+49.3)#1,687 |
| 31. | Roachdale | 65.9% | 16.6%(+49.3)#31 | 17.0%(+48.9)#1,706 |
| 32. | Thayer | 64.3% | 16.6%(+47.7)#32 | 17.0%(+47.3)#1,780 |
| 33. | Boswell | 64.0% | 16.6%(+47.5)#33 | 17.0%(+47.1)#1,806 |
| 34. | Jasonville | 63.8% | 16.6%(+47.3)#34 | 17.0%(+46.9)#1,826 |
| 35. | Roseland | 62.9% | 16.6%(+46.3)#35 | 17.0%(+45.9)#1,876 |
| 36. | Laurel | 62.6% | 16.6%(+46.1)#36 | 17.0%(+45.6)#1,893 |
| 37. | Russellville | 62.3% | 16.6%(+45.8)#37 | 17.0%(+45.3)#1,926 |
| 38. | Williamsburg | 61.6% | 16.6%(+45.1)#38 | 17.0%(+44.7)#1,970 |
| 39. | Kewanna | 61.5% | 16.6%(+45.0)#39 | 17.0%(+44.6)#1,977 |
| 40. | Crows Nest | 61.5% | 16.6%(+45.0)#40 | 17.0%(+44.6)#1,987 |
| 41. | New Salisbury | 61.2% | 16.6%(+44.6)#41 | 17.0%(+44.2)#1,999 |
| 42. | Springport | 61.1% | 16.6%(+44.6)#42 | 17.0%(+44.1)#2,007 |
| 43. | Hatfield | 60.7% | 16.6%(+44.2)#43 | 17.0%(+43.7)#2,029 |
| 44. | Hudson | 60.5% | 16.6%(+43.9)#44 | 17.0%(+43.5)#2,045 |
| 45. | Spring Grove | 60.5% | 16.6%(+43.9)#45 | 17.0%(+43.5)#2,051 |
| 46. | Matthews | 58.3% | 16.6%(+41.8)#46 | 17.0%(+41.4)#2,231 |
| 47. | Boston | 58.3% | 16.6%(+41.8)#47 | 17.0%(+41.4)#2,240 |
| 48. | Mount Ayr | 58.3% | 16.6%(+41.8)#48 | 17.0%(+41.4)#2,244 |
| 49. | Kempton | 58.1% | 16.6%(+41.5)#49 | 17.0%(+41.1)#2,260 |
| 50. | Ambia | 57.6% | 16.6%(+41.0)#50 | 17.0%(+40.6)#2,286 |
| 51. | Peru | 55.4% | 16.6%(+38.9)#51 | 17.0%(+38.5)#2,486 |
| 52. | Crane | 55.0% | 16.6%(+38.4)#52 | 17.0%(+38.0)#2,522 |
| 53. | Milroy | 54.5% | 16.6%(+38.0)#53 | 17.0%(+37.6)#2,557 |
| 54. | Dupont | 54.5% | 16.6%(+38.0)#54 | 17.0%(+37.6)#2,562 |
| 55. | Gary | 54.5% | 16.6%(+38.0)#55 | 17.0%(+37.5)#2,573 |
| 56. | Leiters Ford | 53.6% | 16.6%(+37.0)#56 | 17.0%(+36.6)#2,669 |
| 57. | Michigantown | 53.3% | 16.6%(+36.8)#57 | 17.0%(+36.4)#2,684 |
| 58. | Arcadia | 52.9% | 16.6%(+36.4)#58 | 17.0%(+36.0)#2,732 |
| 59. | Amboy | 52.9% | 16.6%(+36.4)#59 | 17.0%(+36.0)#2,742 |
| 60. | Switz City | 52.9% | 16.6%(+36.4)#60 | 17.0%(+36.0)#2,744 |
| 61. | Pittsburg | 52.4% | 16.6%(+35.8)#61 | 17.0%(+35.4)#2,802 |
| 62. | Campbellsburg | 51.6% | 16.6%(+35.0)#62 | 17.0%(+34.6)#2,869 |
| 63. | Patoka | 50.9% | 16.6%(+34.4)#63 | 17.0%(+34.0)#2,925 |
| 64. | Scottsburg | 50.2% | 16.6%(+33.6)#64 | 17.0%(+33.2)#2,979 |
| 65. | Worthington | 50.0% | 16.6%(+33.4)#65 | 17.0%(+33.0)#2,993 |
| 66. | Tri Lakes | 50.0% | 16.6%(+33.4)#66 | 17.0%(+33.0)#2,995 |
| 67. | Orestes | 50.0% | 16.6%(+33.4)#67 | 17.0%(+33.0)#3,033 |
| 68. | Staunton | 50.0% | 16.6%(+33.4)#68 | 17.0%(+33.0)#3,050 |
| 69. | Losantville | 50.0% | 16.6%(+33.4)#69 | 17.0%(+33.0)#3,056 |
| 70. | Hazleton | 50.0% | 16.6%(+33.4)#70 | 17.0%(+33.0)#3,062 |
| 71. | Decker | 50.0% | 16.6%(+33.4)#71 | 17.0%(+33.0)#3,077 |
| 72. | Livonia | 50.0% | 16.6%(+33.4)#72 | 17.0%(+33.0)#3,118 |
| 73. | Crandall | 48.7% | 16.6%(+32.2)#73 | 17.0%(+31.7)#3,207 |
| 74. | Aurora | 48.2% | 16.6%(+31.6)#74 | 17.0%(+31.2)#3,270 |
| 75. | Orleans | 48.1% | 16.6%(+31.5)#75 | 17.0%(+31.1)#3,291 |
| 76. | Merom | 48.0% | 16.6%(+31.4)#76 | 17.0%(+31.0)#3,300 |
| 77. | Perrysville | 47.4% | 16.6%(+30.8)#77 | 17.0%(+30.4)#3,366 |
| 78. | Napoleon | 47.4% | 16.6%(+30.8)#78 | 17.0%(+30.4)#3,369 |
| 79. | Knox | 47.4% | 16.6%(+30.8)#79 | 17.0%(+30.4)#3,373 |
| 80. | Lawrenceburg | 47.2% | 16.6%(+30.7)#80 | 17.0%(+30.3)#3,392 |
| 81. | Loogootee | 46.9% | 16.6%(+30.3)#81 | 17.0%(+29.9)#3,437 |
| 82. | Montpelier | 46.8% | 16.6%(+30.2)#82 | 17.0%(+29.8)#3,451 |
| 83. | Pierceton | 46.2% | 16.6%(+29.6)#83 | 17.0%(+29.2)#3,530 |
| 84. | Butler | 45.9% | 16.6%(+29.4)#84 | 17.0%(+28.9)#3,570 |
| 85. | Schnellville | 45.6% | 16.6%(+29.1)#85 | 17.0%(+28.6)#3,611 |
| 86. | Fountain City | 45.5% | 16.6%(+28.9)#86 | 17.0%(+28.5)#3,623 |
| 87. | Jonesville | 45.5% | 16.6%(+28.9)#87 | 17.0%(+28.5)#3,639 |
| 88. | Jonesboro | 44.9% | 16.6%(+28.3)#88 | 17.0%(+27.9)#3,699 |
| 89. | Monroe City | 44.7% | 16.6%(+28.2)#89 | 17.0%(+27.7)#3,727 |
| 90. | Long Beach | 44.4% | 16.6%(+27.9)#90 | 17.0%(+27.5)#3,754 |
| 91. | Kentland | 44.0% | 16.6%(+27.5)#91 | 17.0%(+27.0)#3,825 |
| 92. | Grissom Afb | 43.9% | 16.6%(+27.3)#92 | 17.0%(+26.9)#3,844 |
| 93. | Walton | 42.9% | 16.6%(+26.3)#93 | 17.0%(+25.9)#3,996 |
| 94. | Austin | 42.2% | 16.6%(+25.7)#94 | 17.0%(+25.2)#4,101 |
| 95. | North Vernon | 42.0% | 16.6%(+25.5)#95 | 17.0%(+25.1)#4,129 |
| 96. | Servia | 42.0% | 16.6%(+25.4)#96 | 17.0%(+25.0)#4,132 |
| 97. | Seelyville | 41.9% | 16.6%(+25.4)#97 | 17.0%(+25.0)#4,138 |
| 98. | Pine Village | 41.4% | 16.6%(+24.8)#98 | 17.0%(+24.4)#4,220 |
| 99. | Mount Summit | 41.3% | 16.6%(+24.7)#99 | 17.0%(+24.3)#4,230 |
| 100. | Marshall | 41.2% | 16.6%(+24.6)#100 | 17.0%(+24.2)#4,251 |
Common Questions
What are the Top 10 Cities with the Highest Child Poverty Level Among Girls Under the Age of 16 in Indiana?
Top 10 Cities with the Highest Child Poverty Level Among Girls Under the Age of 16 in Indiana are:
What city has the Highest Child Poverty Level Among Girls Under the Age of 16 in Indiana?
Hanna has the Highest Child Poverty Level Among Girls Under the Age of 16 in Indiana with 100.0%.
What is the Poverty Level Among Girls Under the Age of 16 in the State of Indiana?
Poverty Level Among Girls Under the Age of 16 in Indiana is 16.6%.
What is the Poverty Level Among Girls Under the Age of 16 in the United States?
Poverty Level Among Girls Under the Age of 16 in the United States is 17.0%.