Cities with the Highest Child Poverty Level Among Girls Under the Age of 16 in Idaho
RELATED REPORTS & OPTIONS
Highest Poverty | Girls 0-16
Idaho
Compare Cities
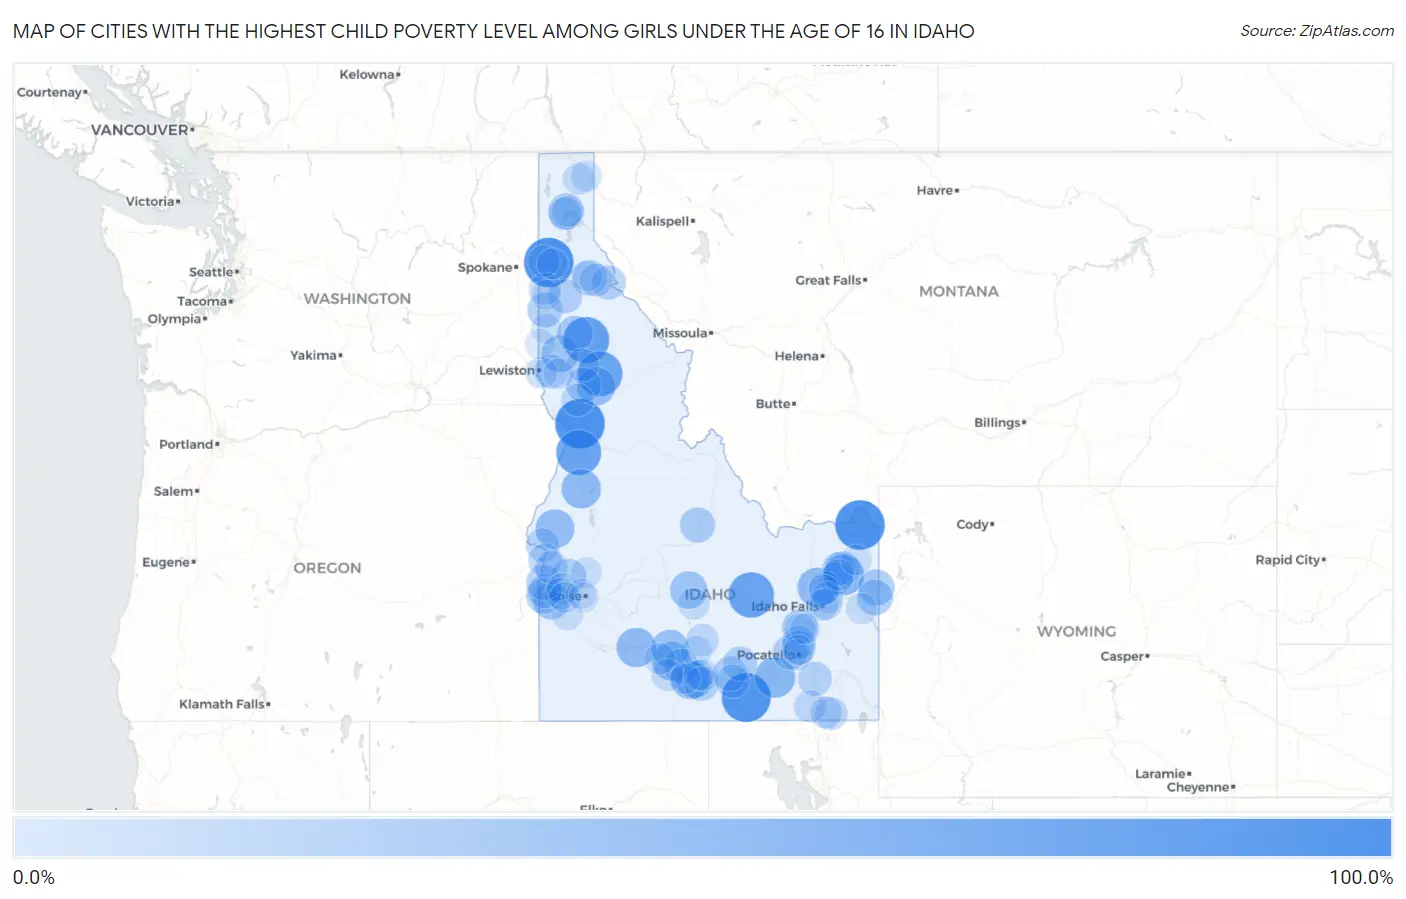
Map of Cities with the Highest Child Poverty Level Among Girls Under the Age of 16 in Idaho
0.0%
100.0%
Cities with the Highest Child Poverty Level Among Girls Under the Age of 16 in Idaho
| City | Child Poverty (Girls) | vs State | vs National | |
| 1. | Huetter | 100.0% | 12.8%(+87.2)#1 | 17.0%(+83.0)#404 |
| 2. | Island Park | 100.0% | 12.8%(+87.2)#2 | 17.0%(+83.0)#438 |
| 3. | White Bird | 100.0% | 12.8%(+87.2)#3 | 17.0%(+83.0)#627 |
| 4. | Malta | 97.6% | 12.8%(+84.8)#4 | 17.0%(+80.7)#689 |
| 5. | Elk River | 83.3% | 12.8%(+70.5)#5 | 17.0%(+66.4)#926 |
| 6. | Arco | 81.3% | 12.8%(+68.5)#6 | 17.0%(+64.4)#985 |
| 7. | Weippe | 78.6% | 12.8%(+65.8)#7 | 17.0%(+61.6)#1,085 |
| 8. | Riggins | 78.6% | 12.8%(+65.8)#8 | 17.0%(+61.6)#1,088 |
| 9. | Teton | 58.8% | 12.8%(+46.0)#9 | 17.0%(+41.8)#2,192 |
| 10. | Rockland | 57.7% | 12.8%(+44.9)#10 | 17.0%(+40.7)#2,277 |
| 11. | Roberts | 54.5% | 12.8%(+41.7)#11 | 17.0%(+37.6)#2,559 |
| 12. | Glenns Ferry | 53.1% | 12.8%(+40.3)#12 | 17.0%(+36.1)#2,721 |
| 13. | New Meadows | 52.6% | 12.8%(+39.8)#13 | 17.0%(+35.7)#2,776 |
| 14. | Midvale | 50.0% | 12.8%(+37.2)#14 | 17.0%(+33.0)#3,045 |
| 15. | Wendell | 48.4% | 12.8%(+35.6)#15 | 17.0%(+31.5)#3,236 |
| 16. | Kamiah | 48.4% | 12.8%(+35.6)#16 | 17.0%(+31.4)#3,244 |
| 17. | Kimberly | 47.0% | 12.8%(+34.2)#17 | 17.0%(+30.1)#3,417 |
| 18. | Gooding | 45.7% | 12.8%(+32.9)#18 | 17.0%(+28.8)#3,597 |
| 19. | Ketchum | 43.9% | 12.8%(+31.1)#19 | 17.0%(+26.9)#3,833 |
| 20. | Kendrick | 41.7% | 12.8%(+28.9)#20 | 17.0%(+24.7)#4,178 |
| 21. | Marsing | 39.6% | 12.8%(+26.8)#21 | 17.0%(+22.6)#4,550 |
| 22. | Hansen | 39.5% | 12.8%(+26.7)#22 | 17.0%(+22.5)#4,576 |
| 23. | Driggs | 37.4% | 12.8%(+24.6)#23 | 17.0%(+20.4)#4,948 |
| 24. | Laclede | 37.0% | 12.8%(+24.2)#24 | 17.0%(+20.1)#5,029 |
| 25. | Moreland | 36.5% | 12.8%(+23.7)#25 | 17.0%(+19.5)#5,135 |
| 26. | Ponderay | 36.1% | 12.8%(+23.3)#26 | 17.0%(+19.2)#5,230 |
| 27. | Bovill | 36.0% | 12.8%(+23.2)#27 | 17.0%(+19.0)#5,257 |
| 28. | Victor | 35.9% | 12.8%(+23.1)#28 | 17.0%(+19.0)#5,265 |
| 29. | Kellogg | 34.4% | 12.8%(+21.6)#29 | 17.0%(+17.4)#5,576 |
| 30. | Challis | 33.3% | 12.8%(+20.5)#30 | 17.0%(+16.4)#5,812 |
| 31. | De Smet | 33.3% | 12.8%(+20.5)#31 | 17.0%(+16.4)#5,903 |
| 32. | Homedale | 33.0% | 12.8%(+20.2)#32 | 17.0%(+16.0)#5,977 |
| 33. | Parma | 32.9% | 12.8%(+20.1)#33 | 17.0%(+15.9)#5,997 |
| 34. | Jerome | 32.8% | 12.8%(+20.0)#34 | 17.0%(+15.8)#6,018 |
| 35. | Nezperce | 32.5% | 12.8%(+19.7)#35 | 17.0%(+15.6)#6,081 |
| 36. | St Anthony | 32.4% | 12.8%(+19.6)#36 | 17.0%(+15.4)#6,105 |
| 37. | Emmett | 31.5% | 12.8%(+18.7)#37 | 17.0%(+14.5)#6,320 |
| 38. | Murtaugh | 30.8% | 12.8%(+18.0)#38 | 17.0%(+13.8)#6,502 |
| 39. | Arbon Valley | 30.1% | 12.8%(+17.3)#39 | 17.0%(+13.1)#6,654 |
| 40. | Rupert | 30.1% | 12.8%(+17.3)#40 | 17.0%(+13.1)#6,663 |
| 41. | Minidoka | 30.0% | 12.8%(+17.2)#41 | 17.0%(+13.0)#6,706 |
| 42. | St Maries | 29.1% | 12.8%(+16.3)#42 | 17.0%(+12.1)#6,917 |
| 43. | Mullan | 29.1% | 12.8%(+16.3)#43 | 17.0%(+12.1)#6,935 |
| 44. | Wilder | 28.4% | 12.8%(+15.6)#44 | 17.0%(+11.4)#7,106 |
| 45. | Arimo | 27.6% | 12.8%(+14.8)#45 | 17.0%(+10.6)#7,316 |
| 46. | Lapwai | 27.4% | 12.8%(+14.6)#46 | 17.0%(+10.4)#7,360 |
| 47. | Tyhee | 27.0% | 12.8%(+14.2)#47 | 17.0%(+10.1)#7,472 |
| 48. | Fort Hall | 26.7% | 12.8%(+13.9)#48 | 17.0%(+9.74)#7,563 |
| 49. | Declo | 26.6% | 12.8%(+13.8)#49 | 17.0%(+9.61)#7,617 |
| 50. | Weiser | 25.6% | 12.8%(+12.8)#50 | 17.0%(+8.66)#7,928 |
| 51. | Payette | 25.6% | 12.8%(+12.8)#51 | 17.0%(+8.62)#7,941 |
| 52. | Rexburg | 25.2% | 12.8%(+12.4)#52 | 17.0%(+8.20)#8,039 |
| 53. | New Plymouth | 24.4% | 12.8%(+11.6)#53 | 17.0%(+7.43)#8,328 |
| 54. | Parker | 24.1% | 12.8%(+11.3)#54 | 17.0%(+7.10)#8,407 |
| 55. | Orofino | 23.6% | 12.8%(+10.8)#55 | 17.0%(+6.64)#8,554 |
| 56. | Osburn | 23.5% | 12.8%(+10.7)#56 | 17.0%(+6.48)#8,621 |
| 57. | Sandpoint | 22.6% | 12.8%(+9.84)#57 | 17.0%(+5.67)#8,898 |
| 58. | Preston | 22.3% | 12.8%(+9.50)#58 | 17.0%(+5.33)#9,007 |
| 59. | Worley | 21.6% | 12.8%(+8.82)#59 | 17.0%(+4.65)#9,253 |
| 60. | Cottonwood | 21.4% | 12.8%(+8.63)#60 | 17.0%(+4.45)#9,317 |
| 61. | Menan | 21.4% | 12.8%(+8.63)#61 | 17.0%(+4.45)#9,322 |
| 62. | Richfield | 21.4% | 12.8%(+8.63)#62 | 17.0%(+4.45)#9,328 |
| 63. | Malad City | 20.9% | 12.8%(+8.10)#63 | 17.0%(+3.93)#9,518 |
| 64. | Lincoln | 19.7% | 12.8%(+6.93)#64 | 17.0%(+2.76)#9,974 |
| 65. | Dayton | 19.5% | 12.8%(+6.71)#65 | 17.0%(+2.54)#10,055 |
| 66. | Post Falls | 18.3% | 12.8%(+5.48)#66 | 17.0%(+1.31)#10,515 |
| 67. | Hazelton | 18.1% | 12.8%(+5.28)#67 | 17.0%(+1.11)#10,615 |
| 68. | Bonners Ferry | 18.0% | 12.8%(+5.17)#68 | 17.0%(+0.996)#10,652 |
| 69. | Buhl | 17.9% | 12.8%(+5.15)#69 | 17.0%(+0.973)#10,657 |
| 70. | Lewiston | 17.8% | 12.8%(+4.99)#70 | 17.0%(+0.814)#10,722 |
| 71. | Hailey | 17.3% | 12.8%(+4.51)#71 | 17.0%(+0.341)#10,899 |
| 72. | Ucon | 17.3% | 12.8%(+4.46)#72 | 17.0%(+0.286)#10,925 |
| 73. | Sugar City | 16.8% | 12.8%(+4.02)#73 | 17.0%(-0.151)#11,115 |
| 74. | Idaho Falls | 16.7% | 12.8%(+3.88)#74 | 17.0%(-0.297)#11,157 |
| 75. | Dietrich | 16.3% | 12.8%(+3.48)#75 | 17.0%(-0.697)#11,357 |
| 76. | Caldwell | 16.2% | 12.8%(+3.42)#76 | 17.0%(-0.757)#11,380 |
| 77. | Middleton | 16.2% | 12.8%(+3.39)#77 | 17.0%(-0.787)#11,396 |
| 78. | Kootenai | 16.1% | 12.8%(+3.33)#78 | 17.0%(-0.847)#11,421 |
| 79. | Swan Valley | 16.1% | 12.8%(+3.33)#79 | 17.0%(-0.847)#11,434 |
| 80. | Moyie Springs | 16.1% | 12.8%(+3.30)#80 | 17.0%(-0.869)#11,441 |
| 81. | Riverside | 15.5% | 12.8%(+2.69)#81 | 17.0%(-1.48)#11,706 |
| 82. | Pocatello | 15.3% | 12.8%(+2.54)#82 | 17.0%(-1.63)#11,795 |
| 83. | Hagerman | 15.1% | 12.8%(+2.32)#83 | 17.0%(-1.85)#11,897 |
| 84. | Melba | 14.6% | 12.8%(+1.83)#84 | 17.0%(-2.34)#12,122 |
| 85. | Nampa | 14.4% | 12.8%(+1.63)#85 | 17.0%(-2.55)#12,201 |
| 86. | Lewisville | 14.3% | 12.8%(+1.48)#86 | 17.0%(-2.69)#12,284 |
| 87. | Ashton | 14.2% | 12.8%(+1.38)#87 | 17.0%(-2.80)#12,350 |
| 88. | Coeur D Alene | 13.8% | 12.8%(+0.972)#88 | 17.0%(-3.20)#12,528 |
| 89. | Horseshoe Bend | 13.7% | 12.8%(+0.896)#89 | 17.0%(-3.28)#12,558 |
| 90. | Twin Falls | 13.5% | 12.8%(+0.738)#90 | 17.0%(-3.43)#12,647 |
| 91. | Chubbuck | 13.4% | 12.8%(+0.563)#91 | 17.0%(-3.61)#12,713 |
| 92. | Culdesac | 12.9% | 12.8%(+0.101)#92 | 17.0%(-4.07)#12,936 |
| 93. | Potlatch | 12.9% | 12.8%(+0.054)#93 | 17.0%(-4.12)#12,954 |
| 94. | Eden | 12.9% | 12.8%(+0.054)#94 | 17.0%(-4.12)#12,956 |
| 95. | Blackfoot | 11.5% | 12.8%(-1.26)#95 | 17.0%(-5.43)#13,594 |
| 96. | Moscow | 11.5% | 12.8%(-1.33)#96 | 17.0%(-5.50)#13,638 |
| 97. | Boise City | 11.5% | 12.8%(-1.34)#97 | 17.0%(-5.51)#13,643 |
| 98. | Garden City | 11.5% | 12.8%(-1.35)#98 | 17.0%(-5.53)#13,649 |
| 99. | Plummer | 11.1% | 12.8%(-1.69)#99 | 17.0%(-5.86)#13,805 |
| 100. | Smelterville | 11.1% | 12.8%(-1.69)#100 | 17.0%(-5.86)#13,816 |
Common Questions
What are the Top 10 Cities with the Highest Child Poverty Level Among Girls Under the Age of 16 in Idaho?
Top 10 Cities with the Highest Child Poverty Level Among Girls Under the Age of 16 in Idaho are:
#1
100.0%
#2
100.0%
#3
100.0%
#4
97.6%
#5
83.3%
#6
81.3%
#7
78.6%
#8
78.6%
#9
58.8%
#10
57.7%
What city has the Highest Child Poverty Level Among Girls Under the Age of 16 in Idaho?
Huetter has the Highest Child Poverty Level Among Girls Under the Age of 16 in Idaho with 100.0%.
What is the Poverty Level Among Girls Under the Age of 16 in the State of Idaho?
Poverty Level Among Girls Under the Age of 16 in Idaho is 12.8%.
What is the Poverty Level Among Girls Under the Age of 16 in the United States?
Poverty Level Among Girls Under the Age of 16 in the United States is 17.0%.