Cities with the Highest Child Poverty Level Among Girls Under the Age of 16 in Pennsylvania
RELATED REPORTS & OPTIONS
Highest Poverty | Girls 0-16
Pennsylvania
Compare Cities
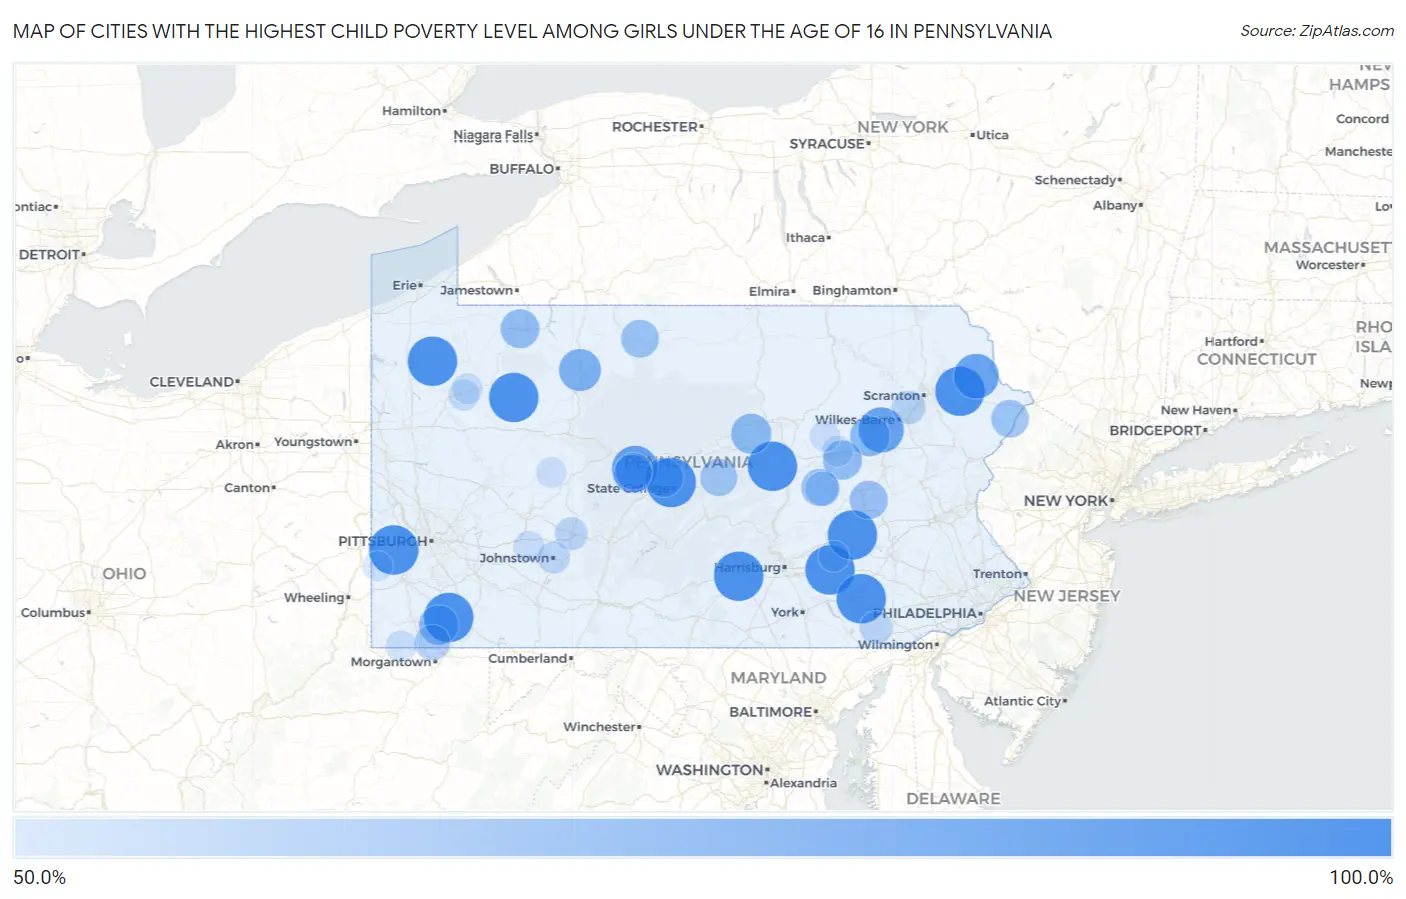
Map of Cities with the Highest Child Poverty Level Among Girls Under the Age of 16 in Pennsylvania
0.0%
100.0%
Cities with the Highest Child Poverty Level Among Girls Under the Age of 16 in Pennsylvania
| City | Child Poverty (Girls) | vs State | vs National | |
| 1. | Toftrees | 100.0% | 16.5%(+83.5)#1 | 17.0%(+83.0)#11 |
| 2. | The Hideout | 100.0% | 16.5%(+83.5)#2 | 17.0%(+83.0)#13 |
| 3. | Timber Hills | 100.0% | 16.5%(+83.5)#3 | 17.0%(+83.0)#178 |
| 4. | Bulger | 100.0% | 16.5%(+83.5)#4 | 17.0%(+83.0)#246 |
| 5. | Bethel | 100.0% | 16.5%(+83.5)#5 | 17.0%(+83.0)#250 |
| 6. | East Altoona | 100.0% | 16.5%(+83.5)#6 | 17.0%(+83.0)#256 |
| 7. | Aaronsburg Cdp Washington County | 100.0% | 16.5%(+83.5)#7 | 17.0%(+83.0)#268 |
| 8. | Witmer | 100.0% | 16.5%(+83.5)#8 | 17.0%(+83.0)#302 |
| 9. | Plainfield | 100.0% | 16.5%(+83.5)#9 | 17.0%(+83.0)#306 |
| 10. | Crown | 100.0% | 16.5%(+83.5)#10 | 17.0%(+83.0)#320 |
| 11. | Cove Forge | 100.0% | 16.5%(+83.5)#11 | 17.0%(+83.0)#325 |
| 12. | Alverda | 100.0% | 16.5%(+83.5)#12 | 17.0%(+83.0)#390 |
| 13. | Charlottsville | 100.0% | 16.5%(+83.5)#13 | 17.0%(+83.0)#395 |
| 14. | Friendsville Borough | 100.0% | 16.5%(+83.5)#14 | 17.0%(+83.0)#399 |
| 15. | Vicksburg | 100.0% | 16.5%(+83.5)#15 | 17.0%(+83.0)#403 |
| 16. | Roseville Borough | 100.0% | 16.5%(+83.5)#16 | 17.0%(+83.0)#418 |
| 17. | Benson Borough | 100.0% | 16.5%(+83.5)#17 | 17.0%(+83.0)#453 |
| 18. | Buffington | 100.0% | 16.5%(+83.5)#18 | 17.0%(+83.0)#483 |
| 19. | Guys Mills | 100.0% | 16.5%(+83.5)#19 | 17.0%(+83.0)#485 |
| 20. | Eagles Mere Borough | 100.0% | 16.5%(+83.5)#20 | 17.0%(+83.0)#523 |
| 21. | St. Clair | 100.0% | 16.5%(+83.5)#21 | 17.0%(+83.0)#621 |
| 22. | Coalmont Borough | 100.0% | 16.5%(+83.5)#22 | 17.0%(+83.0)#636 |
| 23. | Hawk Run | 91.3% | 16.5%(+74.8)#23 | 17.0%(+74.3)#739 |
| 24. | Wanamie | 89.8% | 16.5%(+73.3)#24 | 17.0%(+72.8)#766 |
| 25. | White Mills | 89.1% | 16.5%(+72.6)#25 | 17.0%(+72.2)#779 |
| 26. | Dale Borough | 85.5% | 16.5%(+69.0)#26 | 17.0%(+68.5)#869 |
| 27. | Elco Borough | 84.2% | 16.5%(+67.7)#27 | 17.0%(+67.2)#899 |
| 28. | Ehrenfeld Borough | 84.2% | 16.5%(+67.7)#28 | 17.0%(+67.2)#900 |
| 29. | Rainsburg Borough | 82.9% | 16.5%(+66.4)#29 | 17.0%(+65.9)#943 |
| 30. | East Conemaugh Borough | 82.5% | 16.5%(+66.0)#30 | 17.0%(+65.5)#953 |
| 31. | Atwood Borough | 82.4% | 16.5%(+65.9)#31 | 17.0%(+65.4)#954 |
| 32. | Wilcox | 81.8% | 16.5%(+65.3)#32 | 17.0%(+64.8)#968 |
| 33. | Oval | 77.3% | 16.5%(+60.8)#33 | 17.0%(+60.3)#1,127 |
| 34. | Mocanaqua | 76.9% | 16.5%(+60.4)#34 | 17.0%(+59.9)#1,140 |
| 35. | Boswell Borough | 76.4% | 16.5%(+59.9)#35 | 17.0%(+59.4)#1,156 |
| 36. | Nemacolin | 76.2% | 16.5%(+59.7)#36 | 17.0%(+59.2)#1,160 |
| 37. | Julian | 75.0% | 16.5%(+58.5)#37 | 17.0%(+58.0)#1,213 |
| 38. | Mainville | 75.0% | 16.5%(+58.5)#38 | 17.0%(+58.0)#1,224 |
| 39. | Starbrick | 74.6% | 16.5%(+58.1)#39 | 17.0%(+57.6)#1,244 |
| 40. | Polk Borough | 74.5% | 16.5%(+58.0)#40 | 17.0%(+57.5)#1,247 |
| 41. | Luzerne Borough | 74.2% | 16.5%(+57.7)#41 | 17.0%(+57.2)#1,258 |
| 42. | Wall Borough | 72.9% | 16.5%(+56.4)#42 | 17.0%(+55.9)#1,312 |
| 43. | South Philipsburg | 72.7% | 16.5%(+56.2)#43 | 17.0%(+55.8)#1,323 |
| 44. | Cumbola | 72.7% | 16.5%(+56.2)#44 | 17.0%(+55.8)#1,326 |
| 45. | Roulette | 71.8% | 16.5%(+55.3)#45 | 17.0%(+54.9)#1,369 |
| 46. | Taylor Borough | 71.5% | 16.5%(+55.0)#46 | 17.0%(+54.5)#1,381 |
| 47. | Birchwood Lakes | 71.2% | 16.5%(+54.7)#47 | 17.0%(+54.3)#1,404 |
| 48. | Tharptown Uniontown | 71.1% | 16.5%(+54.6)#48 | 17.0%(+54.1)#1,414 |
| 49. | North Philipsburg | 70.0% | 16.5%(+53.5)#49 | 17.0%(+53.0)#1,455 |
| 50. | Coburn | 70.0% | 16.5%(+53.5)#50 | 17.0%(+53.0)#1,463 |
| 51. | Ashley Borough | 69.1% | 16.5%(+52.6)#51 | 17.0%(+52.1)#1,507 |
| 52. | Enon Valley Borough | 68.2% | 16.5%(+51.7)#52 | 17.0%(+51.2)#1,551 |
| 53. | Garrett Borough | 67.7% | 16.5%(+51.2)#53 | 17.0%(+50.8)#1,566 |
| 54. | Ulysses Borough | 67.3% | 16.5%(+50.8)#54 | 17.0%(+50.4)#1,588 |
| 55. | Bobtown | 66.7% | 16.5%(+50.2)#55 | 17.0%(+49.7)#1,616 |
| 56. | Mount Union Borough | 66.5% | 16.5%(+50.0)#56 | 17.0%(+49.5)#1,676 |
| 57. | Conneautville Borough | 65.8% | 16.5%(+49.3)#57 | 17.0%(+48.8)#1,708 |
| 58. | Freedom Borough | 65.8% | 16.5%(+49.3)#58 | 17.0%(+48.8)#1,709 |
| 59. | Sugar Notch Borough | 64.8% | 16.5%(+48.3)#59 | 17.0%(+47.8)#1,758 |
| 60. | Vandling Borough | 64.8% | 16.5%(+48.3)#60 | 17.0%(+47.8)#1,759 |
| 61. | Shamokin | 63.8% | 16.5%(+47.3)#61 | 17.0%(+46.9)#1,825 |
| 62. | Northern Cambria Borough | 63.7% | 16.5%(+47.2)#62 | 17.0%(+46.7)#1,830 |
| 63. | Cassville Borough | 63.2% | 16.5%(+46.7)#63 | 17.0%(+46.2)#1,860 |
| 64. | Darby Borough | 62.9% | 16.5%(+46.4)#64 | 17.0%(+45.9)#1,875 |
| 65. | Big Run Borough | 62.5% | 16.5%(+46.0)#65 | 17.0%(+45.5)#1,905 |
| 66. | Vandergrift Borough | 62.3% | 16.5%(+45.8)#66 | 17.0%(+45.3)#1,927 |
| 67. | Dawson Borough | 62.2% | 16.5%(+45.7)#67 | 17.0%(+45.2)#1,931 |
| 68. | Clarendon Borough | 61.9% | 16.5%(+45.4)#68 | 17.0%(+44.9)#1,952 |
| 69. | Continental Courts | 61.6% | 16.5%(+45.1)#69 | 17.0%(+44.7)#1,969 |
| 70. | Pittston | 61.6% | 16.5%(+45.1)#70 | 17.0%(+44.6)#1,972 |
| 71. | Dallas Borough | 61.5% | 16.5%(+45.0)#71 | 17.0%(+44.5)#1,989 |
| 72. | Smethport Borough | 60.8% | 16.5%(+44.3)#72 | 17.0%(+43.8)#2,024 |
| 73. | Revloc | 60.4% | 16.5%(+43.9)#73 | 17.0%(+43.5)#2,054 |
| 74. | Kirkwood | 60.4% | 16.5%(+43.9)#74 | 17.0%(+43.4)#2,061 |
| 75. | Edwardsville Borough | 59.7% | 16.5%(+43.2)#75 | 17.0%(+42.7)#2,121 |
| 76. | Marion Center Borough | 59.0% | 16.5%(+42.5)#76 | 17.0%(+42.0)#2,167 |
| 77. | Smithton Borough | 59.0% | 16.5%(+42.5)#77 | 17.0%(+42.0)#2,175 |
| 78. | Turtle Creek Borough | 58.8% | 16.5%(+42.3)#78 | 17.0%(+41.8)#2,190 |
| 79. | Johnstown | 58.5% | 16.5%(+42.0)#79 | 17.0%(+41.5)#2,216 |
| 80. | Weissport Borough | 57.5% | 16.5%(+41.0)#80 | 17.0%(+40.5)#2,293 |
| 81. | Georgetown Borough | 57.1% | 16.5%(+40.6)#81 | 17.0%(+40.2)#2,319 |
| 82. | Woodland Heights | 56.7% | 16.5%(+40.2)#82 | 17.0%(+39.7)#2,363 |
| 83. | Thompson Borough | 56.7% | 16.5%(+40.2)#83 | 17.0%(+39.7)#2,370 |
| 84. | Brave | 56.5% | 16.5%(+40.0)#84 | 17.0%(+39.5)#2,383 |
| 85. | Chester Hill Borough | 56.4% | 16.5%(+39.9)#85 | 17.0%(+39.4)#2,387 |
| 86. | Westfield Borough | 56.3% | 16.5%(+39.8)#86 | 17.0%(+39.3)#2,392 |
| 87. | Hasson Heights | 56.0% | 16.5%(+39.5)#87 | 17.0%(+39.0)#2,426 |
| 88. | Lightstreet | 55.9% | 16.5%(+39.4)#88 | 17.0%(+39.0)#2,432 |
| 89. | Rankin Borough | 55.8% | 16.5%(+39.3)#89 | 17.0%(+38.9)#2,442 |
| 90. | North Braddock Borough | 55.8% | 16.5%(+39.3)#90 | 17.0%(+38.8)#2,451 |
| 91. | Masontown Borough | 55.6% | 16.5%(+39.1)#91 | 17.0%(+38.6)#2,459 |
| 92. | Robinson | 55.6% | 16.5%(+39.1)#92 | 17.0%(+38.6)#2,467 |
| 93. | Callensburg Borough | 55.6% | 16.5%(+39.1)#93 | 17.0%(+38.6)#2,480 |
| 94. | Woodbury Borough | 55.4% | 16.5%(+38.9)#94 | 17.0%(+38.4)#2,492 |
| 95. | Pleasant Hill | 55.4% | 16.5%(+38.9)#95 | 17.0%(+38.4)#2,494 |
| 96. | Rossiter | 55.0% | 16.5%(+38.5)#96 | 17.0%(+38.0)#2,520 |
| 97. | Iola | 55.0% | 16.5%(+38.5)#97 | 17.0%(+38.0)#2,525 |
| 98. | New Bethlehem Borough | 54.8% | 16.5%(+38.3)#98 | 17.0%(+37.9)#2,536 |
| 99. | Mcconnellsburg Borough | 54.1% | 16.5%(+37.6)#99 | 17.0%(+37.1)#2,603 |
| 100. | Avella | 54.1% | 16.5%(+37.6)#100 | 17.0%(+37.1)#2,608 |
Common Questions
What are the Top 10 Cities with the Highest Child Poverty Level Among Girls Under the Age of 16 in Pennsylvania?
Top 10 Cities with the Highest Child Poverty Level Among Girls Under the Age of 16 in Pennsylvania are:
#1
100.0%
#2
100.0%
#3
100.0%
#4
100.0%
#5
100.0%
#6
100.0%
#7
100.0%
#8
100.0%
#9
100.0%
#10
100.0%
What city has the Highest Child Poverty Level Among Girls Under the Age of 16 in Pennsylvania?
Toftrees has the Highest Child Poverty Level Among Girls Under the Age of 16 in Pennsylvania with 100.0%.
What is the Poverty Level Among Girls Under the Age of 16 in the State of Pennsylvania?
Poverty Level Among Girls Under the Age of 16 in Pennsylvania is 16.5%.
What is the Poverty Level Among Girls Under the Age of 16 in the United States?
Poverty Level Among Girls Under the Age of 16 in the United States is 17.0%.