Maple Falls, WA Map & Demographics
Maple Falls Map
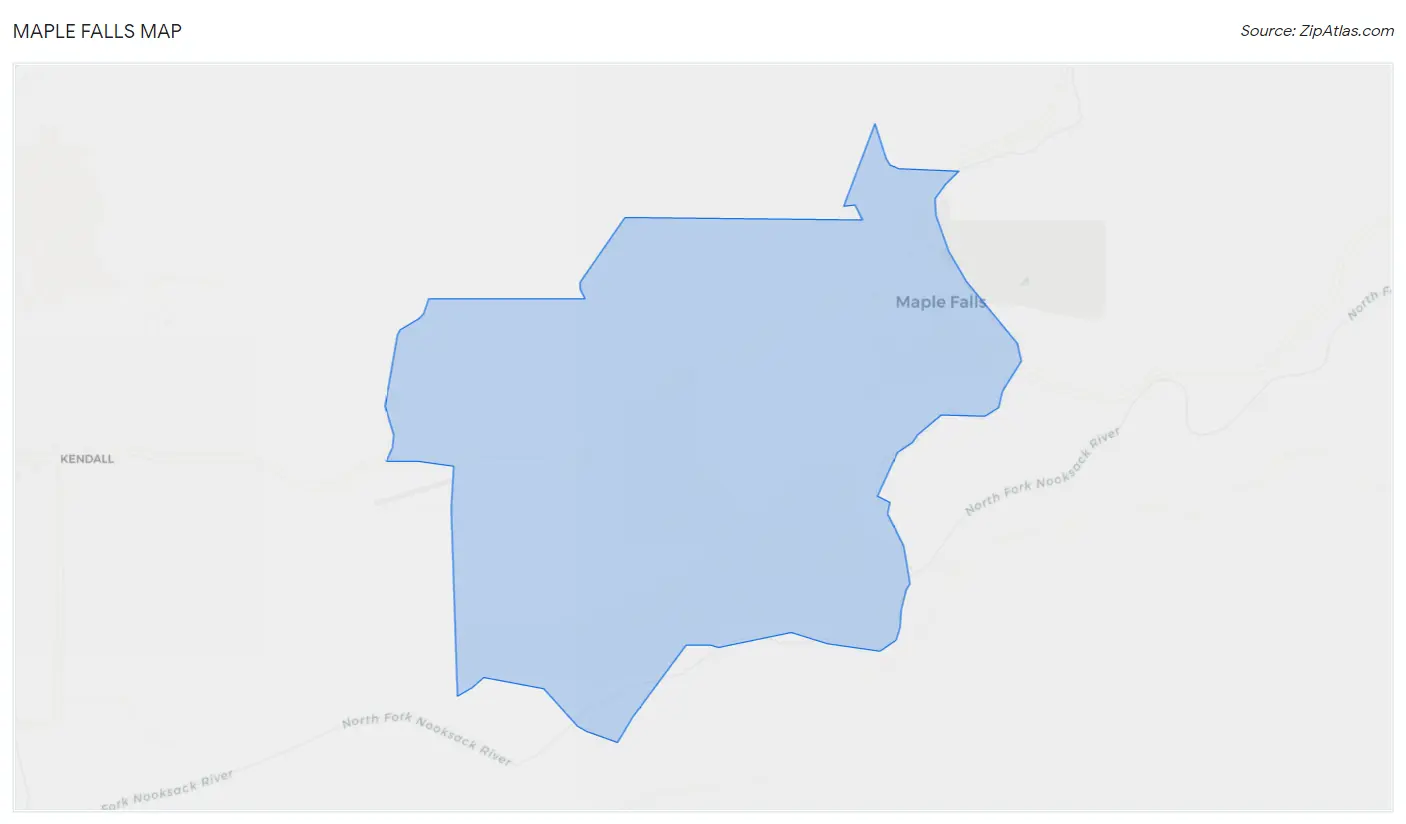
Maple Falls Overview
$30,698
PER CAPITA INCOME
$52,917
AVG FAMILY INCOME
$32,226
AVG HOUSEHOLD INCOME
0.28
INEQUALITY / GINI INDEX
231
TOTAL POPULATION
54
MALE POPULATION
177
FEMALE POPULATION
30.51
MALES / 100 FEMALES
327.78
FEMALES / 100 MALES
61.4
MEDIAN AGE
2.5
AVG FAMILY SIZE
1.6
AVG HOUSEHOLD SIZE
129
LABOR FORCE [ PEOPLE ]
55.8%
PERCENT IN LABOR FORCE
Maple Falls Zip Codes
Maple Falls Area Codes
Income in Maple Falls
Income Overview in Maple Falls
Per Capita Income in Maple Falls is $30,698, while median incomes of families and households are $52,917 and $32,226 respectively.
| Characteristic | Number | Measure |
| Per Capita Income | 231 | $30,698 |
| Median Family Income | 58 | $52,917 |
| Mean Family Income | 58 | $70,036 |
| Median Household Income | 146 | $32,226 |
| Mean Household Income | 146 | $47,745 |
| Income Deficit | 58 | $0 |
| Wage / Income Gap (%) | 231 | 0.00% |
| Wage / Income Gap ($) | 231 | 100.00¢ per $1 |
| Gini / Inequality Index | 231 | 0.28 |
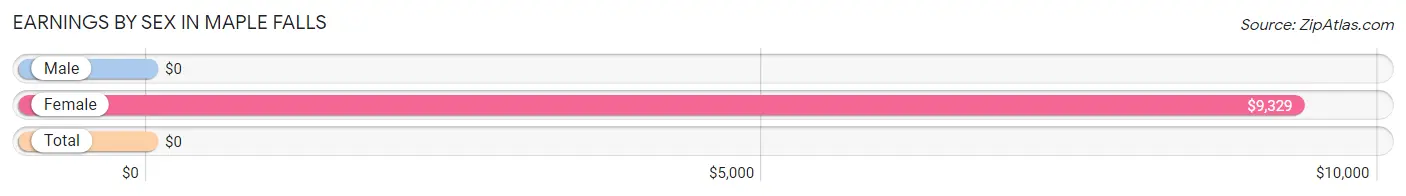
Earnings by Sex in Maple Falls
| Sex | Number | Average Earnings |
| Male | 9 (7.0%) | $0 |
| Female | 120 (93.0%) | $9,329 |
| Total | 129 (100.0%) | $0 |
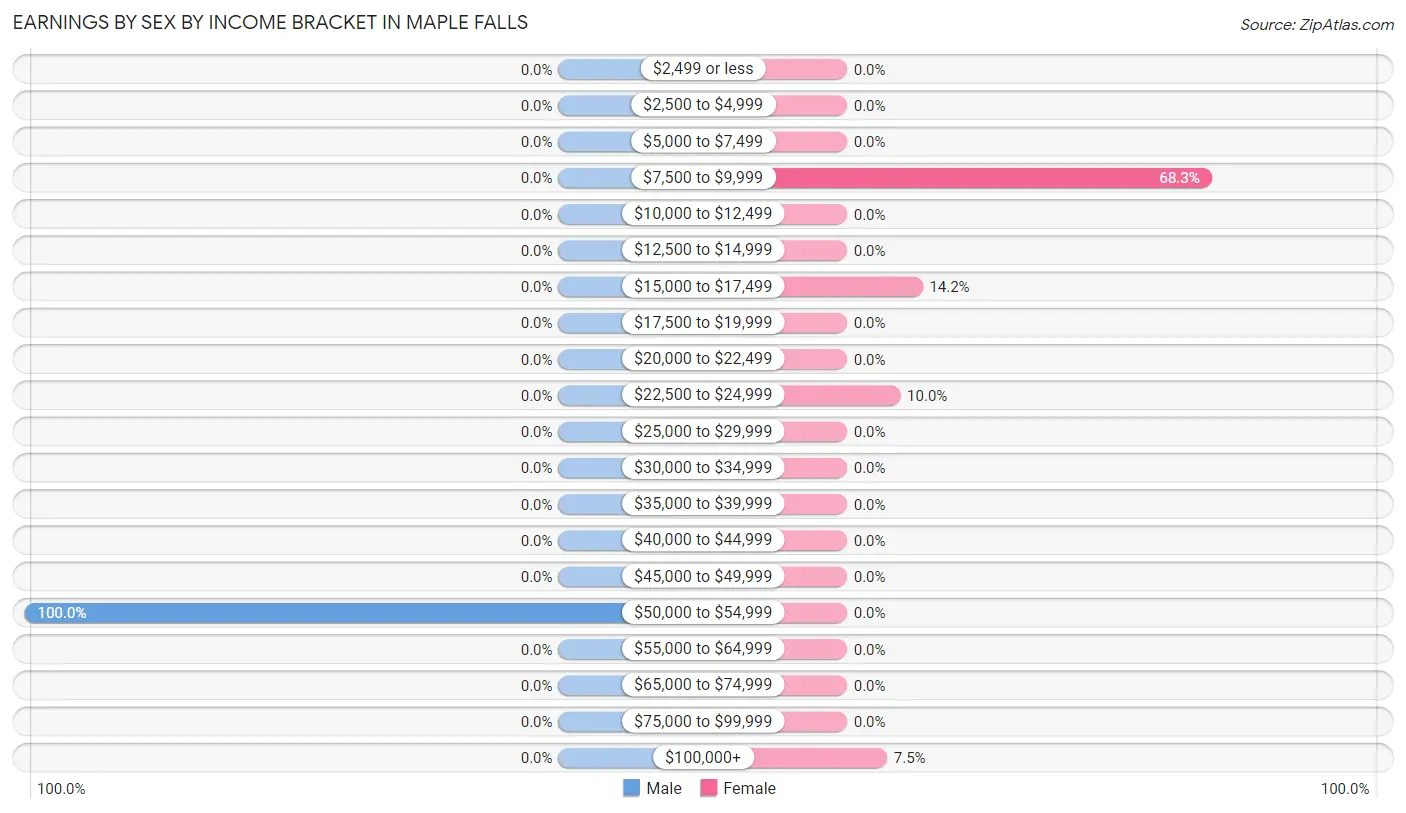
Earnings by Sex by Income Bracket in Maple Falls
The most common earnings brackets in Maple Falls are $50,000 to $54,999 for men (9 | 100.0%) and $7,500 to $9,999 for women (82 | 68.3%).
| Income | Male | Female |
| $2,499 or less | 0 (0.0%) | 0 (0.0%) |
| $2,500 to $4,999 | 0 (0.0%) | 0 (0.0%) |
| $5,000 to $7,499 | 0 (0.0%) | 0 (0.0%) |
| $7,500 to $9,999 | 0 (0.0%) | 82 (68.3%) |
| $10,000 to $12,499 | 0 (0.0%) | 0 (0.0%) |
| $12,500 to $14,999 | 0 (0.0%) | 0 (0.0%) |
| $15,000 to $17,499 | 0 (0.0%) | 17 (14.2%) |
| $17,500 to $19,999 | 0 (0.0%) | 0 (0.0%) |
| $20,000 to $22,499 | 0 (0.0%) | 0 (0.0%) |
| $22,500 to $24,999 | 0 (0.0%) | 12 (10.0%) |
| $25,000 to $29,999 | 0 (0.0%) | 0 (0.0%) |
| $30,000 to $34,999 | 0 (0.0%) | 0 (0.0%) |
| $35,000 to $39,999 | 0 (0.0%) | 0 (0.0%) |
| $40,000 to $44,999 | 0 (0.0%) | 0 (0.0%) |
| $45,000 to $49,999 | 0 (0.0%) | 0 (0.0%) |
| $50,000 to $54,999 | 9 (100.0%) | 0 (0.0%) |
| $55,000 to $64,999 | 0 (0.0%) | 0 (0.0%) |
| $65,000 to $74,999 | 0 (0.0%) | 0 (0.0%) |
| $75,000 to $99,999 | 0 (0.0%) | 0 (0.0%) |
| $100,000+ | 0 (0.0%) | 9 (7.5%) |
| Total | 9 (100.0%) | 120 (100.0%) |
Earnings by Sex by Educational Attainment in Maple Falls
| Educational Attainment | Male Income | Female Income |
| Less than High School | - | - |
| High School Diploma | - | - |
| College or Associate's Degree | - | - |
| Bachelor's Degree | - | - |
| Graduate Degree | - | - |
| Total | - | - |
Family Income in Maple Falls
Family Income Brackets in Maple Falls
According to the Maple Falls family income data, there are 25 families falling into the $35,000 to $49,999 income range, which is the most common income bracket and makes up 43.1% of all families.
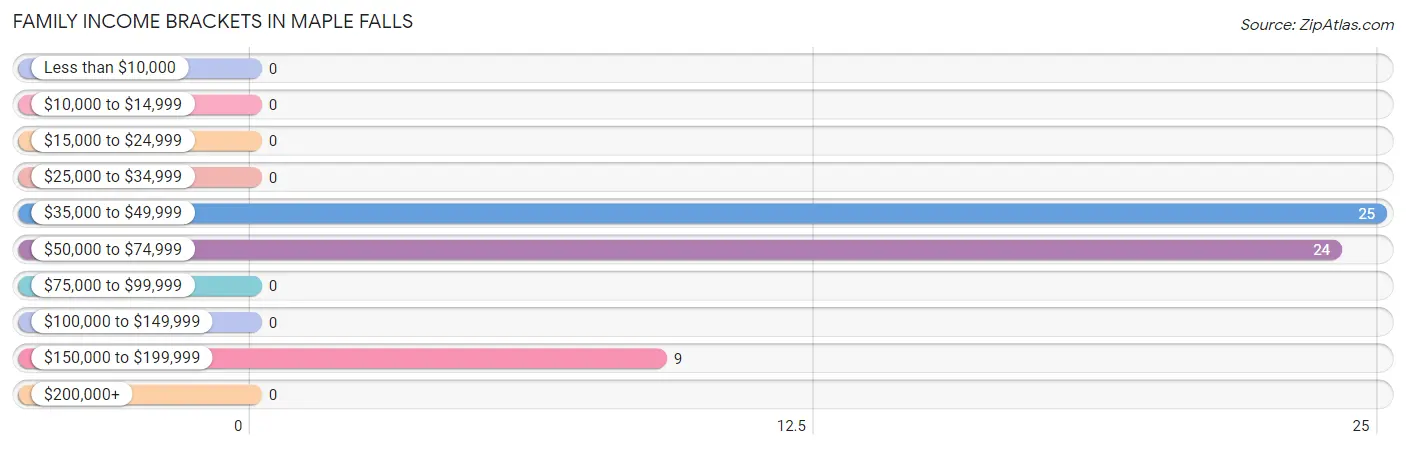
| Income Bracket | # Families | % Families |
| Less than $10,000 | 0 | 0.0% |
| $10,000 to $14,999 | 0 | 0.0% |
| $15,000 to $24,999 | 0 | 0.0% |
| $25,000 to $34,999 | 0 | 0.0% |
| $35,000 to $49,999 | 25 | 43.1% |
| $50,000 to $74,999 | 24 | 41.4% |
| $75,000 to $99,999 | 0 | 0.0% |
| $100,000 to $149,999 | 0 | 0.0% |
| $150,000 to $199,999 | 9 | 15.5% |
| $200,000+ | 0 | 0.0% |
Family Income by Famaliy Size in Maple Falls
2-person families (58 | 100.0%) account for the highest median family income in Maple Falls with $52,917 per family, while 2-person families (58 | 100.0%) have the highest median income of $26,458 per family member.
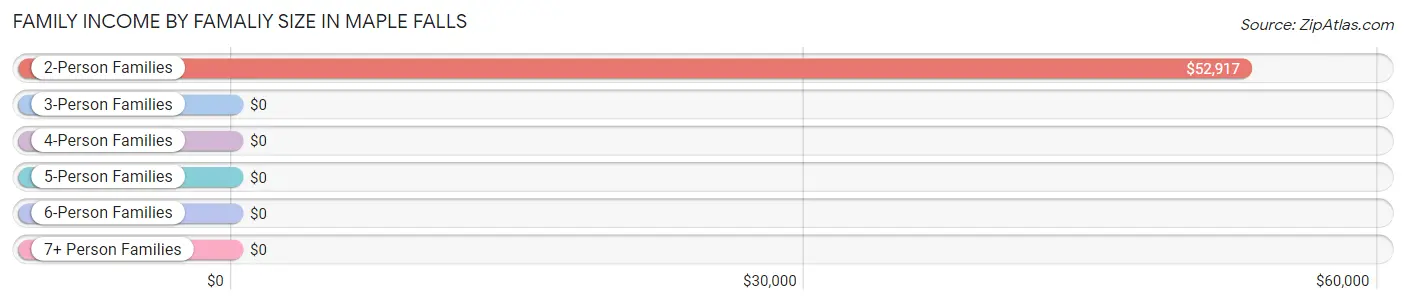
| Income Bracket | # Families | Median Income |
| 2-Person Families | 58 (100.0%) | $52,917 |
| 3-Person Families | 0 (0.0%) | $0 |
| 4-Person Families | 0 (0.0%) | $0 |
| 5-Person Families | 0 (0.0%) | $0 |
| 6-Person Families | 0 (0.0%) | $0 |
| 7+ Person Families | 0 (0.0%) | $0 |
| Total | 58 (100.0%) | $52,917 |
Family Income by Number of Earners in Maple Falls
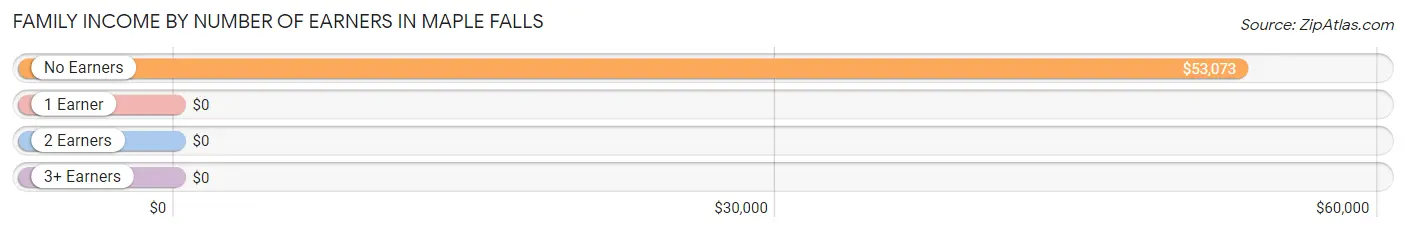
| Number of Earners | # Families | Median Income |
| No Earners | 37 (63.8%) | $53,073 |
| 1 Earner | 0 (0.0%) | $0 |
| 2 Earners | 21 (36.2%) | $0 |
| 3+ Earners | 0 (0.0%) | $0 |
| Total | 58 (100.0%) | $52,917 |
Household Income in Maple Falls
Household Income Brackets in Maple Falls
With 82 households falling in the category, the $25,000 to $34,999 income range is the most frequent in Maple Falls, accounting for 56.2% of all households.
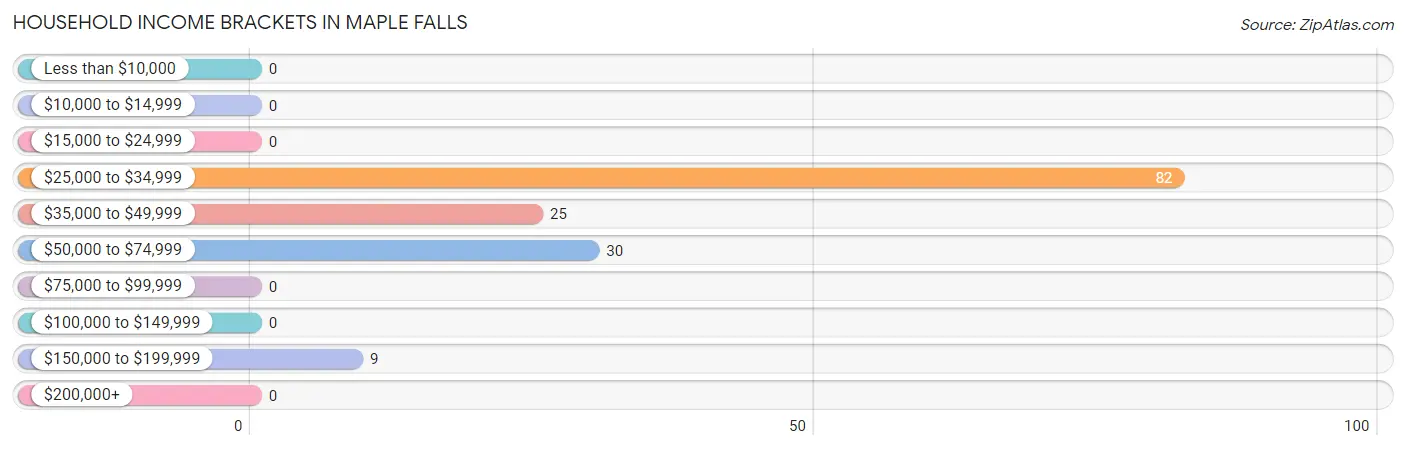
| Income Bracket | # Households | % Households |
| Less than $10,000 | 0 | 0.0% |
| $10,000 to $14,999 | 0 | 0.0% |
| $15,000 to $24,999 | 0 | 0.0% |
| $25,000 to $34,999 | 82 | 56.2% |
| $35,000 to $49,999 | 25 | 17.1% |
| $50,000 to $74,999 | 30 | 20.5% |
| $75,000 to $99,999 | 0 | 0.0% |
| $100,000 to $149,999 | 0 | 0.0% |
| $150,000 to $199,999 | 9 | 6.2% |
| $200,000+ | 0 | 0.0% |
Household Income by Householder Age in Maple Falls
The median household income in Maple Falls is $32,226, with the highest median household income of $31,738 found in the 45 to 64 years age bracket for the primary householder. A total of 114 households (78.1%) fall into this category. Meanwhile, the 15 to 24 years age bracket for the primary householder has the lowest median household income of $0, with 13 households (8.9%) in this group.
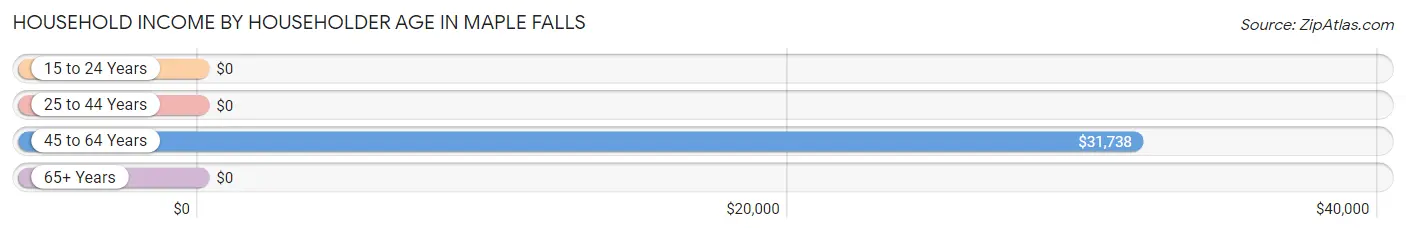
| Income Bracket | # Households | Median Income |
| 15 to 24 Years | 13 (8.9%) | $0 |
| 25 to 44 Years | 0 (0.0%) | $0 |
| 45 to 64 Years | 114 (78.1%) | $31,738 |
| 65+ Years | 19 (13.0%) | $0 |
| Total | 146 (100.0%) | $32,226 |
Poverty in Maple Falls
Income Below Poverty by Sex and Age in Maple Falls
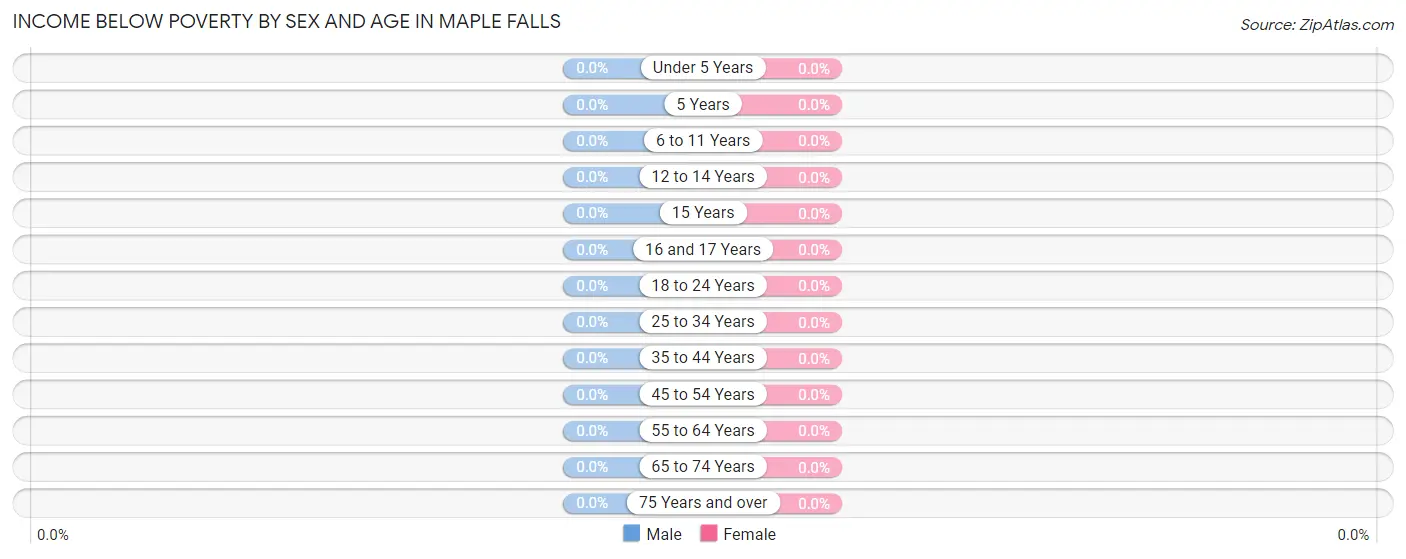
| Age Bracket | Male | Female |
| Under 5 Years | 0 (0.0%) | 0 (0.0%) |
| 5 Years | 0 (0.0%) | 0 (0.0%) |
| 6 to 11 Years | 0 (0.0%) | 0 (0.0%) |
| 12 to 14 Years | 0 (0.0%) | 0 (0.0%) |
| 15 Years | 0 (0.0%) | 0 (0.0%) |
| 16 and 17 Years | 0 (0.0%) | 0 (0.0%) |
| 18 to 24 Years | 0 (0.0%) | 0 (0.0%) |
| 25 to 34 Years | 0 (0.0%) | 0 (0.0%) |
| 35 to 44 Years | 0 (0.0%) | 0 (0.0%) |
| 45 to 54 Years | 0 (0.0%) | 0 (0.0%) |
| 55 to 64 Years | 0 (0.0%) | 0 (0.0%) |
| 65 to 74 Years | 0 (0.0%) | 0 (0.0%) |
| 75 Years and over | 0 (0.0%) | 0 (0.0%) |
| Total | 0 (0.0%) | 0 (0.0%) |
Income Above Poverty by Sex and Age in Maple Falls
According to the poverty statistics in Maple Falls, males aged 18 to 24 years and females aged 18 to 24 years are the age groups that are most secure financially, with 100.0% of males and 100.0% of females in these age groups living above the poverty line.
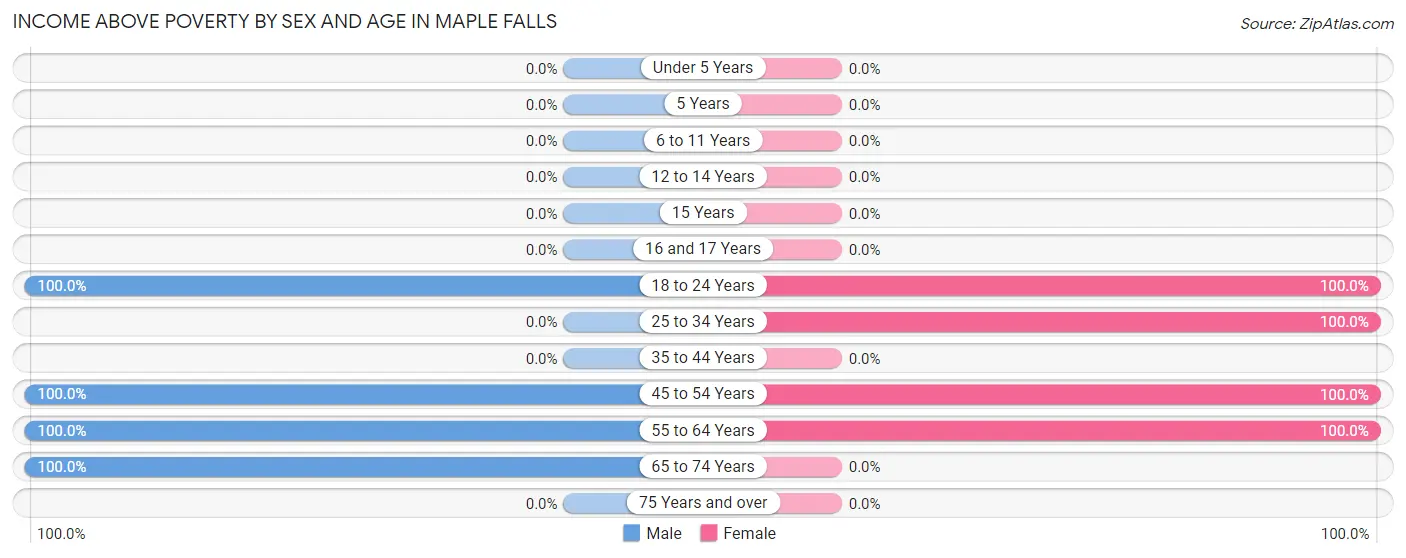
| Age Bracket | Male | Female |
| Under 5 Years | 0 (0.0%) | 0 (0.0%) |
| 5 Years | 0 (0.0%) | 0 (0.0%) |
| 6 to 11 Years | 0 (0.0%) | 0 (0.0%) |
| 12 to 14 Years | 0 (0.0%) | 0 (0.0%) |
| 15 Years | 0 (0.0%) | 0 (0.0%) |
| 16 and 17 Years | 0 (0.0%) | 0 (0.0%) |
| 18 to 24 Years | 13 (100.0%) | 34 (100.0%) |
| 25 to 34 Years | 0 (0.0%) | 17 (100.0%) |
| 35 to 44 Years | 0 (0.0%) | 0 (0.0%) |
| 45 to 54 Years | 9 (100.0%) | 9 (100.0%) |
| 55 to 64 Years | 13 (100.0%) | 117 (100.0%) |
| 65 to 74 Years | 19 (100.0%) | 0 (0.0%) |
| 75 Years and over | 0 (0.0%) | 0 (0.0%) |
| Total | 54 (100.0%) | 177 (100.0%) |
Income Below Poverty Among Married-Couple Families in Maple Falls
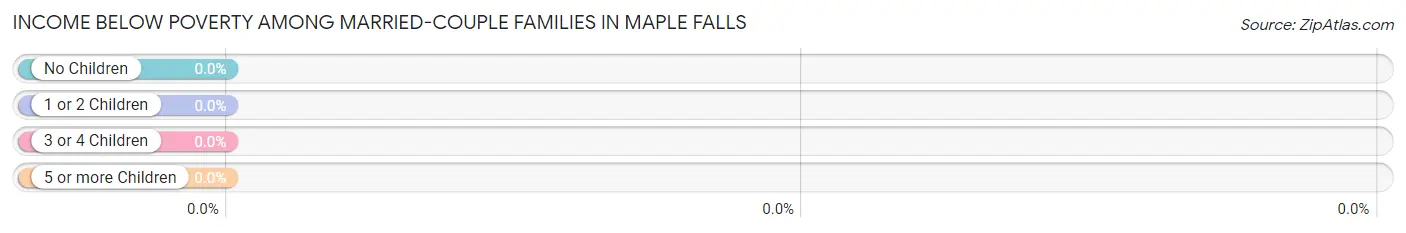
| Children | Above Poverty | Below Poverty |
| No Children | 46 (100.0%) | 0 (0.0%) |
| 1 or 2 Children | 0 (0.0%) | 0 (0.0%) |
| 3 or 4 Children | 0 (0.0%) | 0 (0.0%) |
| 5 or more Children | 0 (0.0%) | 0 (0.0%) |
| Total | 46 (100.0%) | 0 (0.0%) |
Income Below Poverty Among Single-Parent Households in Maple Falls
| Children | Single Father | Single Mother |
| No Children | 0 (0.0%) | 0 (0.0%) |
| 1 or 2 Children | 0 (0.0%) | 0 (0.0%) |
| 3 or 4 Children | 0 (0.0%) | 0 (0.0%) |
| 5 or more Children | 0 (0.0%) | 0 (0.0%) |
| Total | 0 (0.0%) | 0 (0.0%) |
Income Below Poverty Among Married-Couple vs Single-Parent Households in Maple Falls
| Children | Married-Couple Families | Single-Parent Households |
| No Children | 0 (0.0%) | 0 (0.0%) |
| 1 or 2 Children | 0 (0.0%) | 0 (0.0%) |
| 3 or 4 Children | 0 (0.0%) | 0 (0.0%) |
| 5 or more Children | 0 (0.0%) | 0 (0.0%) |
| Total | 0 (0.0%) | 0 (0.0%) |
Race in Maple Falls
The most populous races in Maple Falls are White / Caucasian (231 | 100.0%), and Hispanic or Latino (13 | 5.6%).
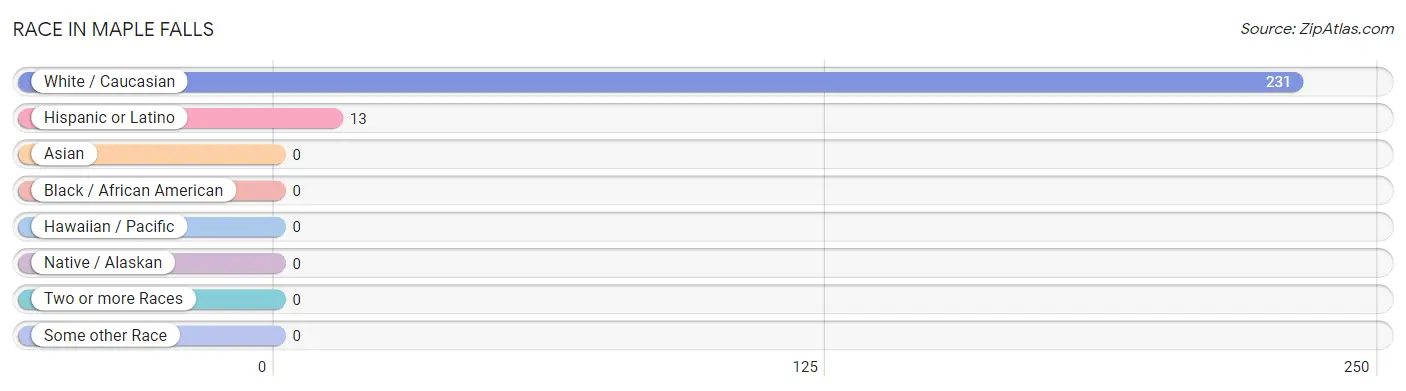
| Race | # Population | % Population |
| Asian | 0 | 0.0% |
| Black / African American | 0 | 0.0% |
| Hawaiian / Pacific | 0 | 0.0% |
| Hispanic or Latino | 13 | 5.6% |
| Native / Alaskan | 0 | 0.0% |
| White / Caucasian | 231 | 100.0% |
| Two or more Races | 0 | 0.0% |
| Some other Race | 0 | 0.0% |
| Total | 231 | 100.0% |
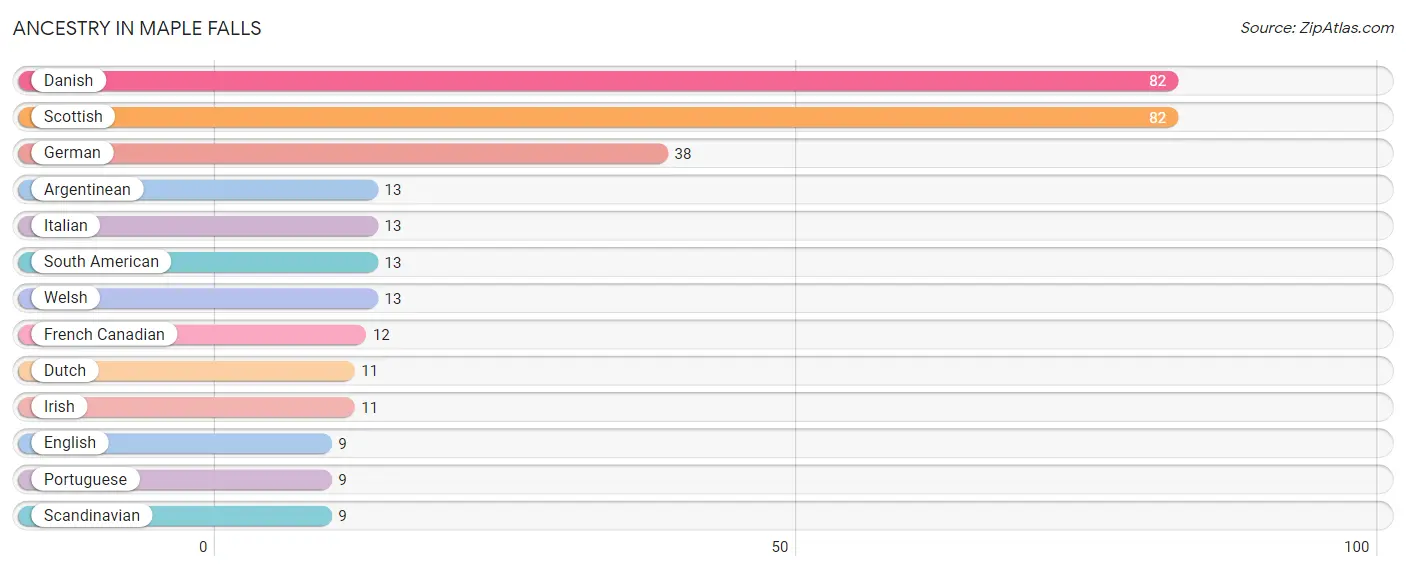
Ancestry in Maple Falls
The most populous ancestries reported in Maple Falls are Danish (82 | 35.5%), Scottish (82 | 35.5%), German (38 | 16.5%), Argentinean (13 | 5.6%), and Italian (13 | 5.6%), together accounting for 98.7% of all Maple Falls residents.
| Ancestry | # Population | % Population |
| Argentinean | 13 | 5.6% |
| Danish | 82 | 35.5% |
| Dutch | 11 | 4.8% |
| English | 9 | 3.9% |
| French Canadian | 12 | 5.2% |
| German | 38 | 16.5% |
| Irish | 11 | 4.8% |
| Italian | 13 | 5.6% |
| Portuguese | 9 | 3.9% |
| Scandinavian | 9 | 3.9% |
| Scottish | 82 | 35.5% |
| South American | 13 | 5.6% |
| Welsh | 13 | 5.6% | View All 13 Rows |
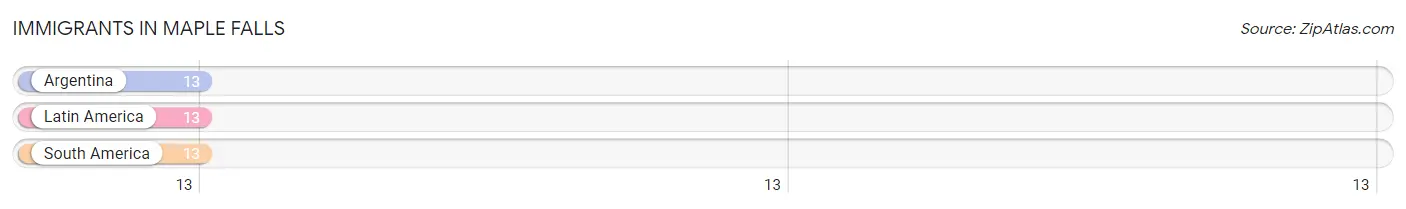
Immigrants in Maple Falls
The most numerous immigrant groups reported in Maple Falls came from Argentina (13 | 5.6%), Latin America (13 | 5.6%), and South America (13 | 5.6%), together accounting for 16.9% of all Maple Falls residents.
| Immigration Origin | # Population | % Population |
| Argentina | 13 | 5.6% |
| Latin America | 13 | 5.6% |
| South America | 13 | 5.6% | View All 3 Rows |
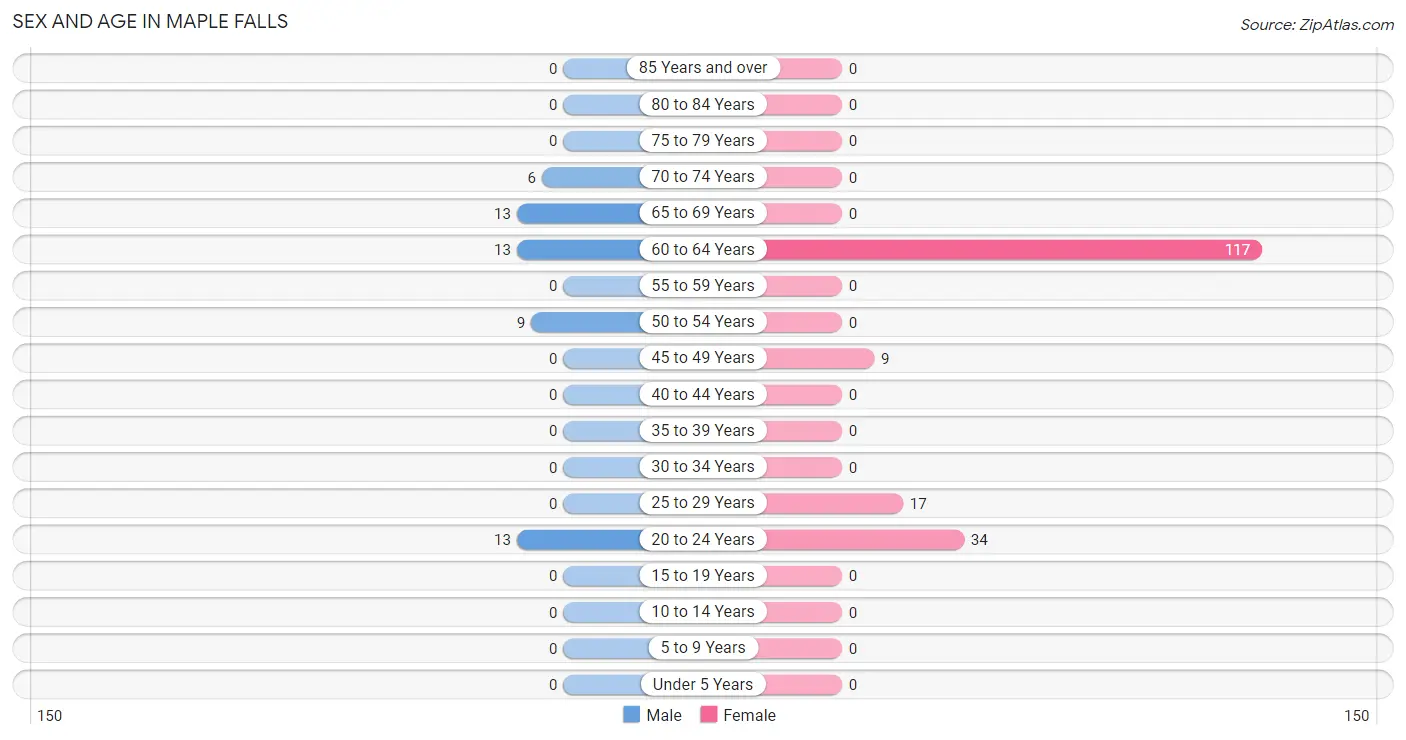
Sex and Age in Maple Falls
Sex and Age in Maple Falls
The most populous age groups in Maple Falls are 20 to 24 Years (13 | 24.1%) for men and 60 to 64 Years (117 | 66.1%) for women.
| Age Bracket | Male | Female |
| Under 5 Years | 0 (0.0%) | 0 (0.0%) |
| 5 to 9 Years | 0 (0.0%) | 0 (0.0%) |
| 10 to 14 Years | 0 (0.0%) | 0 (0.0%) |
| 15 to 19 Years | 0 (0.0%) | 0 (0.0%) |
| 20 to 24 Years | 13 (24.1%) | 34 (19.2%) |
| 25 to 29 Years | 0 (0.0%) | 17 (9.6%) |
| 30 to 34 Years | 0 (0.0%) | 0 (0.0%) |
| 35 to 39 Years | 0 (0.0%) | 0 (0.0%) |
| 40 to 44 Years | 0 (0.0%) | 0 (0.0%) |
| 45 to 49 Years | 0 (0.0%) | 9 (5.1%) |
| 50 to 54 Years | 9 (16.7%) | 0 (0.0%) |
| 55 to 59 Years | 0 (0.0%) | 0 (0.0%) |
| 60 to 64 Years | 13 (24.1%) | 117 (66.1%) |
| 65 to 69 Years | 13 (24.1%) | 0 (0.0%) |
| 70 to 74 Years | 6 (11.1%) | 0 (0.0%) |
| 75 to 79 Years | 0 (0.0%) | 0 (0.0%) |
| 80 to 84 Years | 0 (0.0%) | 0 (0.0%) |
| 85 Years and over | 0 (0.0%) | 0 (0.0%) |
| Total | 54 (100.0%) | 177 (100.0%) |
Families and Households in Maple Falls
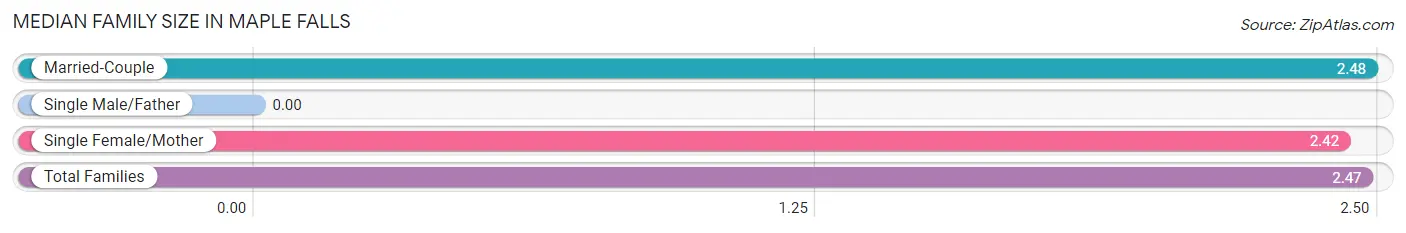
Median Family Size in Maple Falls
| Family Type | # Families | Family Size |
| Married-Couple | 46 (79.3%) | 2.48 |
| Single Male/Father | 0 (0.0%) | - |
| Single Female/Mother | 12 (20.7%) | 2.42 |
| Total Families | 58 (100.0%) | 2.47 |
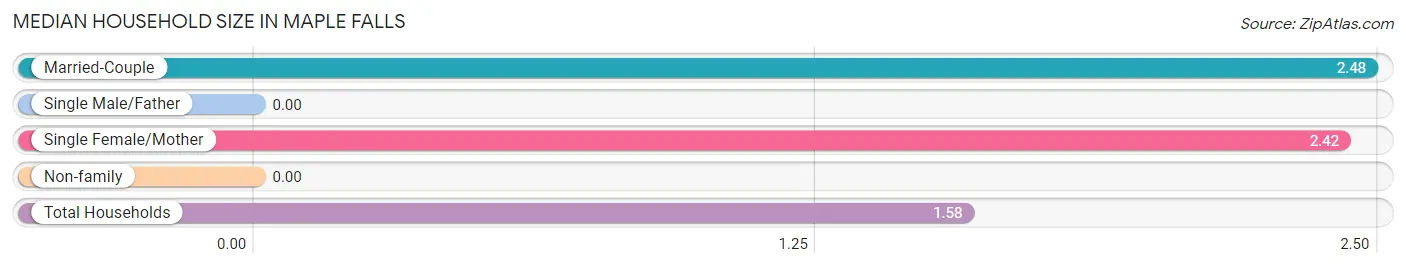
Median Household Size in Maple Falls
| Household Type | # Households | Household Size |
| Married-Couple | 46 (31.5%) | 2.48 |
| Single Male/Father | 0 (0.0%) | - |
| Single Female/Mother | 12 (8.2%) | 2.42 |
| Non-family | 88 (60.3%) | - |
| Total Households | 146 (100.0%) | 1.58 |
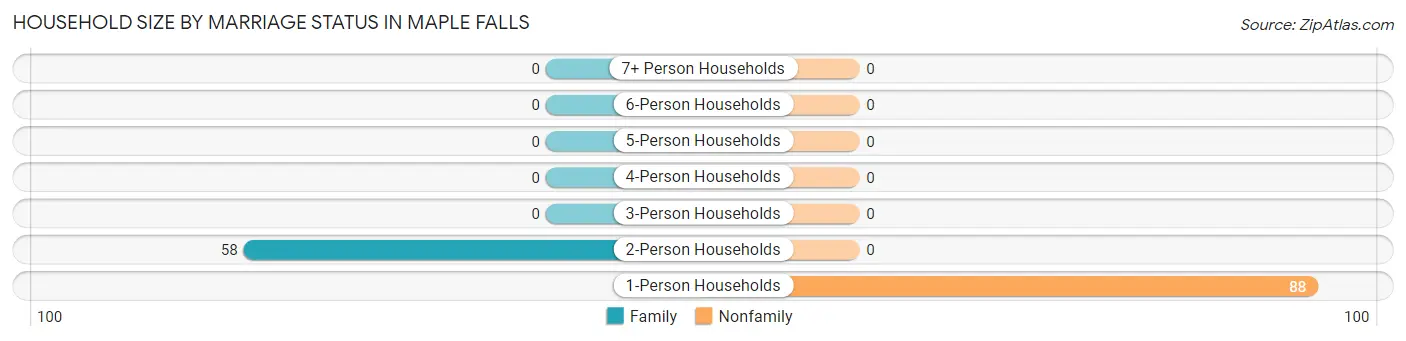
Household Size by Marriage Status in Maple Falls
Out of a total of 146 households in Maple Falls, 58 (39.7%) are family households, while 88 (60.3%) are nonfamily households. The most numerous type of family households are 2-person households, comprising 58, and the most common type of nonfamily households are 1-person households, comprising 88.
| Household Size | Family Households | Nonfamily Households |
| 1-Person Households | - | 88 (60.3%) |
| 2-Person Households | 58 (39.7%) | 0 (0.0%) |
| 3-Person Households | 0 (0.0%) | 0 (0.0%) |
| 4-Person Households | 0 (0.0%) | 0 (0.0%) |
| 5-Person Households | 0 (0.0%) | 0 (0.0%) |
| 6-Person Households | 0 (0.0%) | 0 (0.0%) |
| 7+ Person Households | 0 (0.0%) | 0 (0.0%) |
| Total | 58 (39.7%) | 88 (60.3%) |
Female Fertility in Maple Falls
Fertility by Age in Maple Falls
| Age Bracket | Women with Births | Births / 1,000 Women |
| 15 to 19 years | 0 (0.0%) | 0.0 |
| 20 to 34 years | 0 (0.0%) | 0.0 |
| 35 to 50 years | 0 (0.0%) | 0.0 |
| Total | 0 (0.0%) | 0.0 |
Fertility by Age by Marriage Status in Maple Falls
| Age Bracket | Married | Unmarried |
| 15 to 19 years | 0 (0.0%) | 0 (0.0%) |
| 20 to 34 years | 0 (0.0%) | 0 (0.0%) |
| 35 to 50 years | 0 (0.0%) | 0 (0.0%) |
| Total | 0 (0.0%) | 0 (0.0%) |
Fertility by Education in Maple Falls
| Educational Attainment | Women with Births | Births / 1,000 Women |
| Less than High School | 0 (0.0%) | 0.0 |
| High School Diploma | 0 (0.0%) | 0.0 |
| College or Associate's Degree | 0 (0.0%) | 0.0 |
| Bachelor's Degree | 0 (0.0%) | 0.0 |
| Graduate Degree | 0 (0.0%) | 0.0 |
| Total | 0 (0.0%) | 0.0 |
Fertility by Education by Marriage Status in Maple Falls
| Educational Attainment | Married | Unmarried |
| Less than High School | 0 (0.0%) | 0 (0.0%) |
| High School Diploma | 0 (0.0%) | 0 (0.0%) |
| College or Associate's Degree | 0 (0.0%) | 0 (0.0%) |
| Bachelor's Degree | 0 (0.0%) | 0 (0.0%) |
| Graduate Degree | 0 (0.0%) | 0 (0.0%) |
| Total | 0 (0.0%) | 0 (0.0%) |
Employment Characteristics in Maple Falls
Employment by Class of Employer in Maple Falls
Among the 129 employed individuals in Maple Falls, self-employed (not incorporated) (82 | 63.6%), private company employees (29 | 22.5%), and not-for-profit organizations (9 | 7.0%) make up the most common classes of employment.
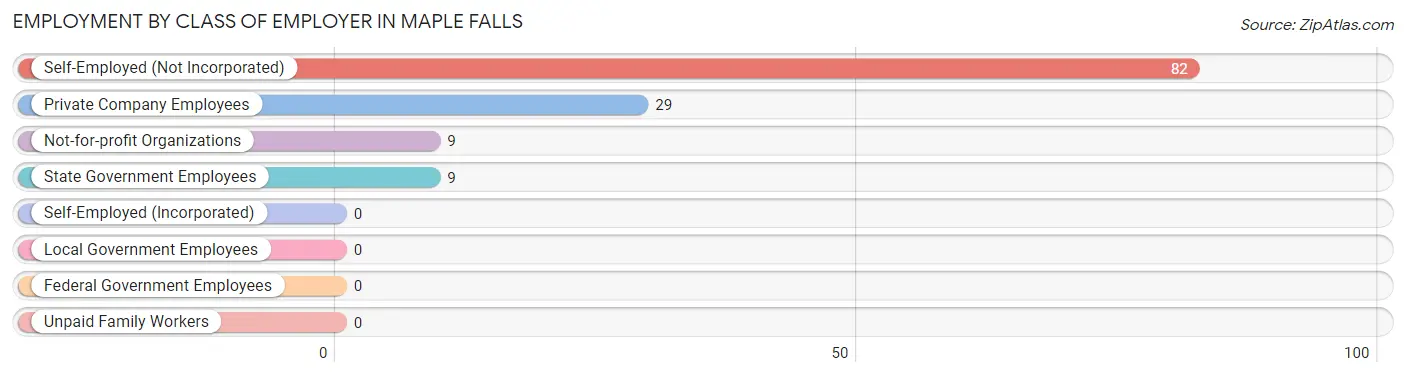
| Employer Class | # Employees | % Employees |
| Private Company Employees | 29 | 22.5% |
| Self-Employed (Incorporated) | 0 | 0.0% |
| Self-Employed (Not Incorporated) | 82 | 63.6% |
| Not-for-profit Organizations | 9 | 7.0% |
| Local Government Employees | 0 | 0.0% |
| State Government Employees | 9 | 7.0% |
| Federal Government Employees | 0 | 0.0% |
| Unpaid Family Workers | 0 | 0.0% |
| Total | 129 | 100.0% |
Employment Status by Age in Maple Falls
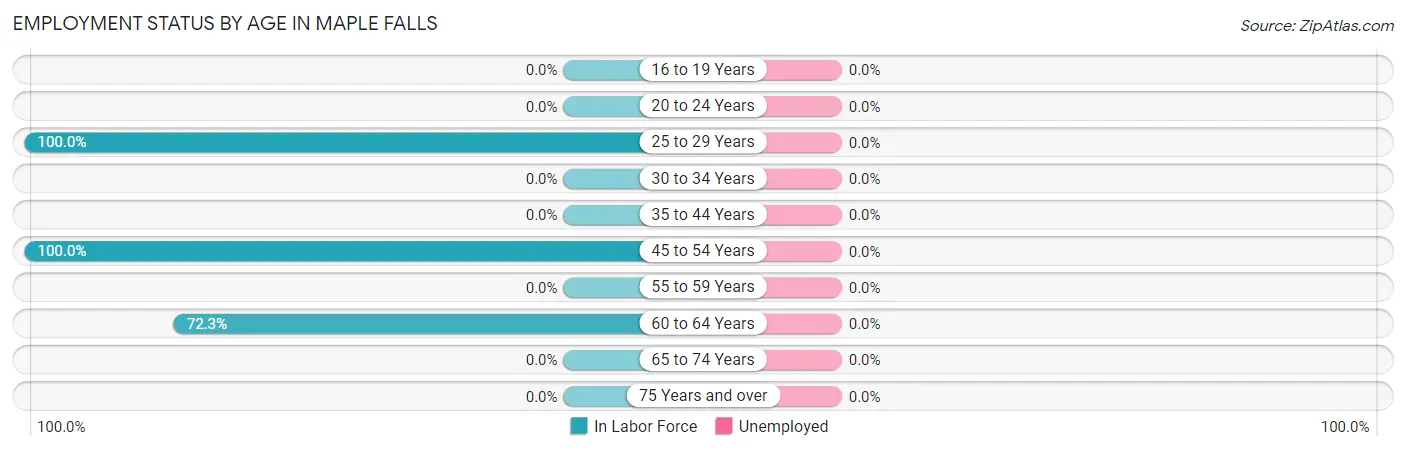
| Age Bracket | In Labor Force | Unemployed |
| 16 to 19 Years | 0 (0.0%) | 0 (0.0%) |
| 20 to 24 Years | 0 (0.0%) | 0 (0.0%) |
| 25 to 29 Years | 17 (100.0%) | 0 (0.0%) |
| 30 to 34 Years | 0 (0.0%) | 0 (0.0%) |
| 35 to 44 Years | 0 (0.0%) | 0 (0.0%) |
| 45 to 54 Years | 18 (100.0%) | 0 (0.0%) |
| 55 to 59 Years | 0 (0.0%) | 0 (0.0%) |
| 60 to 64 Years | 94 (72.3%) | 0 (0.0%) |
| 65 to 74 Years | 0 (0.0%) | 0 (0.0%) |
| 75 Years and over | 0 (0.0%) | 0 (0.0%) |
| Total | 129 (55.8%) | 0 (0.0%) |
Employment Status by Educational Attainment in Maple Falls
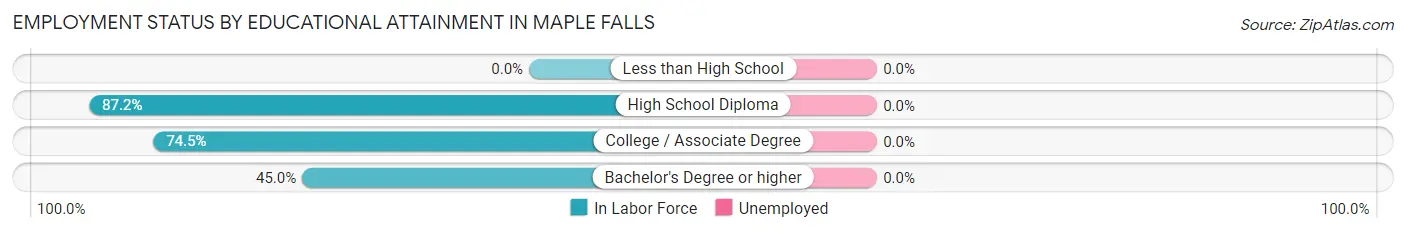
| Educational Attainment | In Labor Force | Unemployed |
| Less than High School | 0 (0.0%) | 0 (0.0%) |
| High School Diploma | 82 (87.2%) | 0 (0.0%) |
| College / Associate Degree | 38 (74.5%) | 0 (0.0%) |
| Bachelor's Degree or higher | 9 (45.0%) | 0 (0.0%) |
| Total | 129 (78.2%) | 0 (0.0%) |
Employment Occupations by Sex in Maple Falls
Management, Business, Science and Arts Occupations
The most common Management, Business, Science and Arts occupations in Maple Falls are , and Business & Financial (9 | 7.0%).
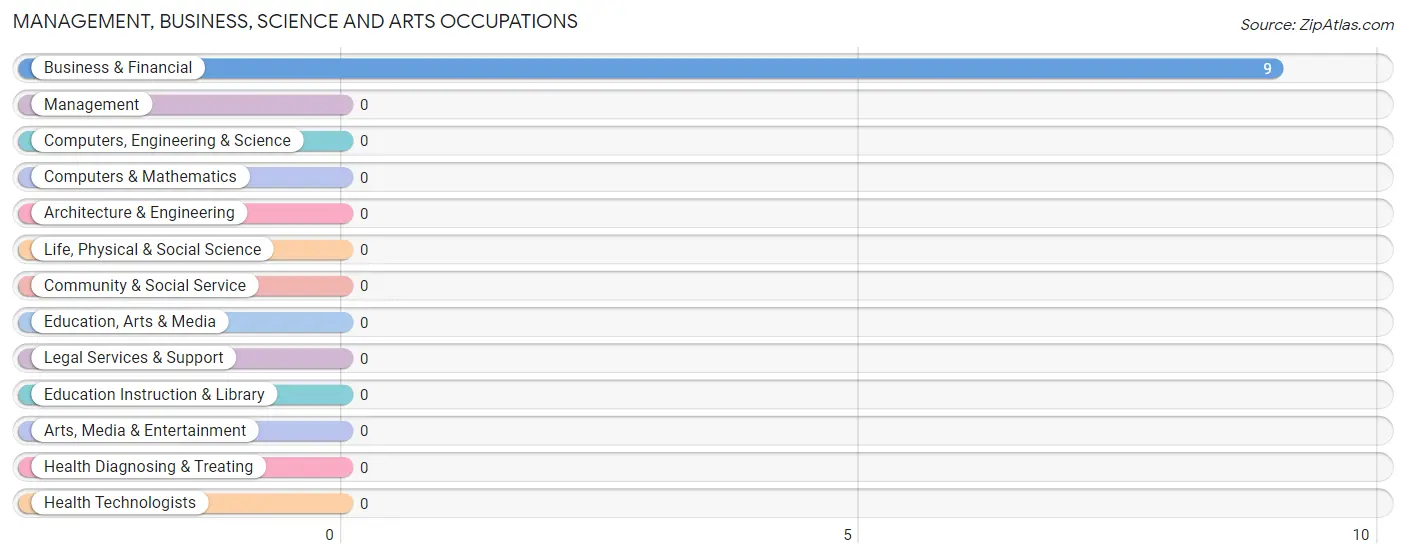
Management, Business, Science and Arts Occupations by Sex
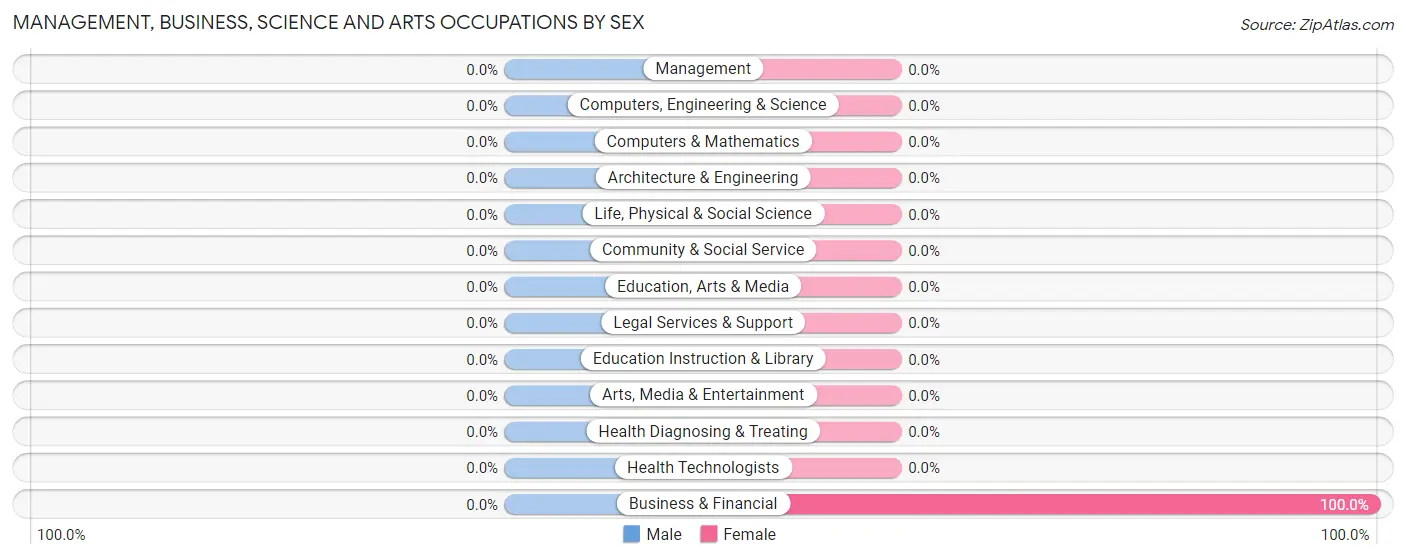
| Occupation | Male | Female |
| Management | 0 (0.0%) | 0 (0.0%) |
| Business & Financial | 0 (0.0%) | 9 (100.0%) |
| Computers, Engineering & Science | 0 (0.0%) | 0 (0.0%) |
| Computers & Mathematics | 0 (0.0%) | 0 (0.0%) |
| Architecture & Engineering | 0 (0.0%) | 0 (0.0%) |
| Life, Physical & Social Science | 0 (0.0%) | 0 (0.0%) |
| Community & Social Service | 0 (0.0%) | 0 (0.0%) |
| Education, Arts & Media | 0 (0.0%) | 0 (0.0%) |
| Legal Services & Support | 0 (0.0%) | 0 (0.0%) |
| Education Instruction & Library | 0 (0.0%) | 0 (0.0%) |
| Arts, Media & Entertainment | 0 (0.0%) | 0 (0.0%) |
| Health Diagnosing & Treating | 0 (0.0%) | 0 (0.0%) |
| Health Technologists | 0 (0.0%) | 0 (0.0%) |
| Total (Category) | 0 (0.0%) | 9 (100.0%) |
| Total (Overall) | 9 (7.0%) | 120 (93.0%) |
Services Occupations
The most common Services occupations in Maple Falls are , and Personal Care & Service (82 | 63.6%).
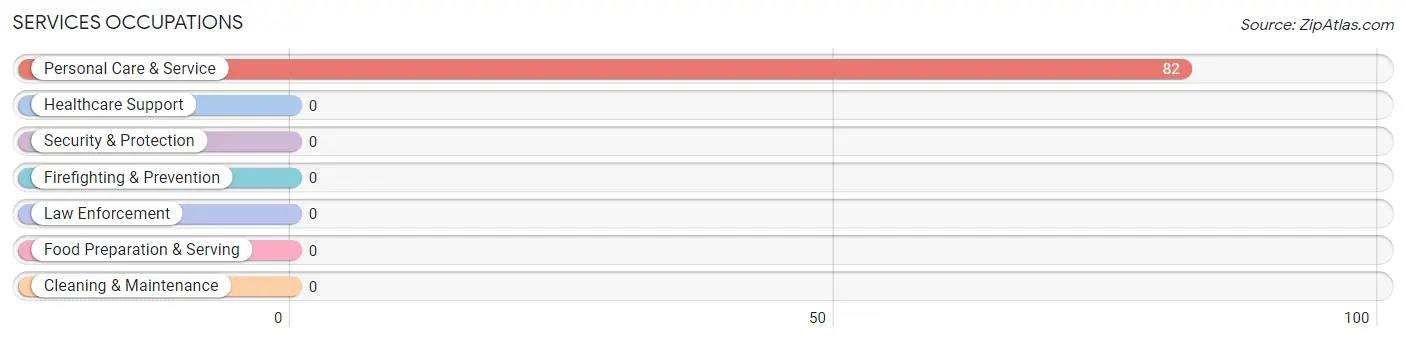
Services Occupations by Sex
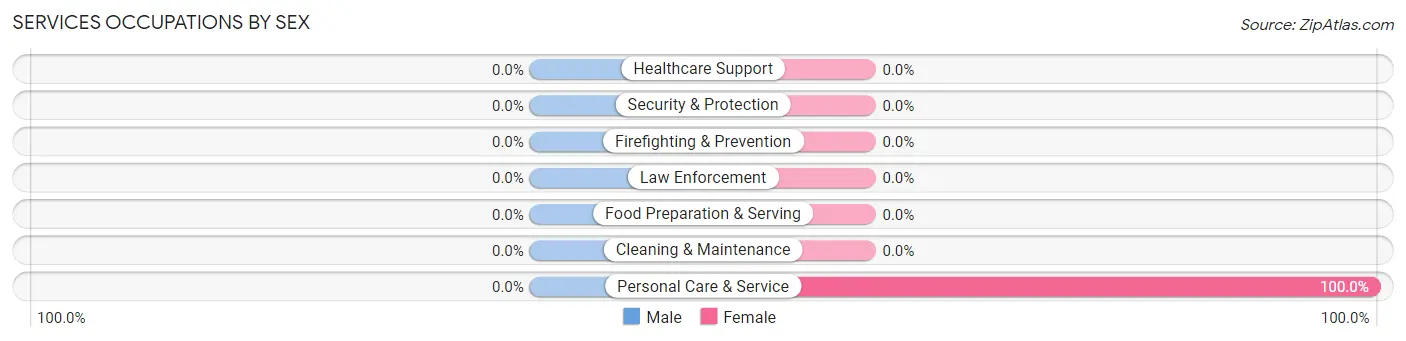
| Occupation | Male | Female |
| Healthcare Support | 0 (0.0%) | 0 (0.0%) |
| Security & Protection | 0 (0.0%) | 0 (0.0%) |
| Firefighting & Prevention | 0 (0.0%) | 0 (0.0%) |
| Law Enforcement | 0 (0.0%) | 0 (0.0%) |
| Food Preparation & Serving | 0 (0.0%) | 0 (0.0%) |
| Cleaning & Maintenance | 0 (0.0%) | 0 (0.0%) |
| Personal Care & Service | 0 (0.0%) | 82 (100.0%) |
| Total (Category) | 0 (0.0%) | 82 (100.0%) |
| Total (Overall) | 9 (7.0%) | 120 (93.0%) |
Sales and Office Occupations
The most common Sales and Office occupations in Maple Falls are , and Office & Administration (29 | 22.5%).
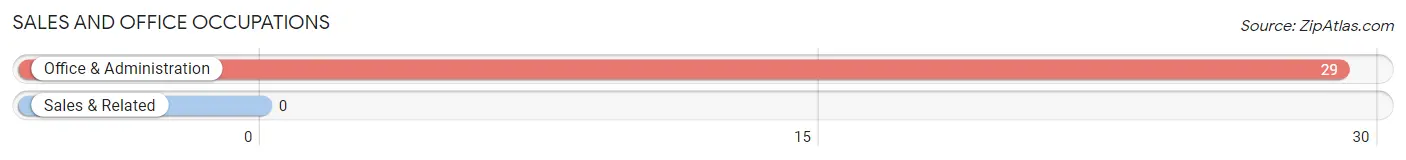
Sales and Office Occupations by Sex
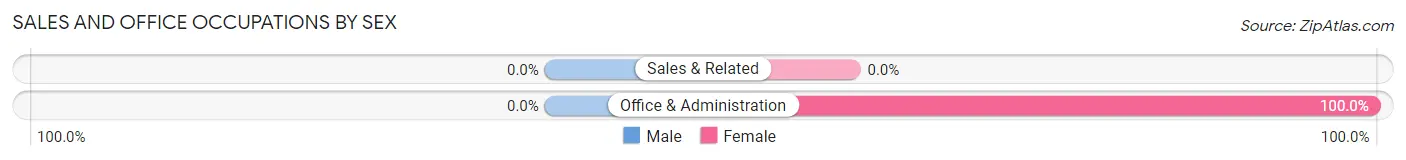
| Occupation | Male | Female |
| Sales & Related | 0 (0.0%) | 0 (0.0%) |
| Office & Administration | 0 (0.0%) | 29 (100.0%) |
| Total (Category) | 0 (0.0%) | 29 (100.0%) |
| Total (Overall) | 9 (7.0%) | 120 (93.0%) |
Natural Resources, Construction and Maintenance Occupations
The most common Natural Resources, Construction and Maintenance occupations in Maple Falls are , and Installation, Maintenance & Repair (9 | 7.0%).
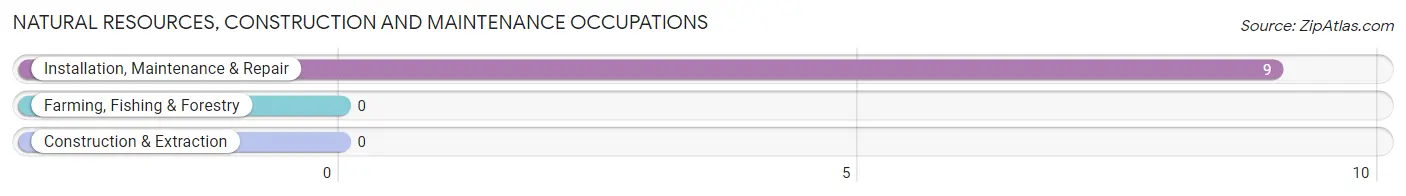
Natural Resources, Construction and Maintenance Occupations by Sex
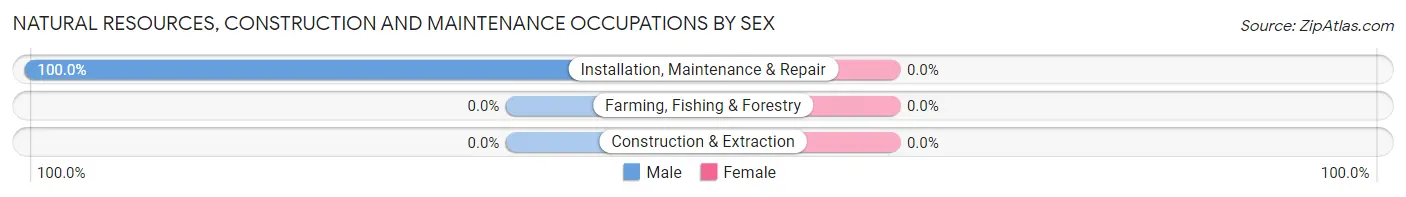
| Occupation | Male | Female |
| Farming, Fishing & Forestry | 0 (0.0%) | 0 (0.0%) |
| Construction & Extraction | 0 (0.0%) | 0 (0.0%) |
| Installation, Maintenance & Repair | 9 (100.0%) | 0 (0.0%) |
| Total (Category) | 9 (100.0%) | 0 (0.0%) |
| Total (Overall) | 9 (7.0%) | 120 (93.0%) |
Production, Transportation and Moving Occupations
Production, Transportation and Moving Occupations by Sex
| Occupation | Male | Female |
| Production | 0 (0.0%) | 0 (0.0%) |
| Transportation | 0 (0.0%) | 0 (0.0%) |
| Material Moving | 0 (0.0%) | 0 (0.0%) |
| Total (Category) | 0 (0.0%) | 0 (0.0%) |
| Total (Overall) | 9 (7.0%) | 120 (93.0%) |
Employment Industries by Sex in Maple Falls
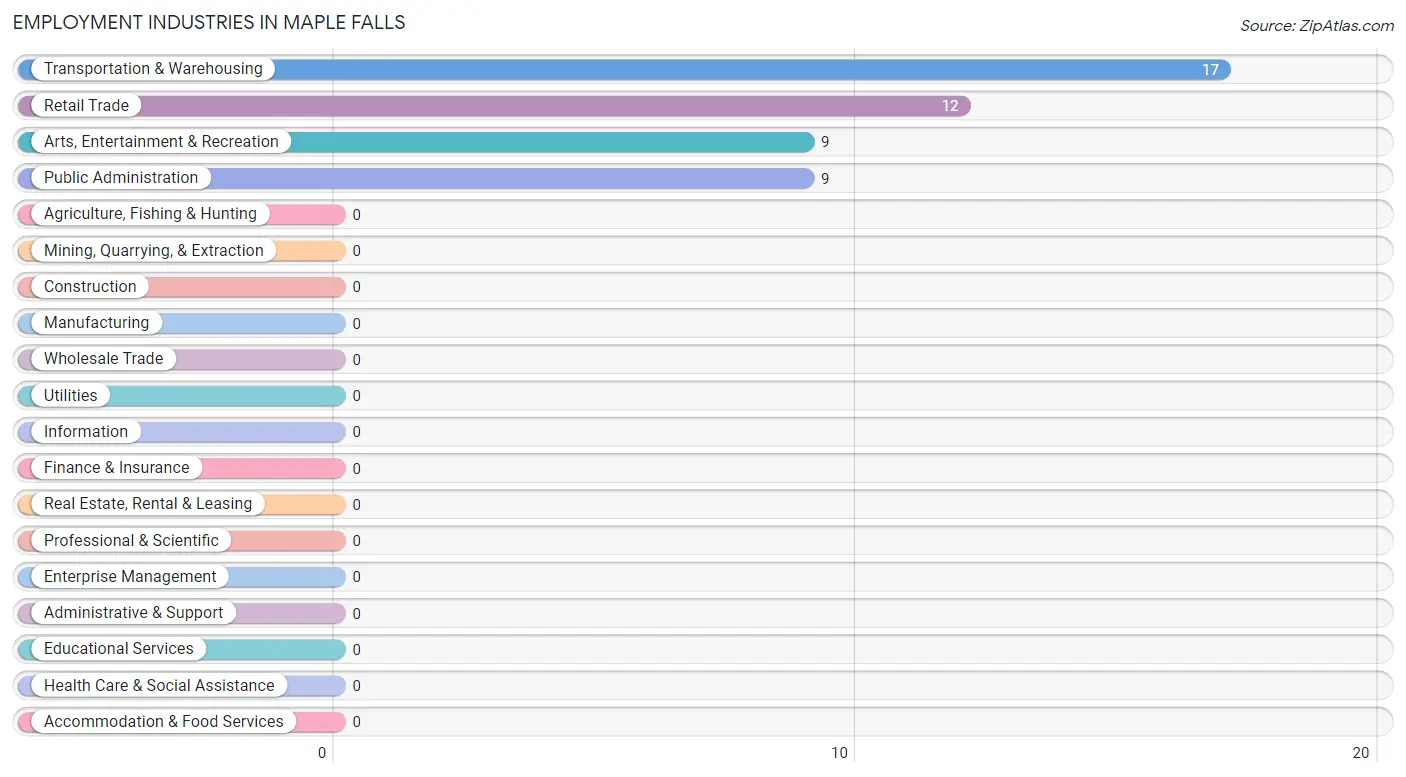
Employment Industries in Maple Falls
The major employment industries in Maple Falls include Transportation & Warehousing (17 | 13.2%), Retail Trade (12 | 9.3%), Arts, Entertainment & Recreation (9 | 7.0%), and Public Administration (9 | 7.0%).
Employment Industries by Sex in Maple Falls
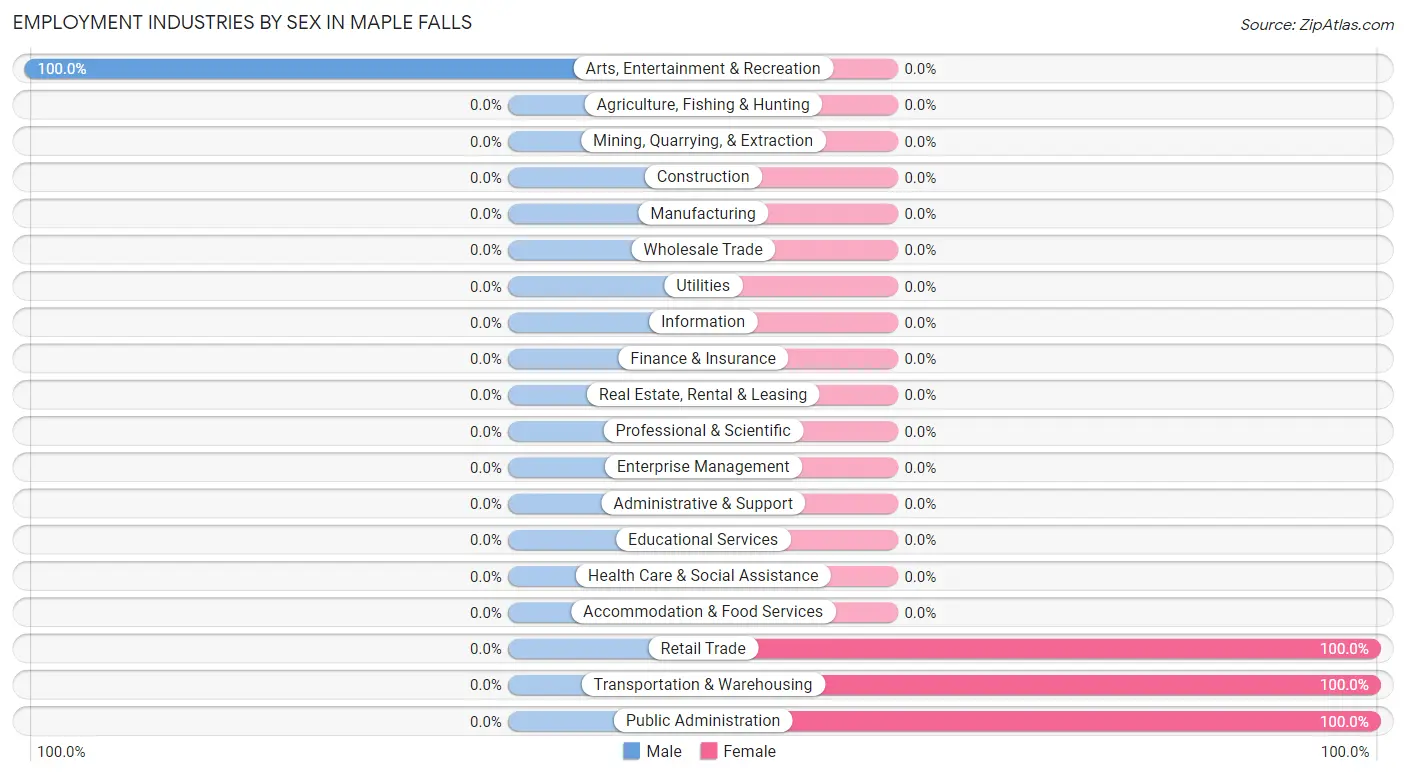
| Industry | Male | Female |
| Agriculture, Fishing & Hunting | 0 (0.0%) | 0 (0.0%) |
| Mining, Quarrying, & Extraction | 0 (0.0%) | 0 (0.0%) |
| Construction | 0 (0.0%) | 0 (0.0%) |
| Manufacturing | 0 (0.0%) | 0 (0.0%) |
| Wholesale Trade | 0 (0.0%) | 0 (0.0%) |
| Retail Trade | 0 (0.0%) | 12 (100.0%) |
| Transportation & Warehousing | 0 (0.0%) | 17 (100.0%) |
| Utilities | 0 (0.0%) | 0 (0.0%) |
| Information | 0 (0.0%) | 0 (0.0%) |
| Finance & Insurance | 0 (0.0%) | 0 (0.0%) |
| Real Estate, Rental & Leasing | 0 (0.0%) | 0 (0.0%) |
| Professional & Scientific | 0 (0.0%) | 0 (0.0%) |
| Enterprise Management | 0 (0.0%) | 0 (0.0%) |
| Administrative & Support | 0 (0.0%) | 0 (0.0%) |
| Educational Services | 0 (0.0%) | 0 (0.0%) |
| Health Care & Social Assistance | 0 (0.0%) | 0 (0.0%) |
| Arts, Entertainment & Recreation | 9 (100.0%) | 0 (0.0%) |
| Accommodation & Food Services | 0 (0.0%) | 0 (0.0%) |
| Public Administration | 0 (0.0%) | 9 (100.0%) |
| Total | 9 (7.0%) | 120 (93.0%) |
Education in Maple Falls
School Enrollment in Maple Falls
| School Level | # Students | % Students |
| Nursery / Preschool | 0 | 0.0% |
| Kindergarten | 0 | 0.0% |
| Elementary School | 0 | 0.0% |
| Middle School | 0 | 0.0% |
| High School | 0 | 0.0% |
| College / Undergraduate | 0 | 0.0% |
| Graduate / Professional | 0 | 0.0% |
| Total | 0 | 0.0% |
School Enrollment by Age by Funding Source in Maple Falls
| Age Bracket | Public School | Private School |
| 3 to 4 Year Olds | 0 (0.0%) | 0 (0.0%) |
| 5 to 9 Year Old | 0 (0.0%) | 0 (0.0%) |
| 10 to 14 Year Olds | 0 (0.0%) | 0 (0.0%) |
| 15 to 17 Year Olds | 0 (0.0%) | 0 (0.0%) |
| 18 to 19 Year Olds | 0 (0.0%) | 0 (0.0%) |
| 20 to 24 Year Olds | 0 (0.0%) | 0 (0.0%) |
| 25 to 34 Year Olds | 0 (0.0%) | 0 (0.0%) |
| 35 Years and over | 0 (0.0%) | 0 (0.0%) |
| Total | 0 (0.0%) | 0 (0.0%) |
Educational Attainment by Field of Study in Maple Falls
Liberal arts & history (11 | 55.0%), and science & technology (9 | 45.0%) are the most common fields of study among 20 individuals in Maple Falls who have obtained a bachelor's degree or higher.
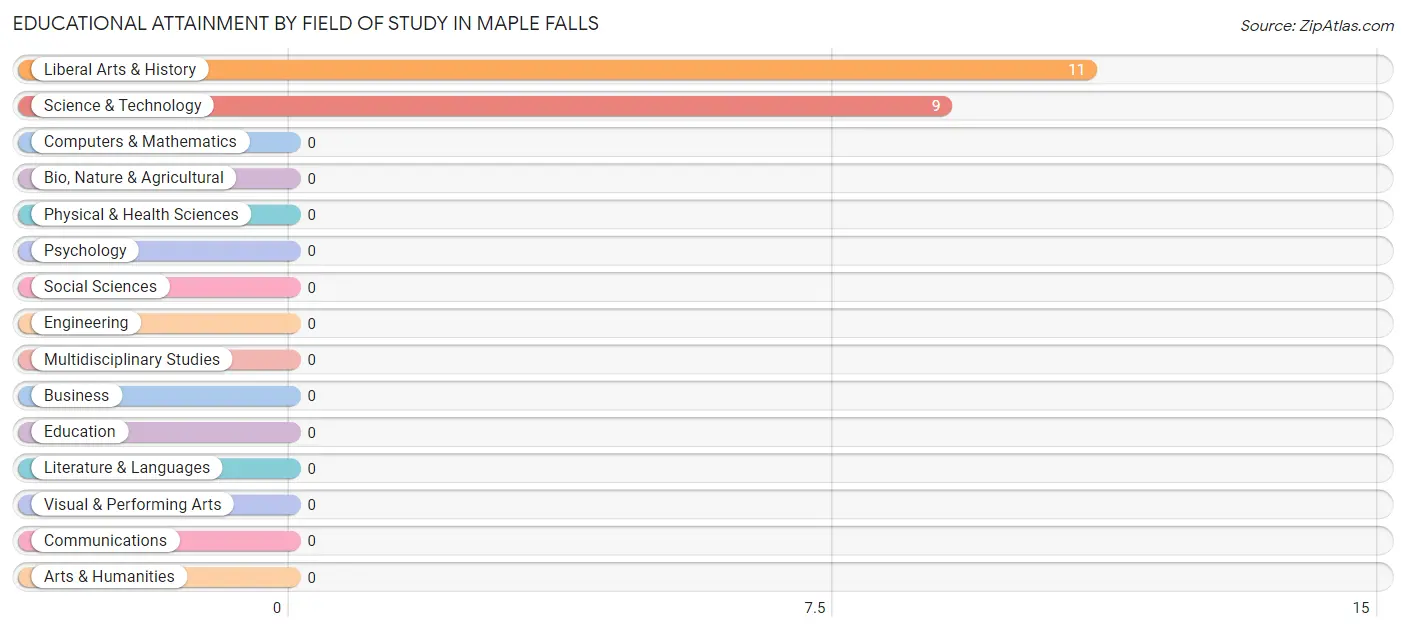
| Field of Study | # Graduates | % Graduates |
| Computers & Mathematics | 0 | 0.0% |
| Bio, Nature & Agricultural | 0 | 0.0% |
| Physical & Health Sciences | 0 | 0.0% |
| Psychology | 0 | 0.0% |
| Social Sciences | 0 | 0.0% |
| Engineering | 0 | 0.0% |
| Multidisciplinary Studies | 0 | 0.0% |
| Science & Technology | 9 | 45.0% |
| Business | 0 | 0.0% |
| Education | 0 | 0.0% |
| Literature & Languages | 0 | 0.0% |
| Liberal Arts & History | 11 | 55.0% |
| Visual & Performing Arts | 0 | 0.0% |
| Communications | 0 | 0.0% |
| Arts & Humanities | 0 | 0.0% |
| Total | 20 | 100.0% |
Transportation & Commute in Maple Falls
Vehicle Availability by Sex in Maple Falls
The most prevalent vehicle ownership categories in Maple Falls are males with 2 vehicles (9, accounting for 100.0%) and females with 2 vehicles (9, making up 7.5%).
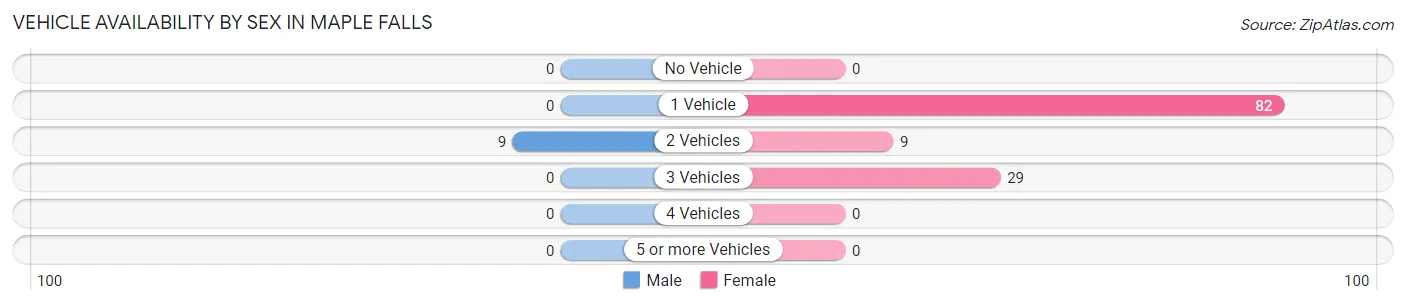
| Vehicles Available | Male | Female |
| No Vehicle | 0 (0.0%) | 0 (0.0%) |
| 1 Vehicle | 0 (0.0%) | 82 (68.3%) |
| 2 Vehicles | 9 (100.0%) | 9 (7.5%) |
| 3 Vehicles | 0 (0.0%) | 29 (24.2%) |
| 4 Vehicles | 0 (0.0%) | 0 (0.0%) |
| 5 or more Vehicles | 0 (0.0%) | 0 (0.0%) |
| Total | 9 (100.0%) | 120 (100.0%) |
Commute Time in Maple Falls
The most frequently occuring commute durations in Maple Falls are less than 5 minutes (111 commuters, 86.1%), 35 to 39 minutes (9 commuters, 7.0%), and 45 to 59 minutes (9 commuters, 7.0%).
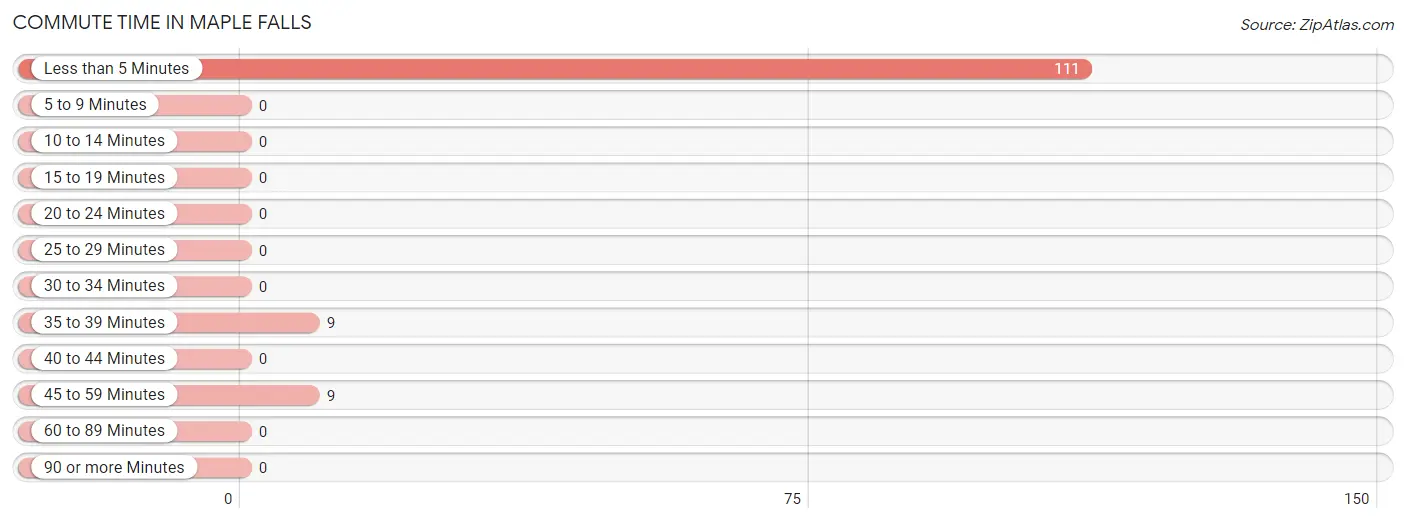
| Commute Time | # Commuters | % Commuters |
| Less than 5 Minutes | 111 | 86.1% |
| 5 to 9 Minutes | 0 | 0.0% |
| 10 to 14 Minutes | 0 | 0.0% |
| 15 to 19 Minutes | 0 | 0.0% |
| 20 to 24 Minutes | 0 | 0.0% |
| 25 to 29 Minutes | 0 | 0.0% |
| 30 to 34 Minutes | 0 | 0.0% |
| 35 to 39 Minutes | 9 | 7.0% |
| 40 to 44 Minutes | 0 | 0.0% |
| 45 to 59 Minutes | 9 | 7.0% |
| 60 to 89 Minutes | 0 | 0.0% |
| 90 or more Minutes | 0 | 0.0% |
Commute Time by Sex in Maple Falls
The most common commute times in Maple Falls are 35 to 39 minutes (9 commuters, 100.0%) for males and less than 5 minutes (111 commuters, 92.5%) for females.
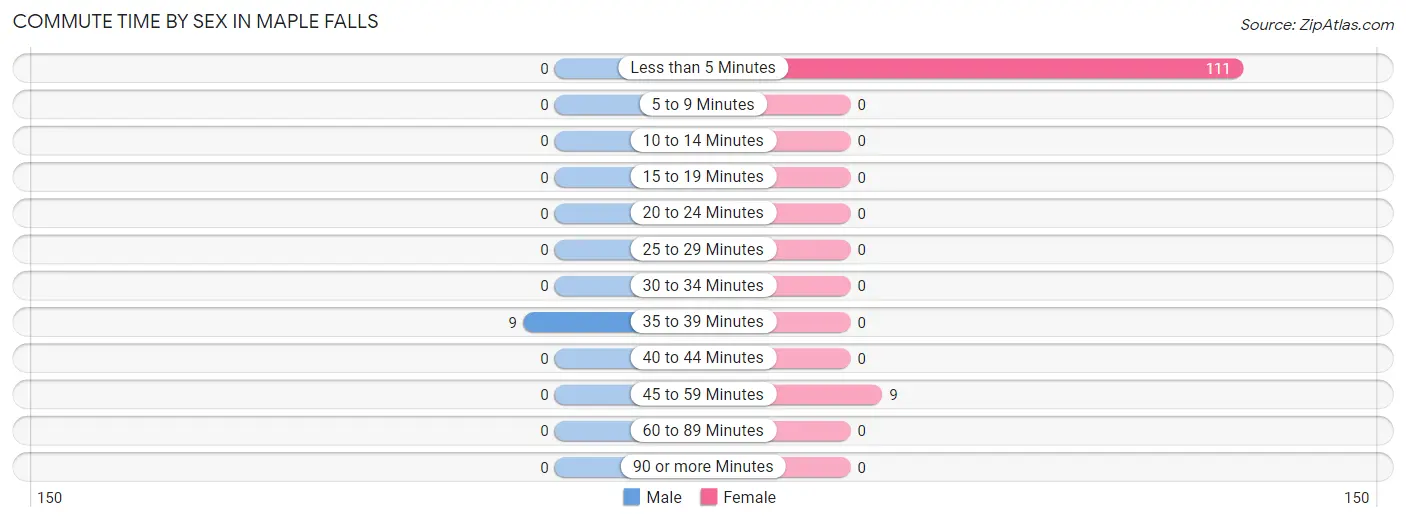
| Commute Time | Male | Female |
| Less than 5 Minutes | 0 (0.0%) | 111 (92.5%) |
| 5 to 9 Minutes | 0 (0.0%) | 0 (0.0%) |
| 10 to 14 Minutes | 0 (0.0%) | 0 (0.0%) |
| 15 to 19 Minutes | 0 (0.0%) | 0 (0.0%) |
| 20 to 24 Minutes | 0 (0.0%) | 0 (0.0%) |
| 25 to 29 Minutes | 0 (0.0%) | 0 (0.0%) |
| 30 to 34 Minutes | 0 (0.0%) | 0 (0.0%) |
| 35 to 39 Minutes | 9 (100.0%) | 0 (0.0%) |
| 40 to 44 Minutes | 0 (0.0%) | 0 (0.0%) |
| 45 to 59 Minutes | 0 (0.0%) | 9 (7.5%) |
| 60 to 89 Minutes | 0 (0.0%) | 0 (0.0%) |
| 90 or more Minutes | 0 (0.0%) | 0 (0.0%) |
Time of Departure to Work by Sex in Maple Falls
The most frequent times of departure to work in Maple Falls are 5:00 AM to 5:29 AM (9, 100.0%) for males and 8:30 AM to 8:59 AM (82, 68.3%) for females.
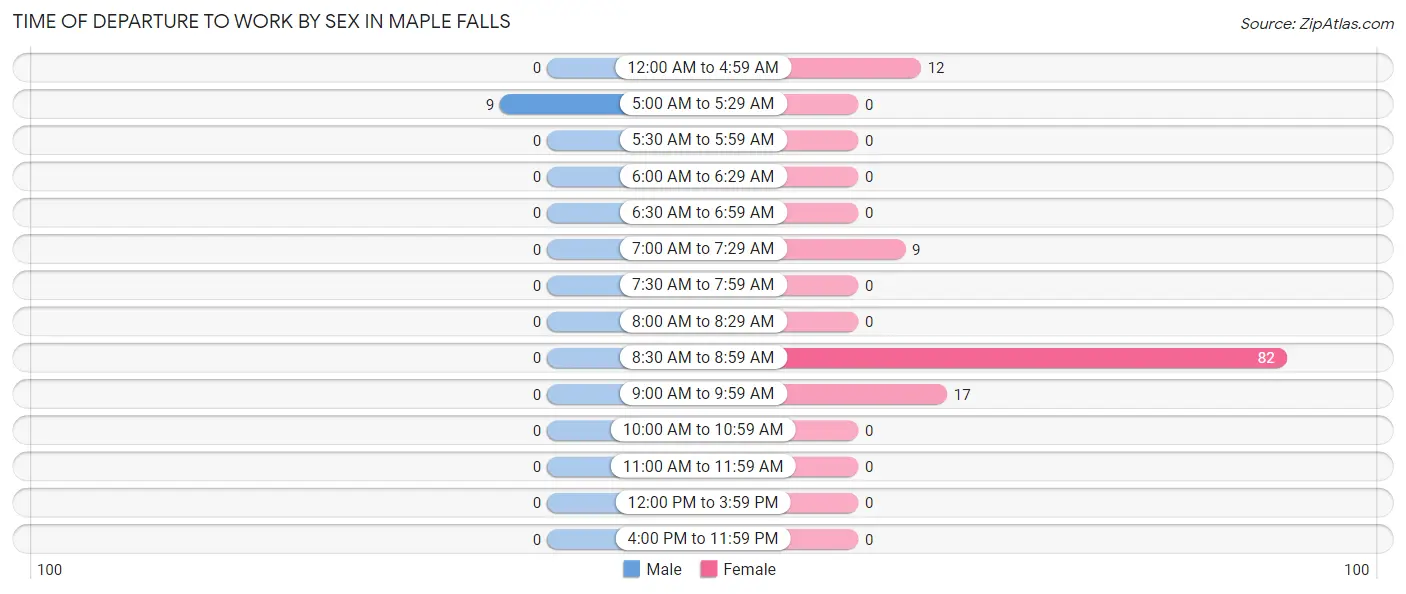
| Time of Departure | Male | Female |
| 12:00 AM to 4:59 AM | 0 (0.0%) | 12 (10.0%) |
| 5:00 AM to 5:29 AM | 9 (100.0%) | 0 (0.0%) |
| 5:30 AM to 5:59 AM | 0 (0.0%) | 0 (0.0%) |
| 6:00 AM to 6:29 AM | 0 (0.0%) | 0 (0.0%) |
| 6:30 AM to 6:59 AM | 0 (0.0%) | 0 (0.0%) |
| 7:00 AM to 7:29 AM | 0 (0.0%) | 9 (7.5%) |
| 7:30 AM to 7:59 AM | 0 (0.0%) | 0 (0.0%) |
| 8:00 AM to 8:29 AM | 0 (0.0%) | 0 (0.0%) |
| 8:30 AM to 8:59 AM | 0 (0.0%) | 82 (68.3%) |
| 9:00 AM to 9:59 AM | 0 (0.0%) | 17 (14.2%) |
| 10:00 AM to 10:59 AM | 0 (0.0%) | 0 (0.0%) |
| 11:00 AM to 11:59 AM | 0 (0.0%) | 0 (0.0%) |
| 12:00 PM to 3:59 PM | 0 (0.0%) | 0 (0.0%) |
| 4:00 PM to 11:59 PM | 0 (0.0%) | 0 (0.0%) |
| Total | 9 (100.0%) | 120 (100.0%) |
Housing Occupancy in Maple Falls
Occupancy by Ownership in Maple Falls
Of the total 146 dwellings in Maple Falls, owner-occupied units account for 146 (100.0%), while renter-occupied units make up 0 (0.0%).
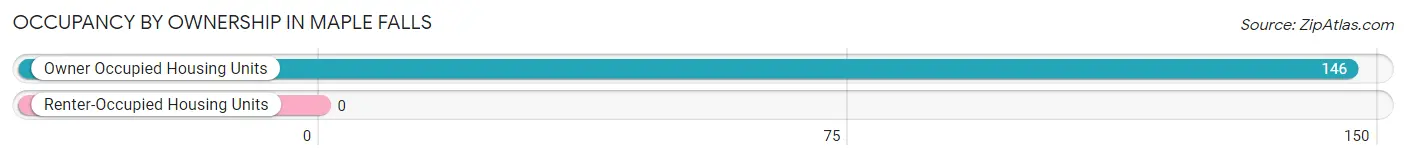
| Occupancy | # Housing Units | % Housing Units |
| Owner Occupied Housing Units | 146 | 100.0% |
| Renter-Occupied Housing Units | 0 | 0.0% |
| Total Occupied Housing Units | 146 | 100.0% |
Occupancy by Household Size in Maple Falls
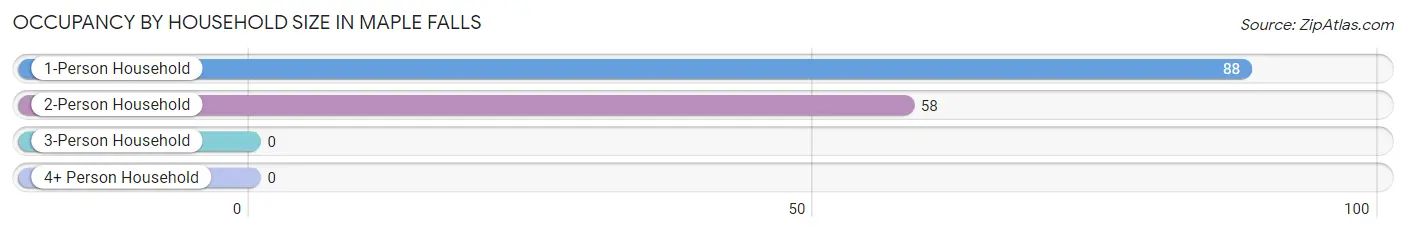
| Household Size | # Housing Units | % Housing Units |
| 1-Person Household | 88 | 60.3% |
| 2-Person Household | 58 | 39.7% |
| 3-Person Household | 0 | 0.0% |
| 4+ Person Household | 0 | 0.0% |
| Total Housing Units | 146 | 100.0% |
Occupancy by Ownership by Household Size in Maple Falls
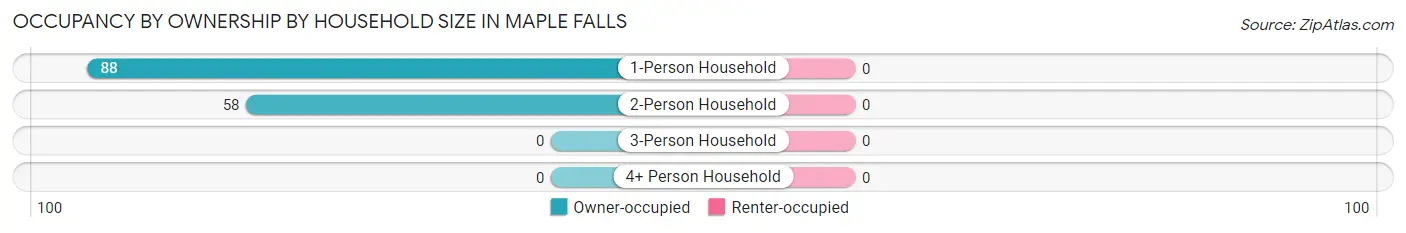
| Household Size | Owner-occupied | Renter-occupied |
| 1-Person Household | 88 (100.0%) | 0 (0.0%) |
| 2-Person Household | 58 (100.0%) | 0 (0.0%) |
| 3-Person Household | 0 (0.0%) | 0 (0.0%) |
| 4+ Person Household | 0 (0.0%) | 0 (0.0%) |
| Total Housing Units | 146 (100.0%) | 0 (0.0%) |
Occupancy by Educational Attainment in Maple Falls
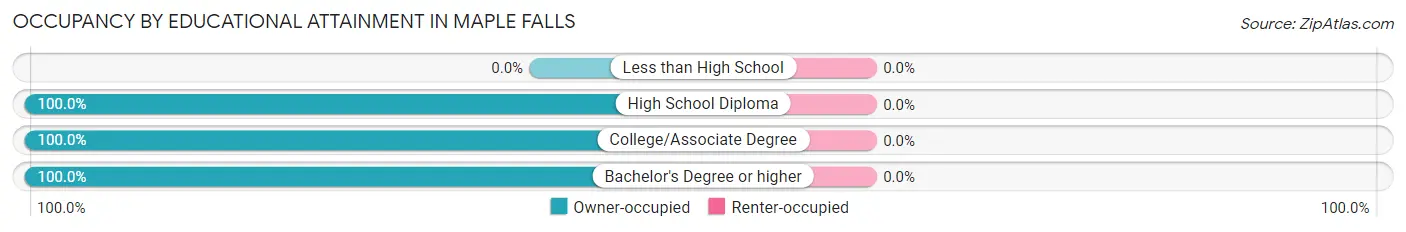
| Household Size | Owner-occupied | Renter-occupied |
| Less than High School | 0 (0.0%) | 0 (0.0%) |
| High School Diploma | 95 (100.0%) | 0 (0.0%) |
| College/Associate Degree | 40 (100.0%) | 0 (0.0%) |
| Bachelor's Degree or higher | 11 (100.0%) | 0 (0.0%) |
Occupancy by Age of Householder in Maple Falls
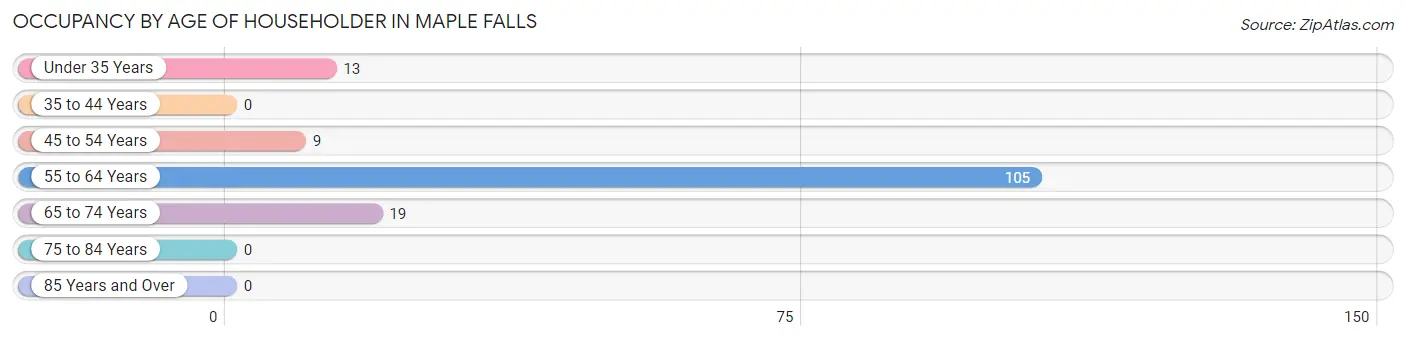
| Age Bracket | # Households | % Households |
| Under 35 Years | 13 | 8.9% |
| 35 to 44 Years | 0 | 0.0% |
| 45 to 54 Years | 9 | 6.2% |
| 55 to 64 Years | 105 | 71.9% |
| 65 to 74 Years | 19 | 13.0% |
| 75 to 84 Years | 0 | 0.0% |
| 85 Years and Over | 0 | 0.0% |
| Total | 146 | 100.0% |
Housing Finances in Maple Falls
Median Income by Occupancy in Maple Falls
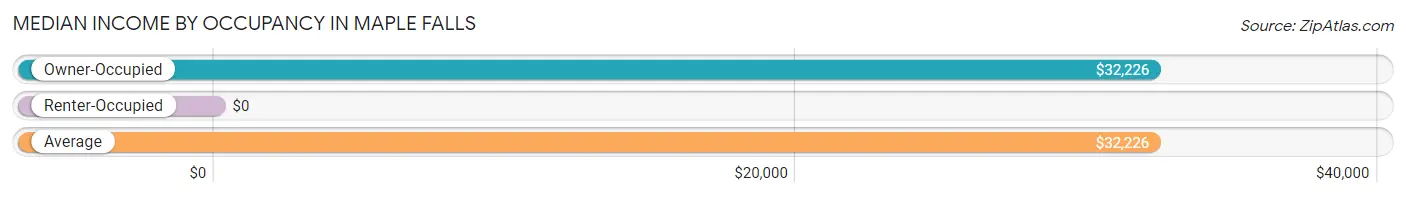
| Occupancy Type | # Households | Median Income |
| Owner-Occupied | 146 (100.0%) | $32,226 |
| Renter-Occupied | 0 (0.0%) | $0 |
| Average | 146 (100.0%) | $32,226 |
Occupancy by Householder Income Bracket in Maple Falls
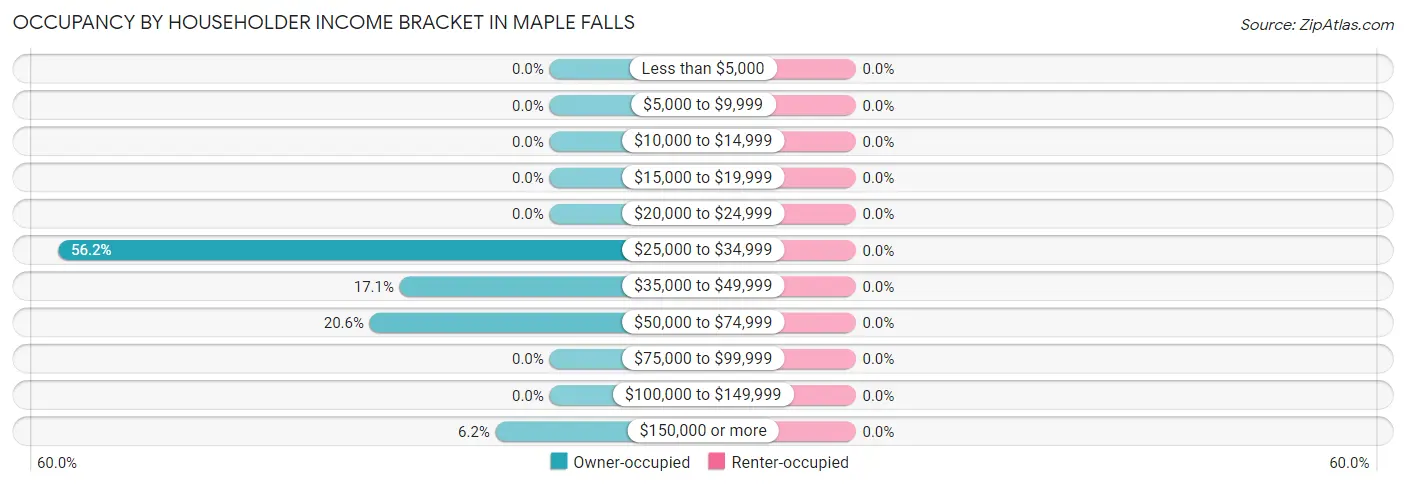
| Income Bracket | Owner-occupied | Renter-occupied |
| Less than $5,000 | 0 (0.0%) | 0 (0.0%) |
| $5,000 to $9,999 | 0 (0.0%) | 0 (0.0%) |
| $10,000 to $14,999 | 0 (0.0%) | 0 (0.0%) |
| $15,000 to $19,999 | 0 (0.0%) | 0 (0.0%) |
| $20,000 to $24,999 | 0 (0.0%) | 0 (0.0%) |
| $25,000 to $34,999 | 82 (56.2%) | 0 (0.0%) |
| $35,000 to $49,999 | 25 (17.1%) | 0 (0.0%) |
| $50,000 to $74,999 | 30 (20.5%) | 0 (0.0%) |
| $75,000 to $99,999 | 0 (0.0%) | 0 (0.0%) |
| $100,000 to $149,999 | 0 (0.0%) | 0 (0.0%) |
| $150,000 or more | 9 (6.2%) | 0 (0.0%) |
| Total | 146 (100.0%) | 0 (0.0%) |
Monthly Housing Cost Tiers in Maple Falls
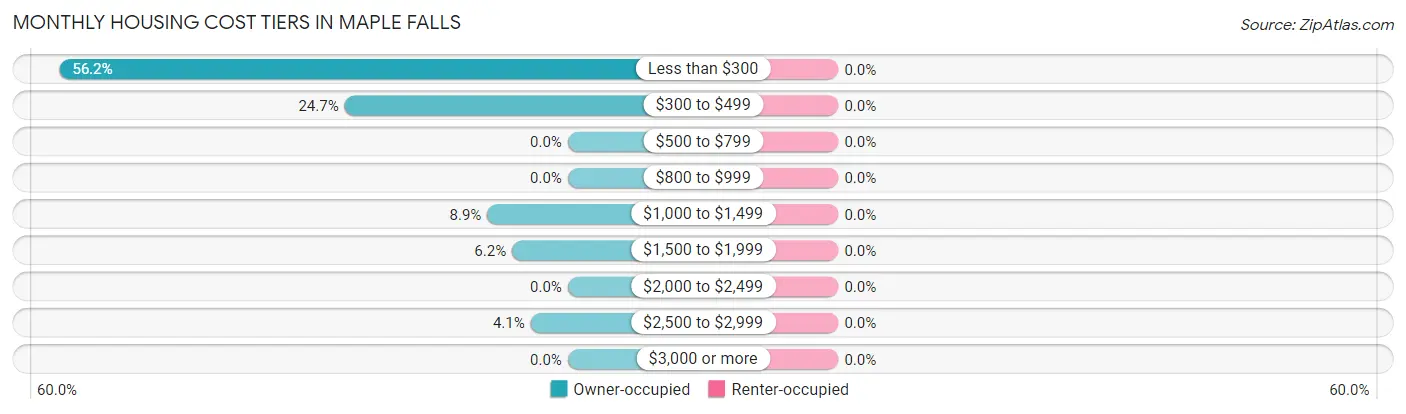
| Monthly Cost | Owner-occupied | Renter-occupied |
| Less than $300 | 82 (56.2%) | 0 (0.0%) |
| $300 to $499 | 36 (24.7%) | 0 (0.0%) |
| $500 to $799 | 0 (0.0%) | 0 (0.0%) |
| $800 to $999 | 0 (0.0%) | 0 (0.0%) |
| $1,000 to $1,499 | 13 (8.9%) | 0 (0.0%) |
| $1,500 to $1,999 | 9 (6.2%) | 0 (0.0%) |
| $2,000 to $2,499 | 0 (0.0%) | 0 (0.0%) |
| $2,500 to $2,999 | 6 (4.1%) | 0 (0.0%) |
| $3,000 or more | 0 (0.0%) | 0 (0.0%) |
| Total | 146 (100.0%) | 0 (0.0%) |
Physical Housing Characteristics in Maple Falls
Housing Structures in Maple Falls
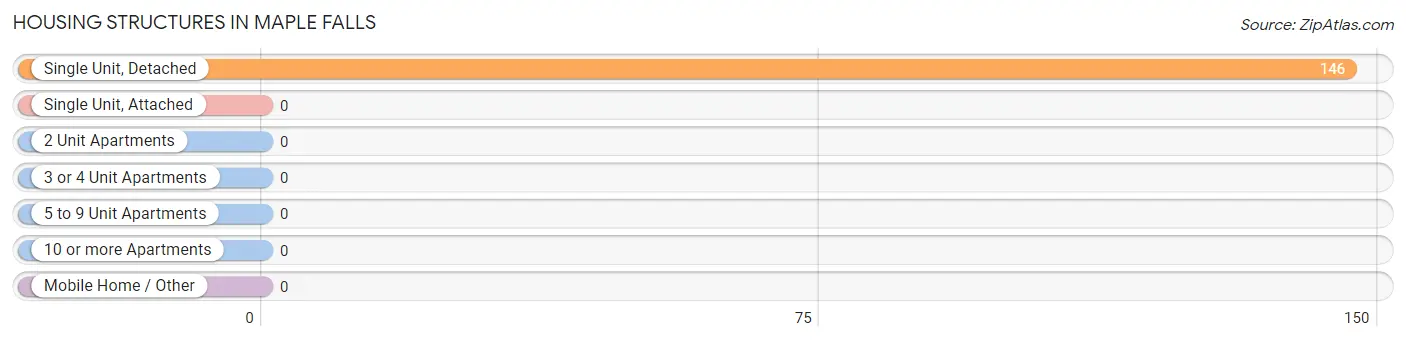
| Structure Type | # Housing Units | % Housing Units |
| Single Unit, Detached | 146 | 100.0% |
| Single Unit, Attached | 0 | 0.0% |
| 2 Unit Apartments | 0 | 0.0% |
| 3 or 4 Unit Apartments | 0 | 0.0% |
| 5 to 9 Unit Apartments | 0 | 0.0% |
| 10 or more Apartments | 0 | 0.0% |
| Mobile Home / Other | 0 | 0.0% |
| Total | 146 | 100.0% |
Housing Structures by Occupancy in Maple Falls
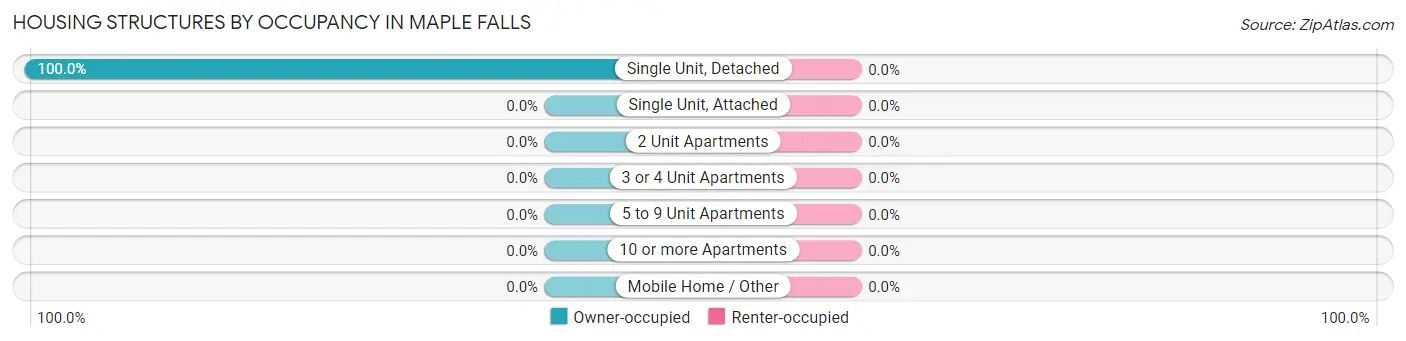
| Structure Type | Owner-occupied | Renter-occupied |
| Single Unit, Detached | 146 (100.0%) | 0 (0.0%) |
| Single Unit, Attached | 0 (0.0%) | 0 (0.0%) |
| 2 Unit Apartments | 0 (0.0%) | 0 (0.0%) |
| 3 or 4 Unit Apartments | 0 (0.0%) | 0 (0.0%) |
| 5 to 9 Unit Apartments | 0 (0.0%) | 0 (0.0%) |
| 10 or more Apartments | 0 (0.0%) | 0 (0.0%) |
| Mobile Home / Other | 0 (0.0%) | 0 (0.0%) |
| Total | 146 (100.0%) | 0 (0.0%) |
Housing Structures by Number of Rooms in Maple Falls
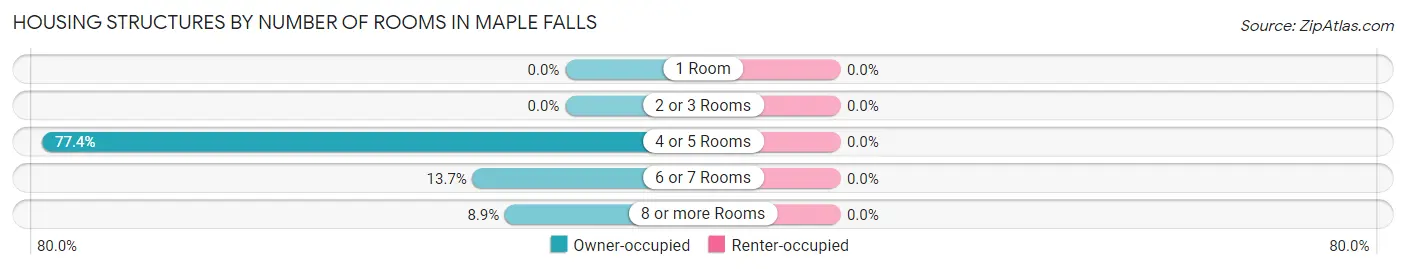
| Number of Rooms | Owner-occupied | Renter-occupied |
| 1 Room | 0 (0.0%) | 0 (0.0%) |
| 2 or 3 Rooms | 0 (0.0%) | 0 (0.0%) |
| 4 or 5 Rooms | 113 (77.4%) | 0 (0.0%) |
| 6 or 7 Rooms | 20 (13.7%) | 0 (0.0%) |
| 8 or more Rooms | 13 (8.9%) | 0 (0.0%) |
| Total | 146 (100.0%) | 0 (0.0%) |
Housing Structure by Heating Type in Maple Falls
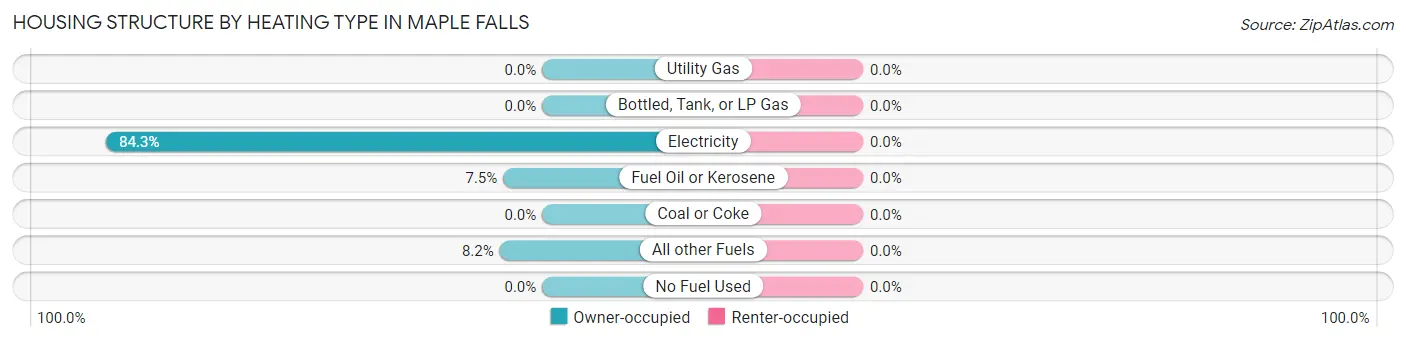
| Heating Type | Owner-occupied | Renter-occupied |
| Utility Gas | 0 (0.0%) | 0 (0.0%) |
| Bottled, Tank, or LP Gas | 0 (0.0%) | 0 (0.0%) |
| Electricity | 123 (84.3%) | 0 (0.0%) |
| Fuel Oil or Kerosene | 11 (7.5%) | 0 (0.0%) |
| Coal or Coke | 0 (0.0%) | 0 (0.0%) |
| All other Fuels | 12 (8.2%) | 0 (0.0%) |
| No Fuel Used | 0 (0.0%) | 0 (0.0%) |
| Total | 146 (100.0%) | 0 (0.0%) |
Household Vehicle Usage in Maple Falls
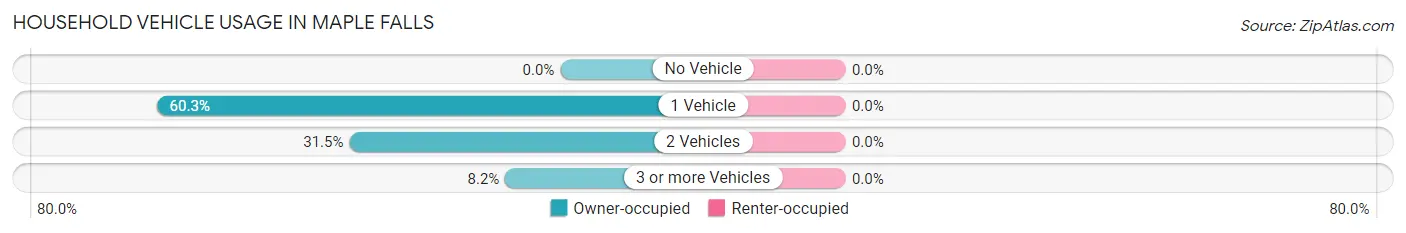
| Vehicles per Household | Owner-occupied | Renter-occupied |
| No Vehicle | 0 (0.0%) | 0 (0.0%) |
| 1 Vehicle | 88 (60.3%) | 0 (0.0%) |
| 2 Vehicles | 46 (31.5%) | 0 (0.0%) |
| 3 or more Vehicles | 12 (8.2%) | 0 (0.0%) |
| Total | 146 (100.0%) | 0 (0.0%) |
Real Estate & Mortgages in Maple Falls
Real Estate and Mortgage Overview in Maple Falls
| Characteristic | Without Mortgage | With Mortgage |
| Housing Units | 118 | 28 |
| Median Property Value | $623,700 | $0 |
| Median Household Income | $31,799 | $9 |
| Monthly Housing Costs | $286 | $0 |
| Real Estate Taxes | $944 | $0 |
Property Value by Mortgage Status in Maple Falls
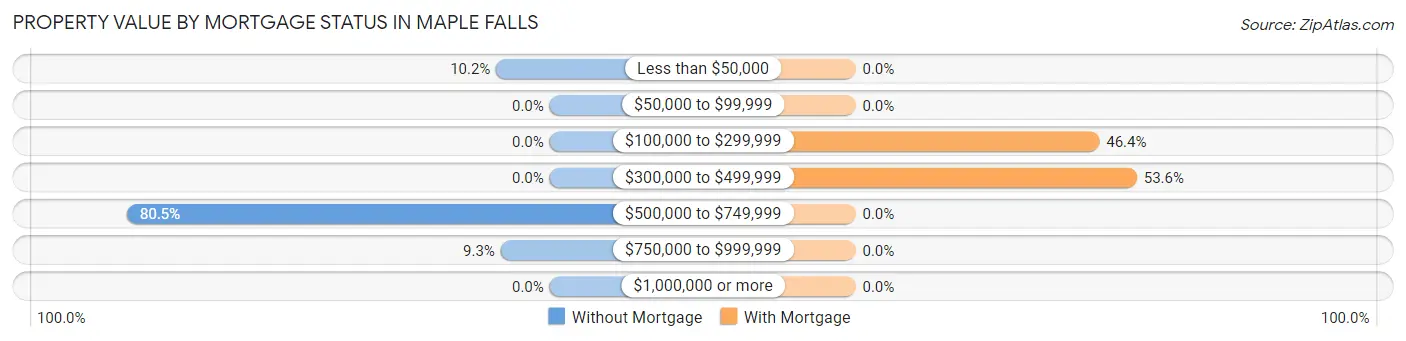
| Property Value | Without Mortgage | With Mortgage |
| Less than $50,000 | 12 (10.2%) | 0 (0.0%) |
| $50,000 to $99,999 | 0 (0.0%) | 0 (0.0%) |
| $100,000 to $299,999 | 0 (0.0%) | 13 (46.4%) |
| $300,000 to $499,999 | 0 (0.0%) | 15 (53.6%) |
| $500,000 to $749,999 | 95 (80.5%) | 0 (0.0%) |
| $750,000 to $999,999 | 11 (9.3%) | 0 (0.0%) |
| $1,000,000 or more | 0 (0.0%) | 0 (0.0%) |
| Total | 118 (100.0%) | 28 (100.0%) |
Household Income by Mortgage Status in Maple Falls
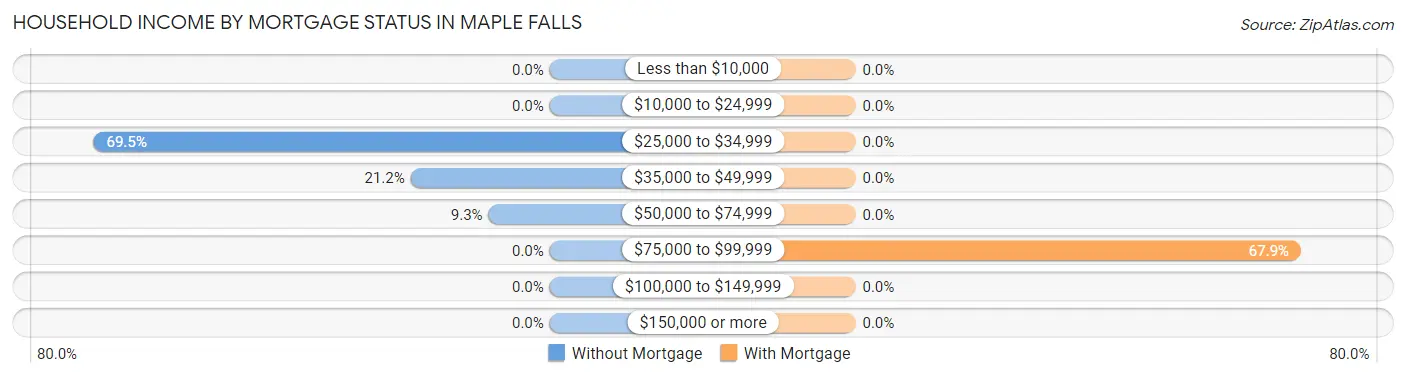
| Household Income | Without Mortgage | With Mortgage |
| Less than $10,000 | 0 (0.0%) | 0 (0.0%) |
| $10,000 to $24,999 | 0 (0.0%) | 0 (0.0%) |
| $25,000 to $34,999 | 82 (69.5%) | 0 (0.0%) |
| $35,000 to $49,999 | 25 (21.2%) | 0 (0.0%) |
| $50,000 to $74,999 | 11 (9.3%) | 0 (0.0%) |
| $75,000 to $99,999 | 0 (0.0%) | 19 (67.9%) |
| $100,000 to $149,999 | 0 (0.0%) | 0 (0.0%) |
| $150,000 or more | 0 (0.0%) | 0 (0.0%) |
| Total | 118 (100.0%) | 28 (100.0%) |
Property Value to Household Income Ratio in Maple Falls
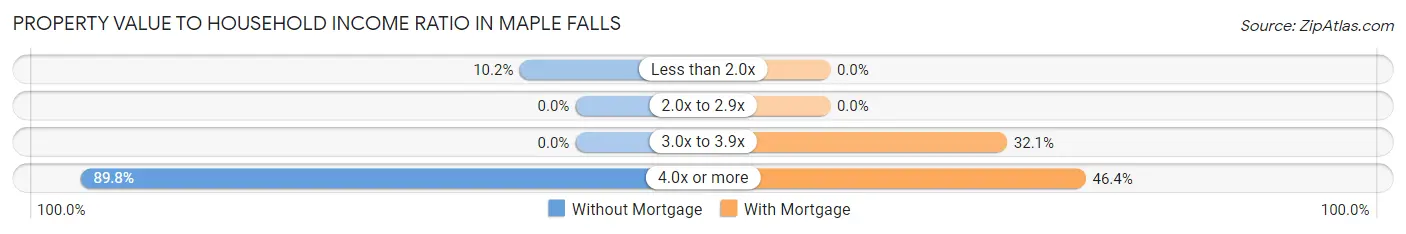
| Value-to-Income Ratio | Without Mortgage | With Mortgage |
| Less than 2.0x | 12 (10.2%) | 0 (0.0%) |
| 2.0x to 2.9x | 0 (0.0%) | 0 (0.0%) |
| 3.0x to 3.9x | 0 (0.0%) | 9 (32.1%) |
| 4.0x or more | 106 (89.8%) | 13 (46.4%) |
| Total | 118 (100.0%) | 28 (100.0%) |
Real Estate Taxes by Mortgage Status in Maple Falls
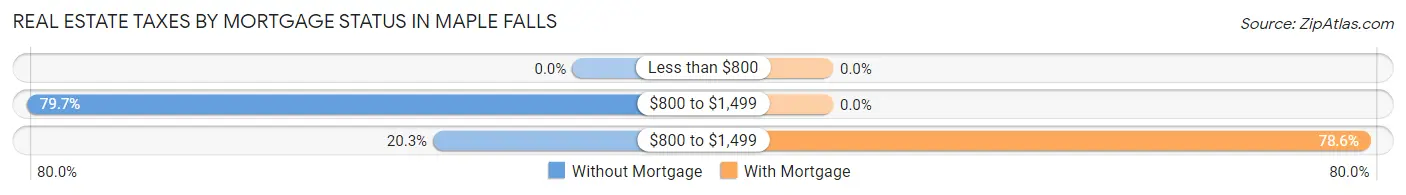
| Property Taxes | Without Mortgage | With Mortgage |
| Less than $800 | 0 (0.0%) | 0 (0.0%) |
| $800 to $1,499 | 94 (79.7%) | 0 (0.0%) |
| $800 to $1,499 | 24 (20.3%) | 22 (78.6%) |
| Total | 118 (100.0%) | 28 (100.0%) |
Health & Disability in Maple Falls
Health Insurance Coverage by Age in Maple Falls
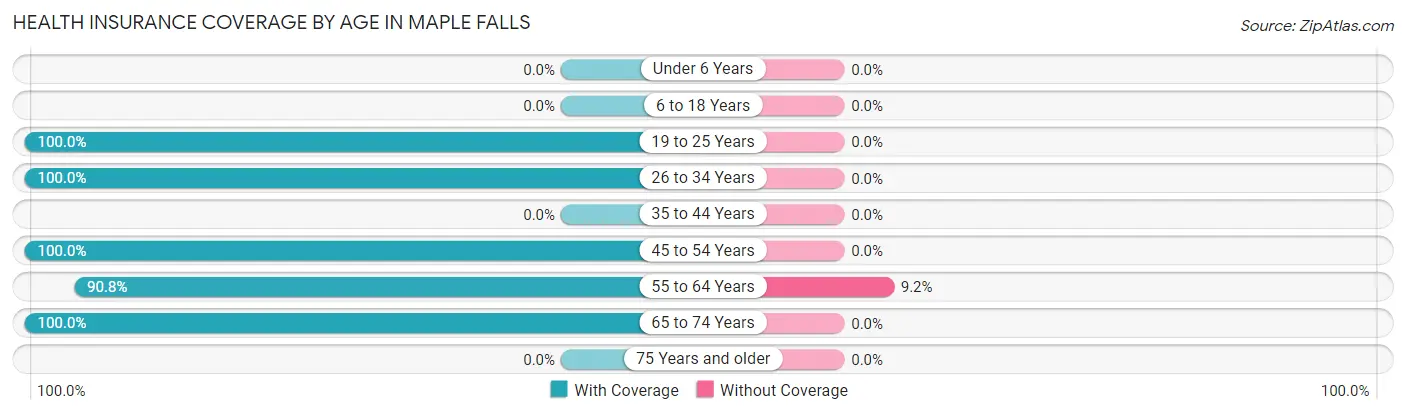
| Age Bracket | With Coverage | Without Coverage |
| Under 6 Years | 0 (0.0%) | 0 (0.0%) |
| 6 to 18 Years | 0 (0.0%) | 0 (0.0%) |
| 19 to 25 Years | 47 (100.0%) | 0 (0.0%) |
| 26 to 34 Years | 17 (100.0%) | 0 (0.0%) |
| 35 to 44 Years | 0 (0.0%) | 0 (0.0%) |
| 45 to 54 Years | 18 (100.0%) | 0 (0.0%) |
| 55 to 64 Years | 118 (90.8%) | 12 (9.2%) |
| 65 to 74 Years | 19 (100.0%) | 0 (0.0%) |
| 75 Years and older | 0 (0.0%) | 0 (0.0%) |
| Total | 219 (94.8%) | 12 (5.2%) |
Health Insurance Coverage by Citizenship Status in Maple Falls
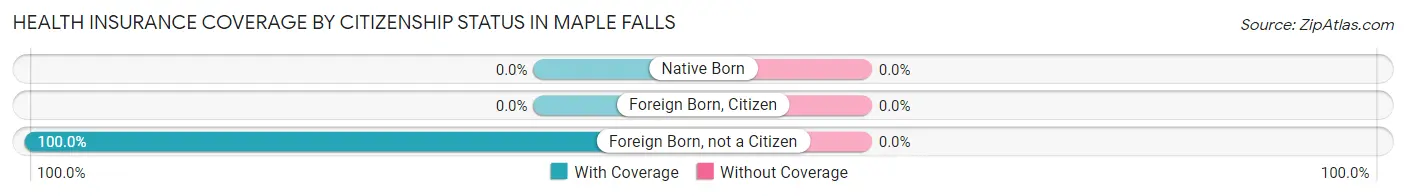
| Citizenship Status | With Coverage | Without Coverage |
| Native Born | 0 (0.0%) | 0 (0.0%) |
| Foreign Born, Citizen | 0 (0.0%) | 0 (0.0%) |
| Foreign Born, not a Citizen | 47 (100.0%) | 0 (0.0%) |
Health Insurance Coverage by Household Income in Maple Falls
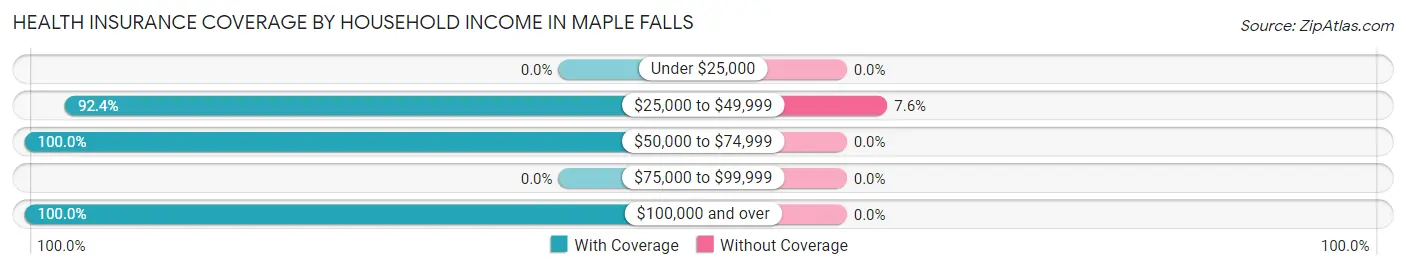
| Household Income | With Coverage | Without Coverage |
| Under $25,000 | 0 (0.0%) | 0 (0.0%) |
| $25,000 to $49,999 | 146 (92.4%) | 12 (7.6%) |
| $50,000 to $74,999 | 55 (100.0%) | 0 (0.0%) |
| $75,000 to $99,999 | 0 (0.0%) | 0 (0.0%) |
| $100,000 and over | 18 (100.0%) | 0 (0.0%) |
Public vs Private Health Insurance Coverage by Age in Maple Falls
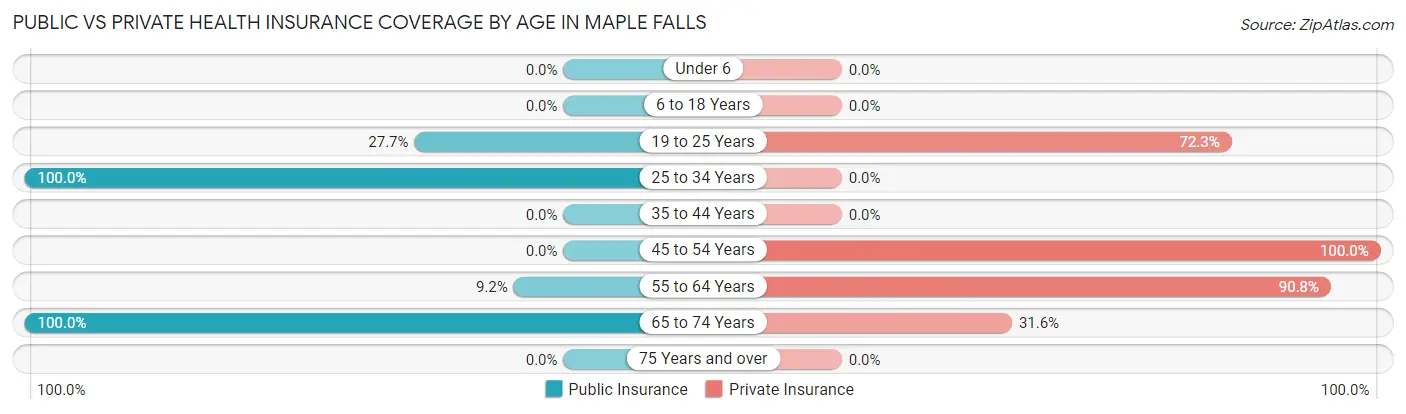
| Age Bracket | Public Insurance | Private Insurance |
| Under 6 | 0 (0.0%) | 0 (0.0%) |
| 6 to 18 Years | 0 (0.0%) | 0 (0.0%) |
| 19 to 25 Years | 13 (27.7%) | 34 (72.3%) |
| 25 to 34 Years | 17 (100.0%) | 0 (0.0%) |
| 35 to 44 Years | 0 (0.0%) | 0 (0.0%) |
| 45 to 54 Years | 0 (0.0%) | 18 (100.0%) |
| 55 to 64 Years | 12 (9.2%) | 118 (90.8%) |
| 65 to 74 Years | 19 (100.0%) | 6 (31.6%) |
| 75 Years and over | 0 (0.0%) | 0 (0.0%) |
| Total | 61 (26.4%) | 176 (76.2%) |
Disability Status by Sex by Age in Maple Falls
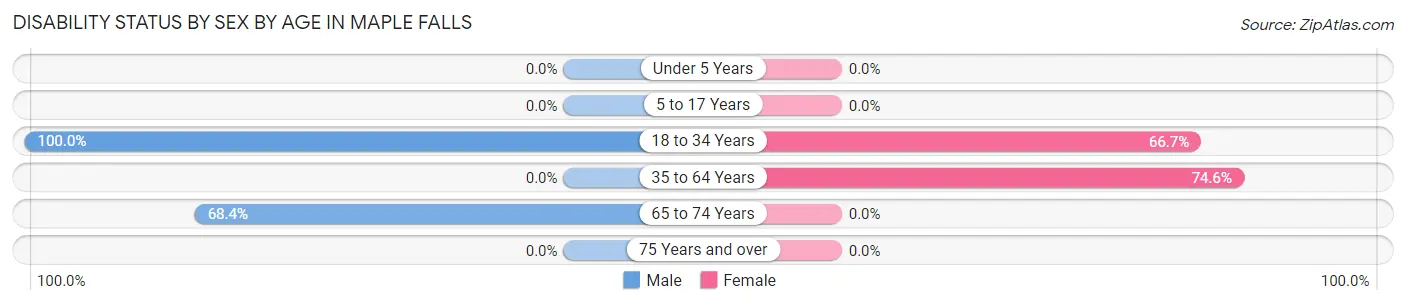
| Age Bracket | Male | Female |
| Under 5 Years | 0 (0.0%) | 0 (0.0%) |
| 5 to 17 Years | 0 (0.0%) | 0 (0.0%) |
| 18 to 34 Years | 13 (100.0%) | 34 (66.7%) |
| 35 to 64 Years | 0 (0.0%) | 94 (74.6%) |
| 65 to 74 Years | 13 (68.4%) | 0 (0.0%) |
| 75 Years and over | 0 (0.0%) | 0 (0.0%) |
Disability Class by Sex by Age in Maple Falls
Disability Class: Hearing Difficulty
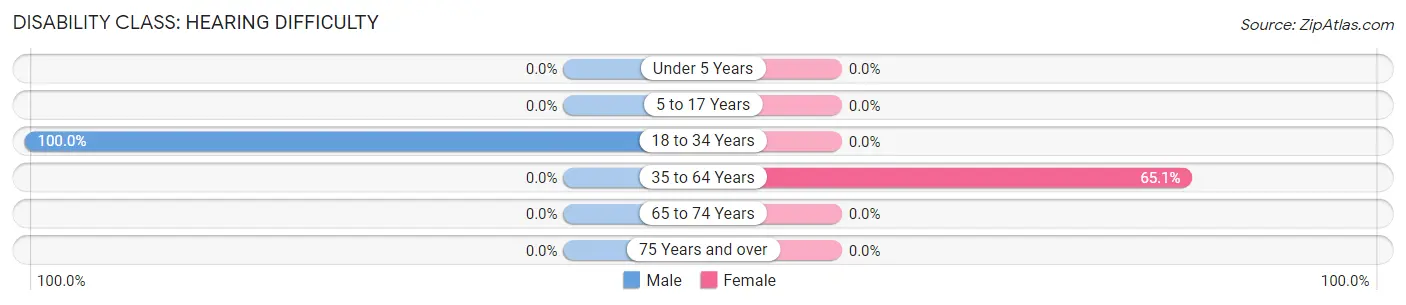
| Age Bracket | Male | Female |
| Under 5 Years | 0 (0.0%) | 0 (0.0%) |
| 5 to 17 Years | 0 (0.0%) | 0 (0.0%) |
| 18 to 34 Years | 13 (100.0%) | 0 (0.0%) |
| 35 to 64 Years | 0 (0.0%) | 82 (65.1%) |
| 65 to 74 Years | 0 (0.0%) | 0 (0.0%) |
| 75 Years and over | 0 (0.0%) | 0 (0.0%) |
Disability Class: Vision Difficulty
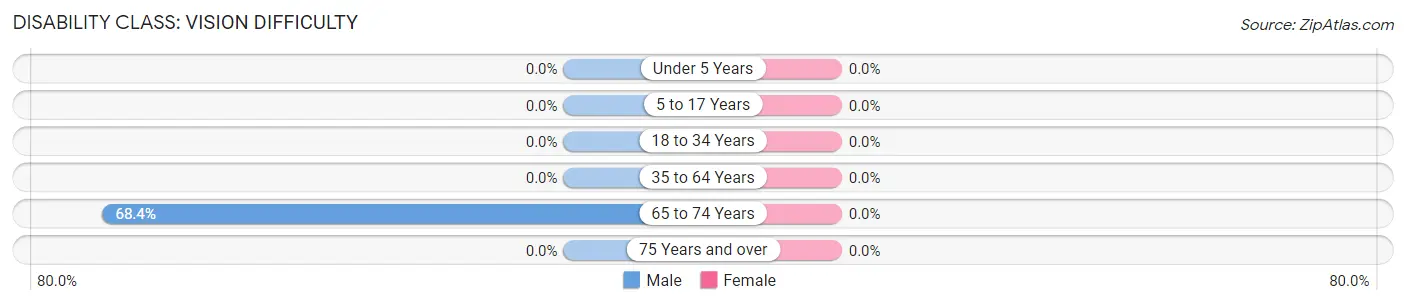
| Age Bracket | Male | Female |
| Under 5 Years | 0 (0.0%) | 0 (0.0%) |
| 5 to 17 Years | 0 (0.0%) | 0 (0.0%) |
| 18 to 34 Years | 0 (0.0%) | 0 (0.0%) |
| 35 to 64 Years | 0 (0.0%) | 0 (0.0%) |
| 65 to 74 Years | 13 (68.4%) | 0 (0.0%) |
| 75 Years and over | 0 (0.0%) | 0 (0.0%) |
Disability Class: Cognitive Difficulty
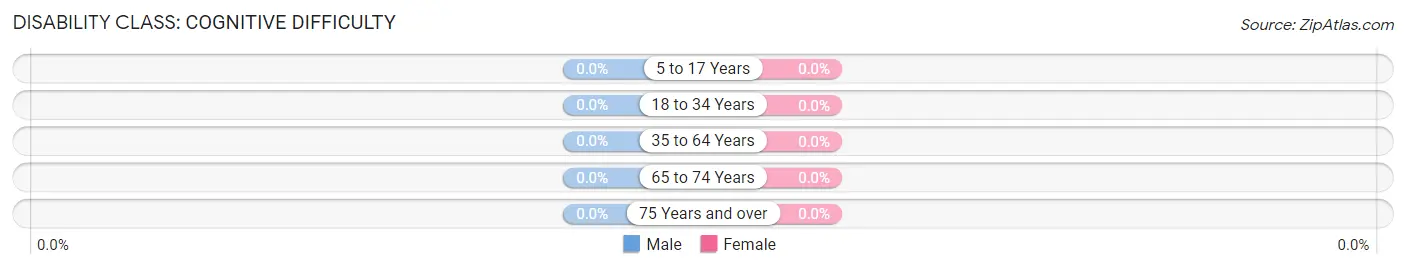
| Age Bracket | Male | Female |
| 5 to 17 Years | 0 (0.0%) | 0 (0.0%) |
| 18 to 34 Years | 0 (0.0%) | 0 (0.0%) |
| 35 to 64 Years | 0 (0.0%) | 0 (0.0%) |
| 65 to 74 Years | 0 (0.0%) | 0 (0.0%) |
| 75 Years and over | 0 (0.0%) | 0 (0.0%) |
Disability Class: Ambulatory Difficulty
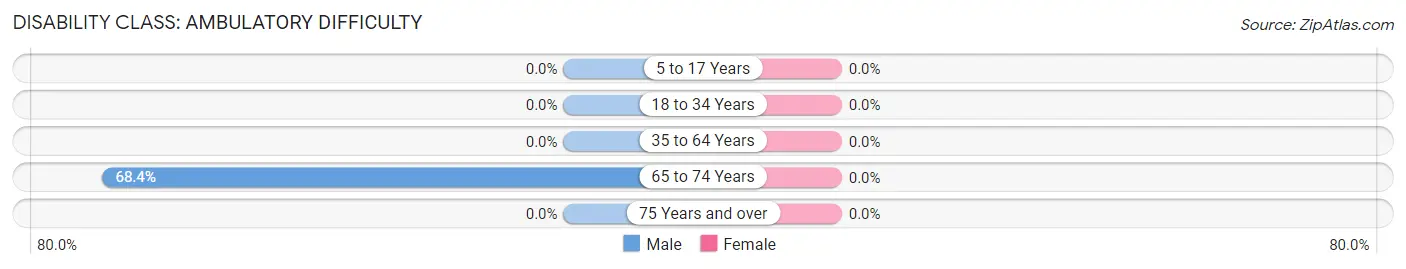
| Age Bracket | Male | Female |
| 5 to 17 Years | 0 (0.0%) | 0 (0.0%) |
| 18 to 34 Years | 0 (0.0%) | 0 (0.0%) |
| 35 to 64 Years | 0 (0.0%) | 0 (0.0%) |
| 65 to 74 Years | 13 (68.4%) | 0 (0.0%) |
| 75 Years and over | 0 (0.0%) | 0 (0.0%) |
Disability Class: Self-Care Difficulty
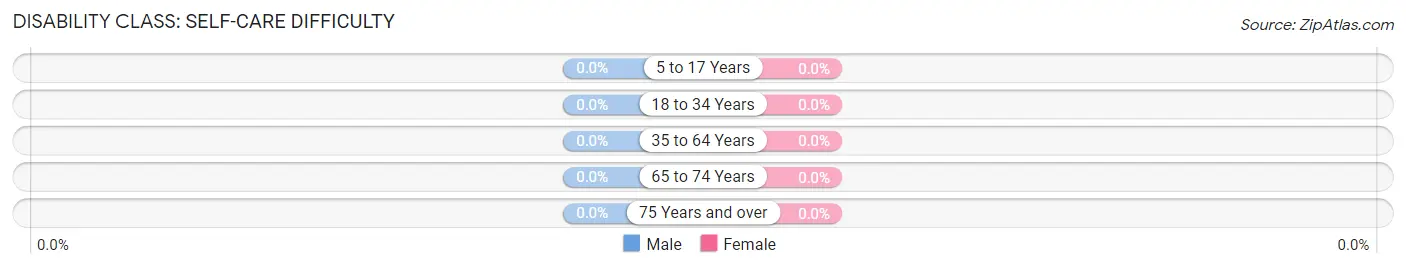
| Age Bracket | Male | Female |
| 5 to 17 Years | 0 (0.0%) | 0 (0.0%) |
| 18 to 34 Years | 0 (0.0%) | 0 (0.0%) |
| 35 to 64 Years | 0 (0.0%) | 0 (0.0%) |
| 65 to 74 Years | 0 (0.0%) | 0 (0.0%) |
| 75 Years and over | 0 (0.0%) | 0 (0.0%) |
Technology Access in Maple Falls
Computing Device Access in Maple Falls
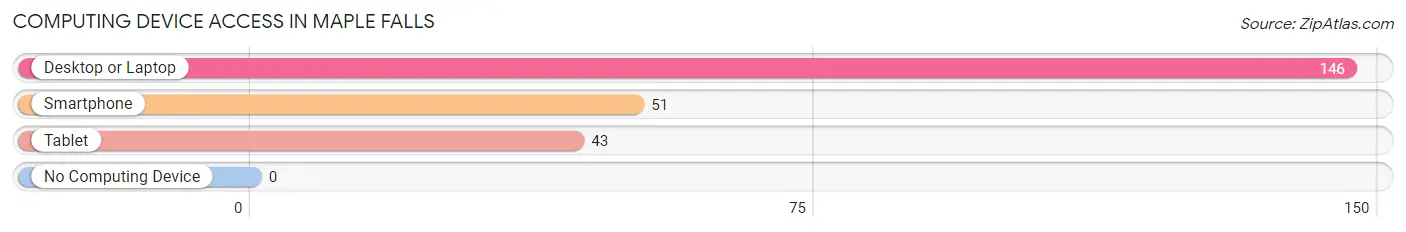
| Device Type | # Households | % Households |
| Desktop or Laptop | 146 | 100.0% |
| Smartphone | 51 | 34.9% |
| Tablet | 43 | 29.4% |
| No Computing Device | 0 | 0.0% |
| Total | 146 | 100.0% |
Internet Access in Maple Falls
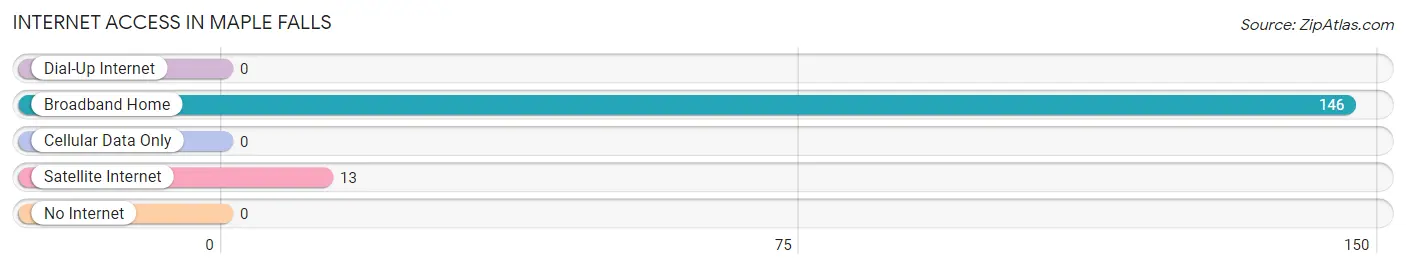
| Internet Type | # Households | % Households |
| Dial-Up Internet | 0 | 0.0% |
| Broadband Home | 146 | 100.0% |
| Cellular Data Only | 0 | 0.0% |
| Satellite Internet | 13 | 8.9% |
| No Internet | 0 | 0.0% |
| Total | 146 | 100.0% |
Maple Falls Summary
Maple Falls is a small unincorporated community located in Whatcom County, Washington, United States. It is situated in the foothills of the Cascade Mountains, approximately 20 miles east of Bellingham and 40 miles south of the Canadian border. The population of Maple Falls was estimated to be 1,845 in 2019.
History
The area that is now Maple Falls was first settled in the late 1800s by homesteaders and loggers. The first post office was established in 1891 and the town was officially incorporated in 1909. The town was named after the nearby Maple Falls, a waterfall on the Nooksack River.
In the early 1900s, the town was a popular tourist destination, with visitors coming to enjoy the scenery and the nearby hot springs. The town also had a thriving logging industry, with several sawmills in operation.
Geography
Maple Falls is located in the foothills of the Cascade Mountains, approximately 20 miles east of Bellingham and 40 miles south of the Canadian border. The town is situated at an elevation of 1,000 feet and is surrounded by forests and mountains. The nearby Nooksack River provides a scenic backdrop to the town.
The climate in Maple Falls is mild and temperate, with warm summers and cool winters. The average annual temperature is around 50°F, with an average high of around 70°F in the summer and an average low of around 30°F in the winter.
Economy
The economy of Maple Falls is largely based on tourism and logging. The town is a popular destination for outdoor recreation, with visitors coming to enjoy the nearby mountains, rivers, and forests. The nearby Nooksack River is a popular destination for fishing, rafting, and kayaking.
The town also has a thriving logging industry, with several sawmills in operation. The town is also home to several small businesses, including restaurants, shops, and lodging.
Demographics
As of 2019, the population of Maple Falls was estimated to be 1,845. The racial makeup of the town was 94.3% White, 0.7% African American, 0.7% Native American, 0.7% Asian, 0.3% Pacific Islander, and 2.7% from other races. The median household income was $50,000, and the median age was 44.
Conclusion
Maple Falls is a small unincorporated community located in Whatcom County, Washington. It is situated in the foothills of the Cascade Mountains, approximately 20 miles east of Bellingham and 40 miles south of the Canadian border. The population of Maple Falls was estimated to be 1,845 in 2019. The economy of Maple Falls is largely based on tourism and logging, and the town is a popular destination for outdoor recreation. The racial makeup of the town was 94.3% White, 0.7% African American, 0.7% Native American, 0.7% Asian, 0.3% Pacific Islander, and 2.7% from other races. The median household income was $50,000, and the median age was 44.
Common Questions
What is Per Capita Income in Maple Falls?
Per Capita income in Maple Falls is $30,698.
What is the Median Family Income in Maple Falls?
Median Family Income in Maple Falls is $52,917.
What is the Median Household income in Maple Falls?
Median Household Income in Maple Falls is $32,226.
What is Inequality or Gini Index in Maple Falls?
Inequality or Gini Index in Maple Falls is 0.28.
What is the Total Population of Maple Falls?
Total Population of Maple Falls is 231.
What is the Total Male Population of Maple Falls?
Total Male Population of Maple Falls is 54.
What is the Total Female Population of Maple Falls?
Total Female Population of Maple Falls is 177.
What is the Ratio of Males per 100 Females in Maple Falls?
There are 30.51 Males per 100 Females in Maple Falls.
What is the Ratio of Females per 100 Males in Maple Falls?
There are 327.78 Females per 100 Males in Maple Falls.
What is the Median Population Age in Maple Falls?
Median Population Age in Maple Falls is 61.4 Years.
What is the Average Family Size in Maple Falls
Average Family Size in Maple Falls is 2.5 People.
What is the Average Household Size in Maple Falls
Average Household Size in Maple Falls is 1.6 People.
How Large is the Labor Force in Maple Falls?
There are 129 People in the Labor Forcein in Maple Falls.
What is the Percentage of People in the Labor Force in Maple Falls?
55.8% of People are in the Labor Force in Maple Falls.