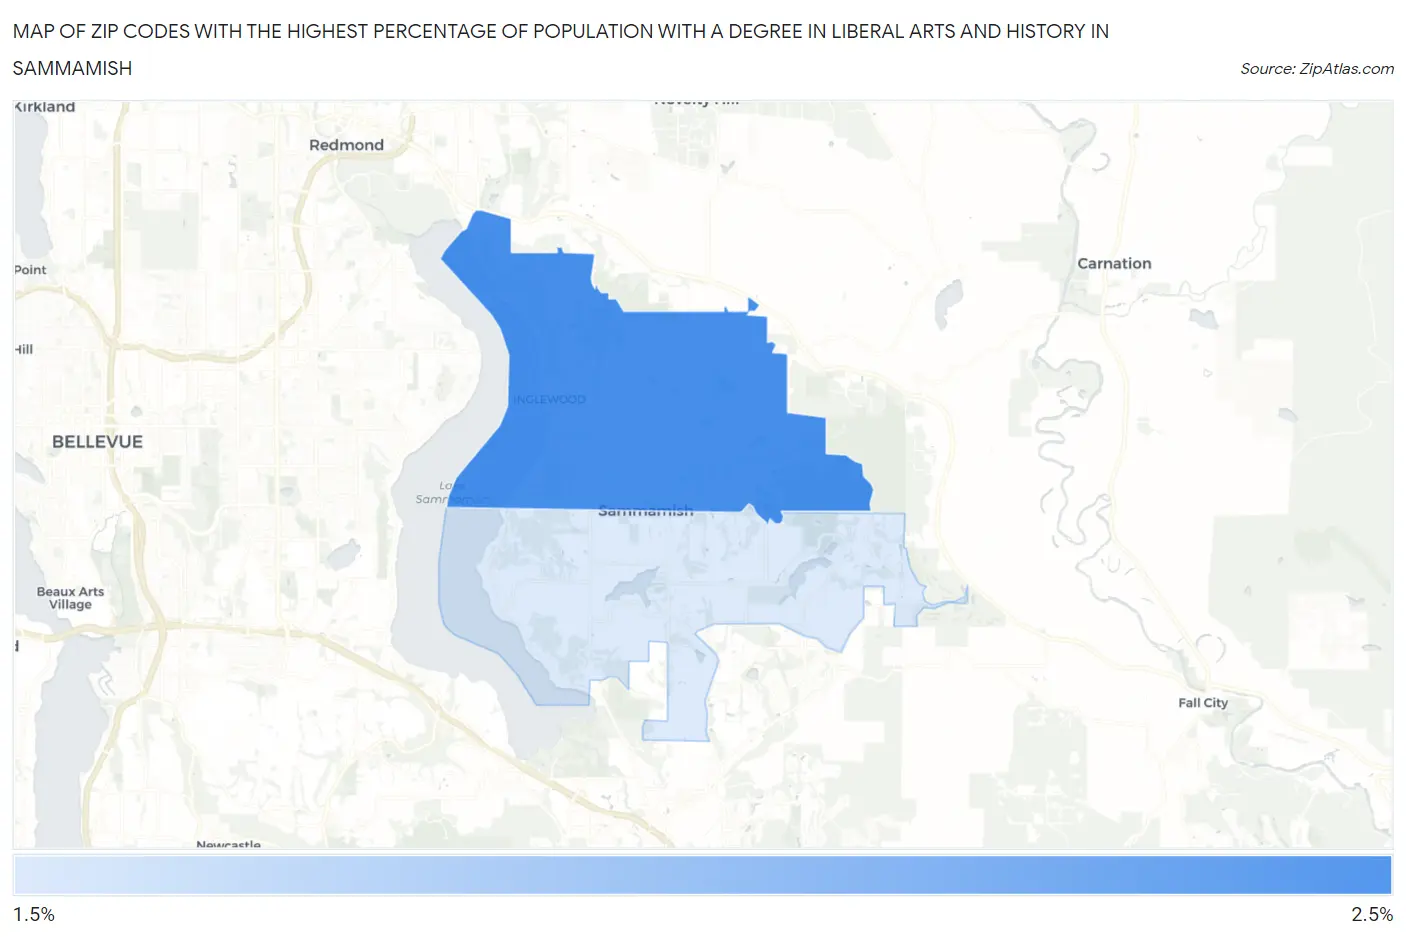
Zip Codes with the Highest Percentage of Population with a Degree in Liberal Arts and History in Sammamish, WA
RELATED REPORTS & OPTIONS
Liberal Arts and History
Sammamish
Compare Zip Codes
Map of Zip Codes with the Highest Percentage of Population with a Degree in Liberal Arts and History in Sammamish
1.9%
2.3%
Zip Codes with the Highest Percentage of Population with a Degree in Liberal Arts and History in Sammamish, WA
| Zip Code | % Graduates | vs State | vs National | |
| 1. | 98074 | 2.3% | 5.1%(-2.81)#428 | 4.9%(-2.53)#20,436 |
| 2. | 98075 | 1.9% | 5.1%(-3.22)#438 | 4.9%(-2.94)#21,555 |
1
Common Questions
What are the Top Zip Codes with the Highest Percentage of Population with a Degree in Liberal Arts and History in Sammamish, WA?
Top Zip Codes with the Highest Percentage of Population with a Degree in Liberal Arts and History in Sammamish, WA are:
What zip code has the Highest Percentage of Population with a Degree in Liberal Arts and History in Sammamish, WA?
98074 has the Highest Percentage of Population with a Degree in Liberal Arts and History in Sammamish, WA with 2.3%.
What is the Percentage of Population with a Degree in Liberal Arts and History in Sammamish, WA?
Percentage of Population with a Degree in Liberal Arts and History in Sammamish is 2.1%.
What is the Percentage of Population with a Degree in Liberal Arts and History in Washington?
Percentage of Population with a Degree in Liberal Arts and History in Washington is 5.1%.
What is the Percentage of Population with a Degree in Liberal Arts and History in the United States?
Percentage of Population with a Degree in Liberal Arts and History in the United States is 4.9%.