Zip Codes with the Highest Percentage of Population with a Degree in Liberal Arts and History in Snohomish, WA
RELATED REPORTS & OPTIONS
Liberal Arts and History
Snohomish
Compare Zip Codes
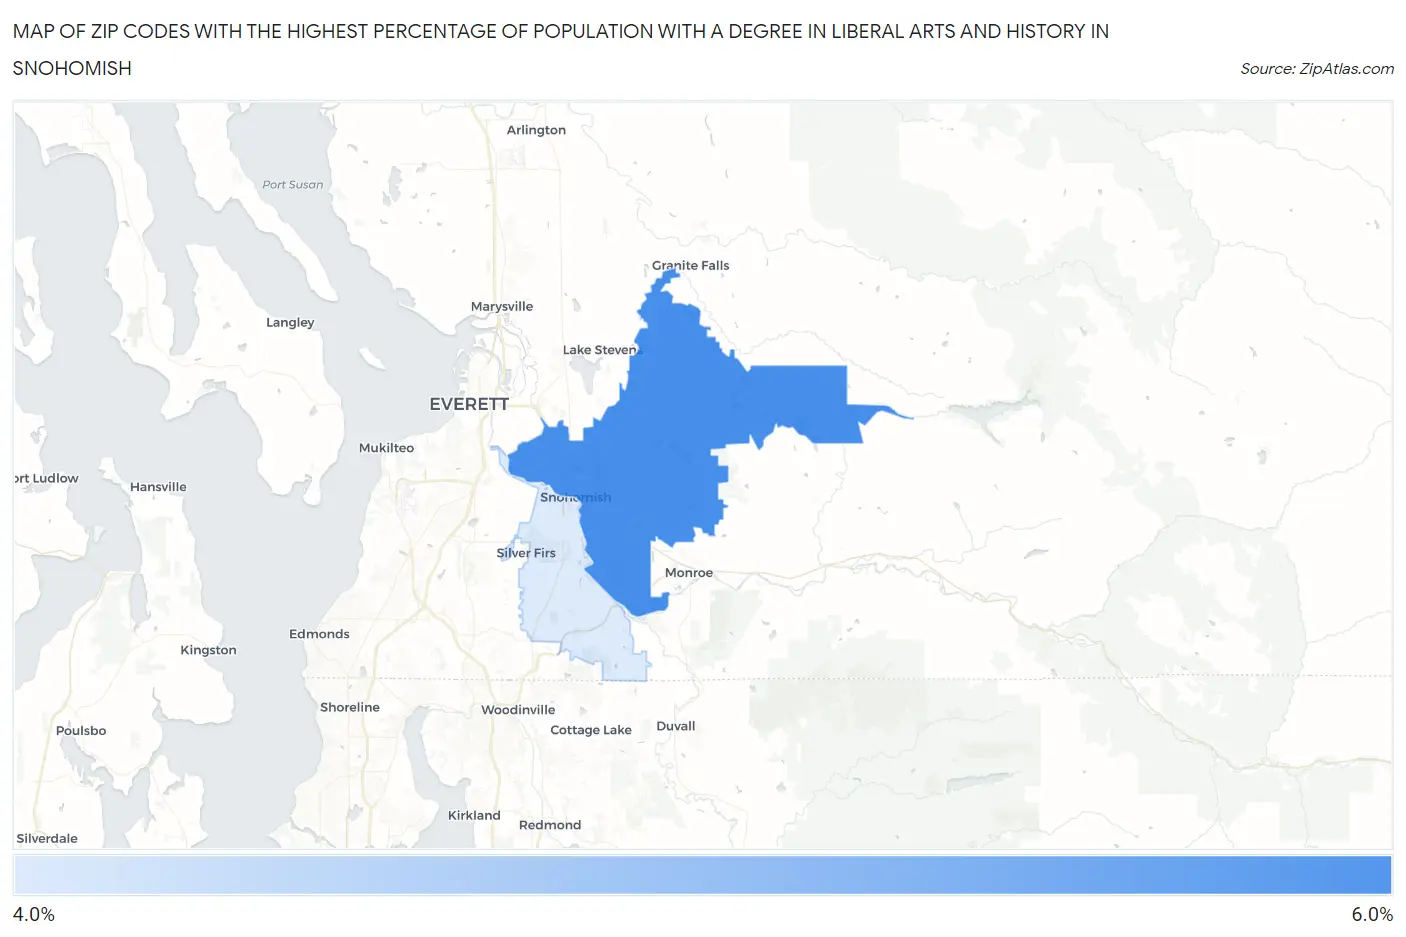
Map of Zip Codes with the Highest Percentage of Population with a Degree in Liberal Arts and History in Snohomish
4.2%
5.7%
Zip Codes with the Highest Percentage of Population with a Degree in Liberal Arts and History in Snohomish, WA
| Zip Code | % Graduates | vs State | vs National | |
| 1. | 98290 | 5.7% | 5.1%(+0.517)#209 | 4.9%(+0.792)#9,392 |
| 2. | 98296 | 4.2% | 5.1%(-0.943)#316 | 4.9%(-0.668)#13,998 |
1
Common Questions
What are the Top Zip Codes with the Highest Percentage of Population with a Degree in Liberal Arts and History in Snohomish, WA?
Top Zip Codes with the Highest Percentage of Population with a Degree in Liberal Arts and History in Snohomish, WA are:
What zip code has the Highest Percentage of Population with a Degree in Liberal Arts and History in Snohomish, WA?
98290 has the Highest Percentage of Population with a Degree in Liberal Arts and History in Snohomish, WA with 5.7%.
What is the Percentage of Population with a Degree in Liberal Arts and History in Snohomish, WA?
Percentage of Population with a Degree in Liberal Arts and History in Snohomish is 5.3%.
What is the Percentage of Population with a Degree in Liberal Arts and History in Washington?
Percentage of Population with a Degree in Liberal Arts and History in Washington is 5.1%.
What is the Percentage of Population with a Degree in Liberal Arts and History in the United States?
Percentage of Population with a Degree in Liberal Arts and History in the United States is 4.9%.