Zip Codes with the Highest Percentage of Population with a Degree in Liberal Arts and History in Washington
RELATED REPORTS & OPTIONS
Liberal Arts and History
Washington
Compare Zip Codes
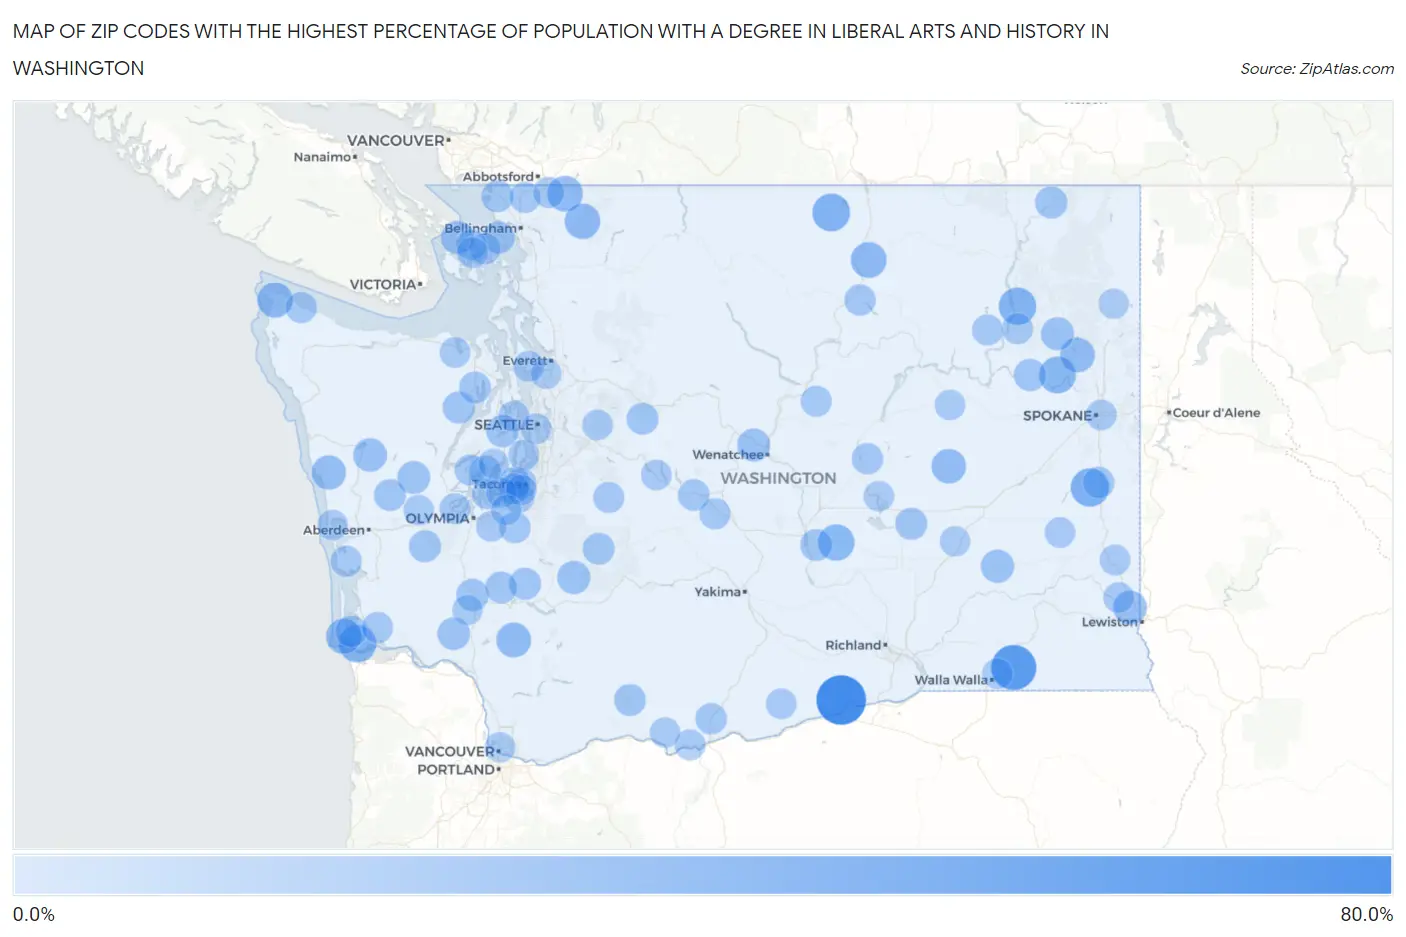
Map of Zip Codes with the Highest Percentage of Population with a Degree in Liberal Arts and History in Washington
0.0%
80.0%
Zip Codes with the Highest Percentage of Population with a Degree in Liberal Arts and History in Washington
| Zip Code | % Graduates | vs State | vs National | |
| 1. | 99345 | 78.1% | 5.1%(+73.0)#1 | 4.9%(+73.3)#63 |
| 2. | 99329 | 61.5% | 5.1%(+56.4)#2 | 4.9%(+56.7)#99 |
| 3. | 99149 | 36.8% | 5.1%(+31.7)#3 | 4.9%(+32.0)#281 |
| 4. | 98827 | 34.3% | 5.1%(+29.2)#4 | 4.9%(+29.5)#328 |
| 5. | 98614 | 33.3% | 5.1%(+28.2)#5 | 4.9%(+28.5)#343 |
| 6. | 99131 | 33.3% | 5.1%(+28.2)#6 | 4.9%(+28.5)#356 |
| 7. | 99034 | 30.6% | 5.1%(+25.5)#7 | 4.9%(+25.7)#406 |
| 8. | 99357 | 29.2% | 5.1%(+24.1)#8 | 4.9%(+24.3)#437 |
| 9. | 98849 | 27.3% | 5.1%(+22.1)#9 | 4.9%(+22.4)#490 |
| 10. | 98266 | 26.6% | 5.1%(+21.5)#10 | 4.9%(+21.7)#512 |
| 11. | 98244 | 26.6% | 5.1%(+21.4)#11 | 4.9%(+21.7)#513 |
| 12. | 98357 | 25.8% | 5.1%(+20.7)#12 | 4.9%(+20.9)#546 |
| 13. | 98644 | 25.4% | 5.1%(+20.3)#13 | 4.9%(+20.6)#556 |
| 14. | 98649 | 24.0% | 5.1%(+18.9)#14 | 4.9%(+19.1)#632 |
| 15. | 99110 | 23.6% | 5.1%(+18.5)#15 | 4.9%(+18.7)#647 |
| 16. | 99159 | 22.5% | 5.1%(+17.4)#16 | 4.9%(+17.6)#708 |
| 17. | 98587 | 21.7% | 5.1%(+16.6)#17 | 4.9%(+16.9)#750 |
| 18. | 99179 | 20.4% | 5.1%(+15.2)#18 | 4.9%(+15.5)#830 |
| 19. | 98575 | 19.0% | 5.1%(+13.9)#19 | 4.9%(+14.2)#931 |
| 20. | 99371 | 18.2% | 5.1%(+13.0)#20 | 4.9%(+13.3)#1,012 |
| 21. | 98355 | 17.7% | 5.1%(+12.6)#21 | 4.9%(+12.9)#1,067 |
| 22. | 99181 | 17.5% | 5.1%(+12.4)#22 | 4.9%(+12.6)#1,081 |
| 23. | 98836 | 17.3% | 5.1%(+12.2)#23 | 4.9%(+12.5)#1,098 |
| 24. | 98297 | 17.3% | 5.1%(+12.2)#24 | 4.9%(+12.4)#1,105 |
| 25. | 98560 | 16.7% | 5.1%(+11.5)#25 | 4.9%(+11.8)#1,177 |
| 26. | 98581 | 15.9% | 5.1%(+10.7)#26 | 4.9%(+11.0)#1,275 |
| 27. | 98565 | 15.2% | 5.1%(+10.0)#27 | 4.9%(+10.3)#1,393 |
| 28. | 98314 | 15.0% | 5.1%(+9.85)#28 | 4.9%(+10.1)#1,416 |
| 29. | 99040 | 14.4% | 5.1%(+9.24)#29 | 4.9%(+9.52)#1,538 |
| 30. | 99157 | 14.4% | 5.1%(+9.23)#30 | 4.9%(+9.51)#1,539 |
| 31. | 98320 | 14.1% | 5.1%(+8.96)#31 | 4.9%(+9.24)#1,613 |
| 32. | 98857 | 13.9% | 5.1%(+8.72)#32 | 4.9%(+9.00)#1,665 |
| 33. | 98533 | 13.6% | 5.1%(+8.44)#33 | 4.9%(+8.72)#1,741 |
| 34. | 98568 | 13.6% | 5.1%(+8.43)#34 | 4.9%(+8.70)#1,746 |
| 35. | 98262 | 13.3% | 5.1%(+8.16)#35 | 4.9%(+8.43)#1,827 |
| 36. | 98563 | 13.3% | 5.1%(+8.12)#36 | 4.9%(+8.39)#1,836 |
| 37. | 99321 | 13.2% | 5.1%(+8.01)#37 | 4.9%(+8.29)#1,858 |
| 38. | 98304 | 13.1% | 5.1%(+7.92)#38 | 4.9%(+8.20)#1,890 |
| 39. | 98230 | 13.0% | 5.1%(+7.90)#39 | 4.9%(+8.17)#1,894 |
| 40. | 98570 | 13.0% | 5.1%(+7.85)#40 | 4.9%(+8.13)#1,907 |
| 41. | 98394 | 12.9% | 5.1%(+7.78)#41 | 4.9%(+8.06)#1,927 |
| 42. | 98650 | 12.8% | 5.1%(+7.61)#42 | 4.9%(+7.88)#1,970 |
| 43. | 98288 | 12.7% | 5.1%(+7.58)#43 | 4.9%(+7.86)#1,979 |
| 44. | 98376 | 12.4% | 5.1%(+7.30)#44 | 4.9%(+7.57)#2,067 |
| 45. | 98943 | 12.1% | 5.1%(+6.95)#45 | 4.9%(+7.22)#2,179 |
| 46. | 98624 | 11.8% | 5.1%(+6.70)#46 | 4.9%(+6.97)#2,253 |
| 47. | 99170 | 11.7% | 5.1%(+6.58)#47 | 4.9%(+6.86)#2,286 |
| 48. | 98620 | 11.5% | 5.1%(+6.31)#48 | 4.9%(+6.59)#2,370 |
| 49. | 98851 | 11.4% | 5.1%(+6.25)#49 | 4.9%(+6.52)#2,398 |
| 50. | 98840 | 11.4% | 5.1%(+6.23)#50 | 4.9%(+6.51)#2,409 |
| 51. | 98580 | 11.2% | 5.1%(+6.06)#51 | 4.9%(+6.34)#2,467 |
| 52. | 98279 | 10.7% | 5.1%(+5.53)#52 | 4.9%(+5.81)#2,710 |
| 53. | 98381 | 10.5% | 5.1%(+5.38)#53 | 4.9%(+5.65)#2,807 |
| 54. | 98946 | 10.4% | 5.1%(+5.24)#54 | 4.9%(+5.52)#2,871 |
| 55. | 98547 | 10.4% | 5.1%(+5.23)#55 | 4.9%(+5.51)#2,876 |
| 56. | 98638 | 10.4% | 5.1%(+5.23)#56 | 4.9%(+5.50)#2,878 |
| 57. | 98264 | 10.2% | 5.1%(+5.07)#57 | 4.9%(+5.34)#2,990 |
| 58. | 98351 | 10.2% | 5.1%(+5.02)#58 | 4.9%(+5.30)#3,013 |
| 59. | 98295 | 10.0% | 5.1%(+4.85)#59 | 4.9%(+5.13)#3,103 |
| 60. | 99137 | 10.0% | 5.1%(+4.85)#60 | 4.9%(+5.13)#3,116 |
| 61. | 98858 | 9.9% | 5.1%(+4.72)#61 | 4.9%(+5.00)#3,181 |
| 62. | 98022 | 9.9% | 5.1%(+4.72)#62 | 4.9%(+5.00)#3,182 |
| 63. | 99138 | 9.8% | 5.1%(+4.69)#63 | 4.9%(+4.96)#3,212 |
| 64. | 98502 | 9.8% | 5.1%(+4.68)#64 | 4.9%(+4.96)#3,219 |
| 65. | 98546 | 9.8% | 5.1%(+4.66)#65 | 4.9%(+4.94)#3,230 |
| 66. | 98245 | 9.7% | 5.1%(+4.59)#66 | 4.9%(+4.87)#3,276 |
| 67. | 98499 | 9.6% | 5.1%(+4.50)#67 | 4.9%(+4.77)#3,337 |
| 68. | 98280 | 9.6% | 5.1%(+4.45)#68 | 4.9%(+4.73)#3,374 |
| 69. | 98673 | 9.5% | 5.1%(+4.38)#69 | 4.9%(+4.65)#3,435 |
| 70. | 98405 | 9.5% | 5.1%(+4.36)#70 | 4.9%(+4.63)#3,454 |
| 71. | 98110 | 9.5% | 5.1%(+4.33)#71 | 4.9%(+4.61)#3,471 |
| 72. | 98465 | 9.3% | 5.1%(+4.16)#72 | 4.9%(+4.43)#3,598 |
| 73. | 98236 | 9.3% | 5.1%(+4.14)#73 | 4.9%(+4.41)#3,615 |
| 74. | 98070 | 9.1% | 5.1%(+3.92)#74 | 4.9%(+4.20)#3,786 |
| 75. | 98466 | 9.1% | 5.1%(+3.92)#75 | 4.9%(+4.20)#3,789 |
| 76. | 98134 | 8.9% | 5.1%(+3.77)#76 | 4.9%(+4.05)#3,921 |
| 77. | 98382 | 8.9% | 5.1%(+3.74)#77 | 4.9%(+4.02)#3,944 |
| 78. | 99113 | 8.9% | 5.1%(+3.73)#78 | 4.9%(+4.00)#3,965 |
| 79. | 99102 | 8.8% | 5.1%(+3.68)#79 | 4.9%(+3.95)#4,006 |
| 80. | 98388 | 8.8% | 5.1%(+3.65)#80 | 4.9%(+3.93)#4,029 |
| 81. | 99125 | 8.7% | 5.1%(+3.60)#81 | 4.9%(+3.88)#4,079 |
| 82. | 98925 | 8.6% | 5.1%(+3.47)#82 | 4.9%(+3.75)#4,208 |
| 83. | 99202 | 8.6% | 5.1%(+3.45)#83 | 4.9%(+3.73)#4,237 |
| 84. | 99362 | 8.5% | 5.1%(+3.35)#84 | 4.9%(+3.63)#4,337 |
| 85. | 98065 | 8.5% | 5.1%(+3.35)#85 | 4.9%(+3.62)#4,341 |
| 86. | 98513 | 8.5% | 5.1%(+3.34)#86 | 4.9%(+3.62)#4,343 |
| 87. | 99322 | 8.5% | 5.1%(+3.34)#87 | 4.9%(+3.62)#4,344 |
| 88. | 98409 | 8.4% | 5.1%(+3.30)#88 | 4.9%(+3.57)#4,391 |
| 89. | 98204 | 8.4% | 5.1%(+3.29)#89 | 4.9%(+3.57)#4,397 |
| 90. | 98663 | 8.2% | 5.1%(+3.01)#90 | 4.9%(+3.29)#4,709 |
| 91. | 98541 | 8.1% | 5.1%(+2.92)#91 | 4.9%(+3.19)#4,824 |
| 92. | 98433 | 8.0% | 5.1%(+2.83)#92 | 4.9%(+3.11)#4,917 |
| 93. | 98837 | 7.9% | 5.1%(+2.80)#93 | 4.9%(+3.07)#4,960 |
| 94. | 99185 | 7.9% | 5.1%(+2.77)#94 | 4.9%(+3.04)#5,011 |
| 95. | 99180 | 7.8% | 5.1%(+2.68)#95 | 4.9%(+2.95)#5,130 |
| 96. | 99341 | 7.8% | 5.1%(+2.63)#96 | 4.9%(+2.91)#5,205 |
| 97. | 98596 | 7.7% | 5.1%(+2.60)#97 | 4.9%(+2.87)#5,237 |
| 98. | 98635 | 7.7% | 5.1%(+2.54)#98 | 4.9%(+2.82)#5,313 |
| 99. | 98569 | 7.7% | 5.1%(+2.53)#99 | 4.9%(+2.80)#5,342 |
| 100. | 98329 | 7.7% | 5.1%(+2.50)#100 | 4.9%(+2.78)#5,375 |
Common Questions
What are the Top 10 Zip Codes with the Highest Percentage of Population with a Degree in Liberal Arts and History in Washington?
Top 10 Zip Codes with the Highest Percentage of Population with a Degree in Liberal Arts and History in Washington are:
What zip code has the Highest Percentage of Population with a Degree in Liberal Arts and History in Washington?
99345 has the Highest Percentage of Population with a Degree in Liberal Arts and History in Washington with 78.1%.
What is the Percentage of Population with a Degree in Liberal Arts and History in the State of Washington?
Percentage of Population with a Degree in Liberal Arts and History in Washington is 5.1%.
What is the Percentage of Population with a Degree in Liberal Arts and History in the United States?
Percentage of Population with a Degree in Liberal Arts and History in the United States is 4.9%.