Zip Codes with the Highest Percentage of Population with a Degree in Liberal Arts and History in Yakima, WA
RELATED REPORTS & OPTIONS
Liberal Arts and History
Yakima
Compare Zip Codes
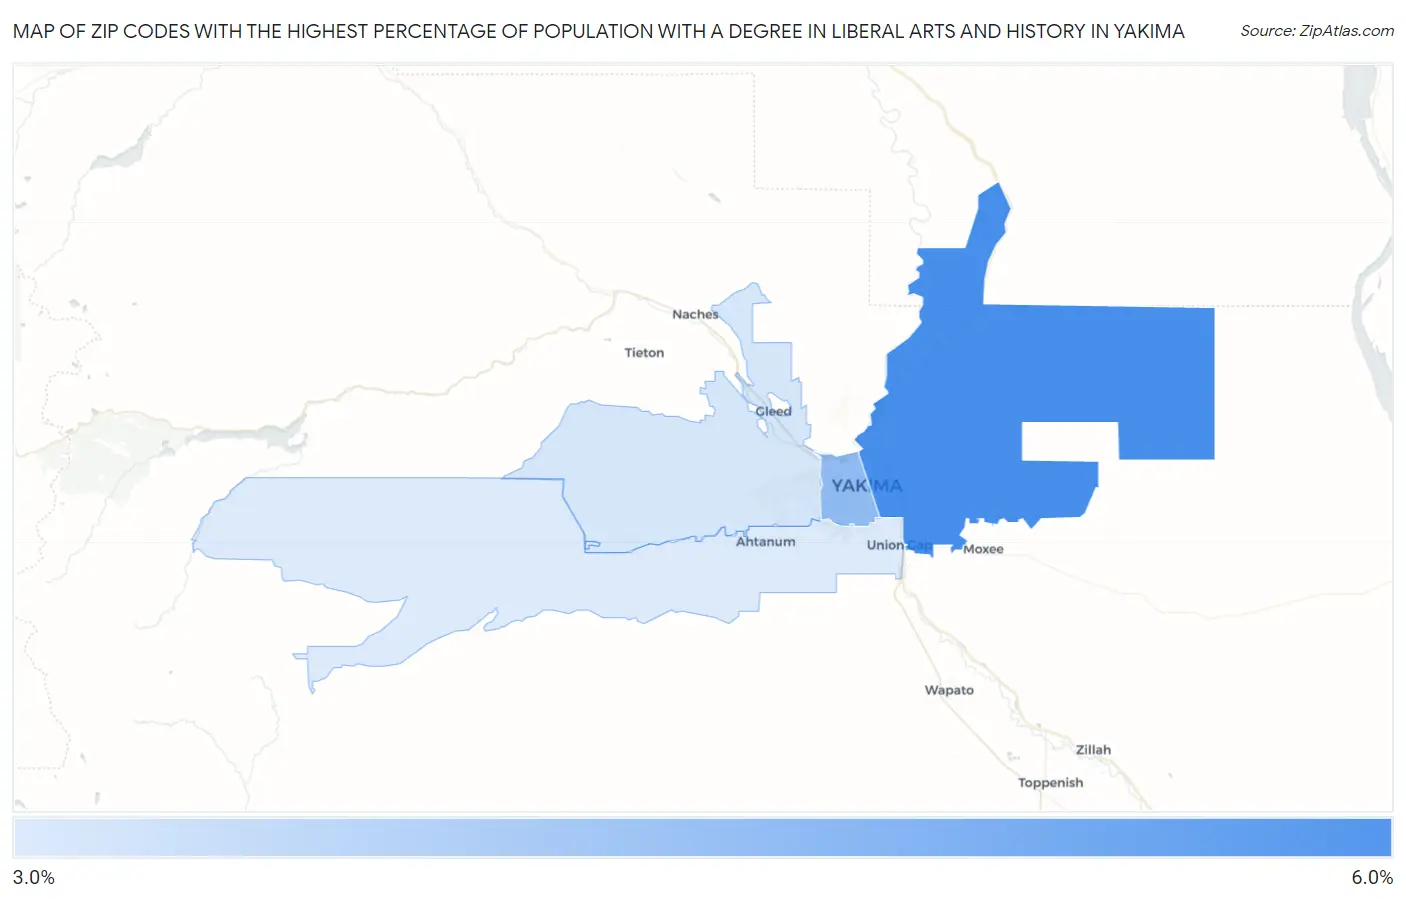
Map of Zip Codes with the Highest Percentage of Population with a Degree in Liberal Arts and History in Yakima
4.0%
5.3%
Zip Codes with the Highest Percentage of Population with a Degree in Liberal Arts and History in Yakima, WA
| Zip Code | % Graduates | vs State | vs National | |
| 1. | 98901 | 5.3% | 5.1%(+0.185)#235 | 4.9%(+0.461)#10,341 |
| 2. | 98902 | 4.7% | 5.1%(-0.478)#278 | 4.9%(-0.202)#12,423 |
| 3. | 98908 | 4.1% | 5.1%(-1.08)#336 | 4.9%(-0.808)#14,530 |
| 4. | 98903 | 4.0% | 5.1%(-1.15)#342 | 4.9%(-0.876)#14,805 |
1
Common Questions
What are the Top 3 Zip Codes with the Highest Percentage of Population with a Degree in Liberal Arts and History in Yakima, WA?
Top 3 Zip Codes with the Highest Percentage of Population with a Degree in Liberal Arts and History in Yakima, WA are:
What zip code has the Highest Percentage of Population with a Degree in Liberal Arts and History in Yakima, WA?
98901 has the Highest Percentage of Population with a Degree in Liberal Arts and History in Yakima, WA with 5.3%.
What is the Percentage of Population with a Degree in Liberal Arts and History in Yakima, WA?
Percentage of Population with a Degree in Liberal Arts and History in Yakima is 4.4%.
What is the Percentage of Population with a Degree in Liberal Arts and History in Washington?
Percentage of Population with a Degree in Liberal Arts and History in Washington is 5.1%.
What is the Percentage of Population with a Degree in Liberal Arts and History in the United States?
Percentage of Population with a Degree in Liberal Arts and History in the United States is 4.9%.