Waterville, WA Map & Demographics
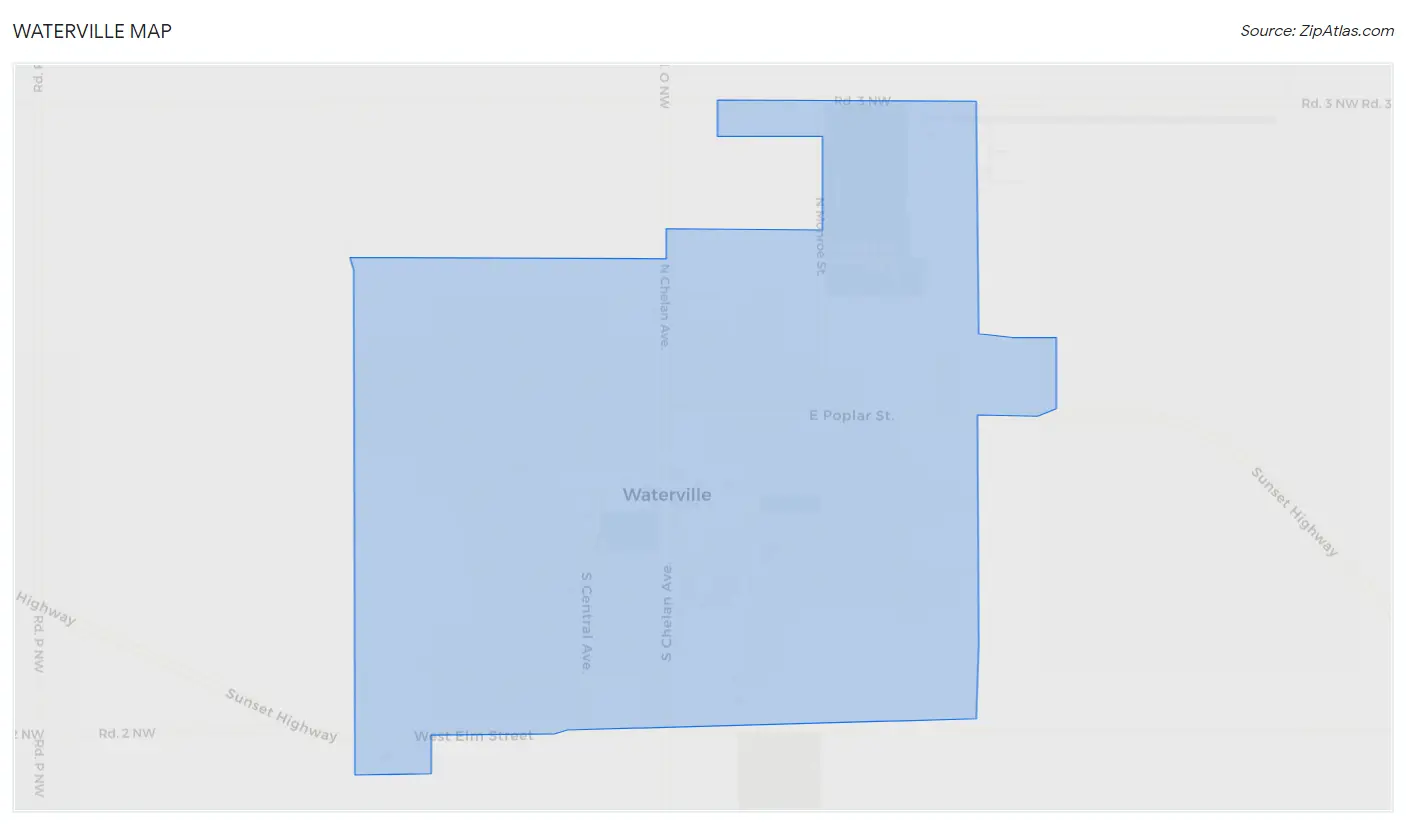
Waterville Map
Waterville Overview
$36,664
PER CAPITA INCOME
$77,045
AVG FAMILY INCOME
$71,964
AVG HOUSEHOLD INCOME
13.3%
WAGE / INCOME GAP [ % ]
86.7¢/ $1
WAGE / INCOME GAP [ $ ]
0.38
INEQUALITY / GINI INDEX
1,488
TOTAL POPULATION
817
MALE POPULATION
671
FEMALE POPULATION
121.76
MALES / 100 FEMALES
82.13
FEMALES / 100 MALES
49.0
MEDIAN AGE
2.9
AVG FAMILY SIZE
2.6
AVG HOUSEHOLD SIZE
899
LABOR FORCE [ PEOPLE ]
71.5%
PERCENT IN LABOR FORCE
1.3%
UNEMPLOYMENT RATE
Waterville Zip Codes
Waterville Area Codes
Income in Waterville
Income Overview in Waterville
Per Capita Income in Waterville is $36,664, while median incomes of families and households are $77,045 and $71,964 respectively.
| Characteristic | Number | Measure |
| Per Capita Income | 1,488 | $36,664 |
| Median Family Income | 426 | $77,045 |
| Mean Family Income | 426 | $104,523 |
| Median Household Income | 565 | $71,964 |
| Mean Household Income | 565 | $90,539 |
| Income Deficit | 426 | $0 |
| Wage / Income Gap (%) | 1,488 | 13.26% |
| Wage / Income Gap ($) | 1,488 | 86.74¢ per $1 |
| Gini / Inequality Index | 1,488 | 0.38 |
Earnings by Sex in Waterville
Average Earnings in Waterville are $41,632, $45,590 for men and $39,545 for women, a difference of 13.3%.
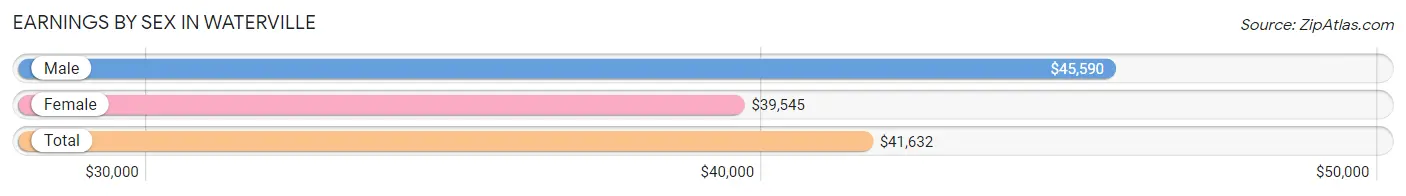
| Sex | Number | Average Earnings |
| Male | 489 (52.1%) | $45,590 |
| Female | 450 (47.9%) | $39,545 |
| Total | 939 (100.0%) | $41,632 |
Earnings by Sex by Income Bracket in Waterville
The most common earnings brackets in Waterville are $100,000+ for men (86 | 17.6%) and $45,000 to $49,999 for women (78 | 17.3%).
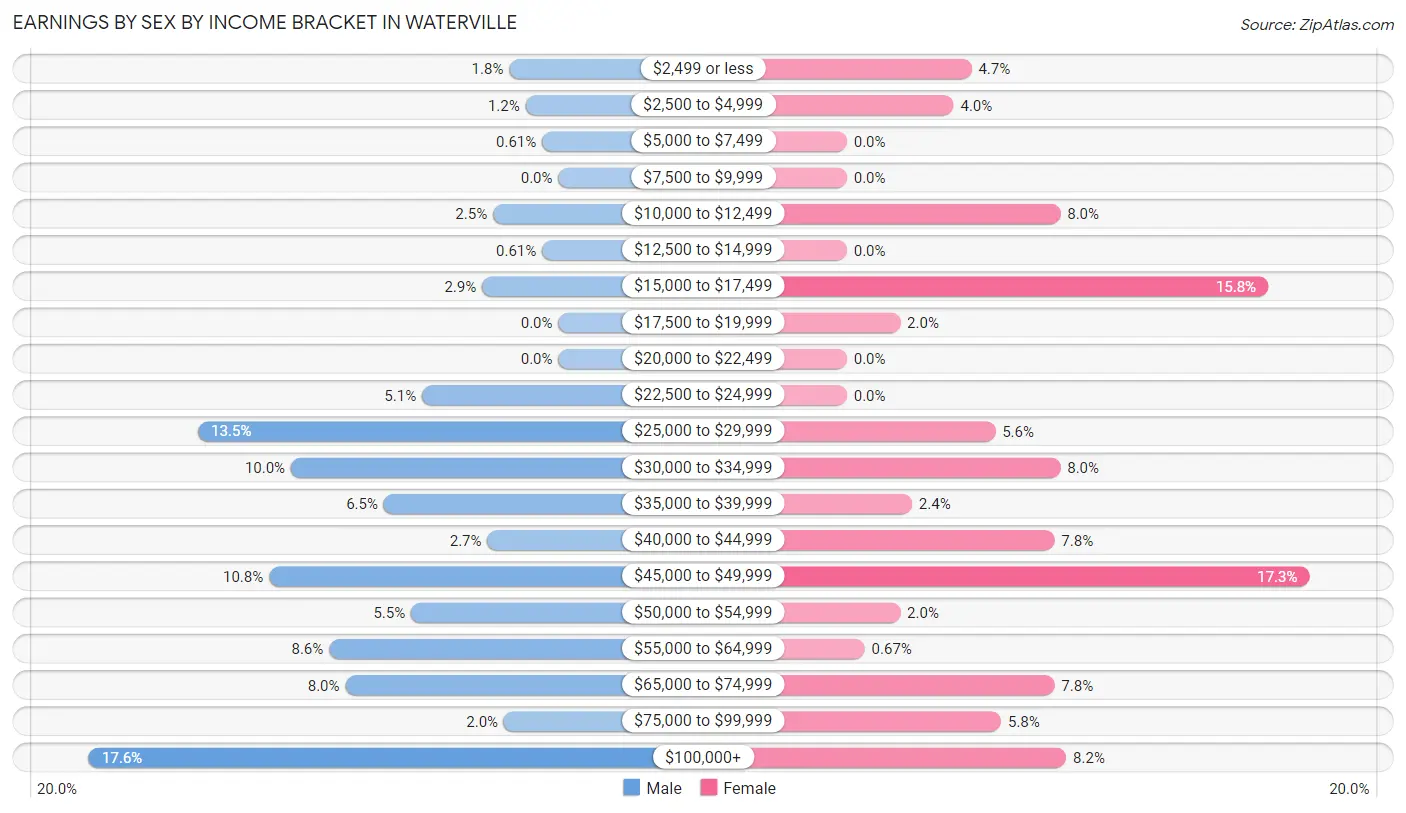
| Income | Male | Female |
| $2,499 or less | 9 (1.8%) | 21 (4.7%) |
| $2,500 to $4,999 | 6 (1.2%) | 18 (4.0%) |
| $5,000 to $7,499 | 3 (0.6%) | 0 (0.0%) |
| $7,500 to $9,999 | 0 (0.0%) | 0 (0.0%) |
| $10,000 to $12,499 | 12 (2.5%) | 36 (8.0%) |
| $12,500 to $14,999 | 3 (0.6%) | 0 (0.0%) |
| $15,000 to $17,499 | 14 (2.9%) | 71 (15.8%) |
| $17,500 to $19,999 | 0 (0.0%) | 9 (2.0%) |
| $20,000 to $22,499 | 0 (0.0%) | 0 (0.0%) |
| $22,500 to $24,999 | 25 (5.1%) | 0 (0.0%) |
| $25,000 to $29,999 | 66 (13.5%) | 25 (5.6%) |
| $30,000 to $34,999 | 49 (10.0%) | 36 (8.0%) |
| $35,000 to $39,999 | 32 (6.5%) | 11 (2.4%) |
| $40,000 to $44,999 | 13 (2.7%) | 35 (7.8%) |
| $45,000 to $49,999 | 53 (10.8%) | 78 (17.3%) |
| $50,000 to $54,999 | 27 (5.5%) | 9 (2.0%) |
| $55,000 to $64,999 | 42 (8.6%) | 3 (0.7%) |
| $65,000 to $74,999 | 39 (8.0%) | 35 (7.8%) |
| $75,000 to $99,999 | 10 (2.0%) | 26 (5.8%) |
| $100,000+ | 86 (17.6%) | 37 (8.2%) |
| Total | 489 (100.0%) | 450 (100.0%) |
Earnings by Sex by Educational Attainment in Waterville
Average earnings in Waterville are $46,203 for men and $42,283 for women, a difference of 8.5%. Men with an educational attainment of college or associate's degree enjoy the highest average annual earnings of $70,750, while those with high school diploma education earn the least with $32,721. Women with an educational attainment of graduate degree earn the most with the average annual earnings of $104,250, while those with high school diploma education have the smallest earnings of $30,804.
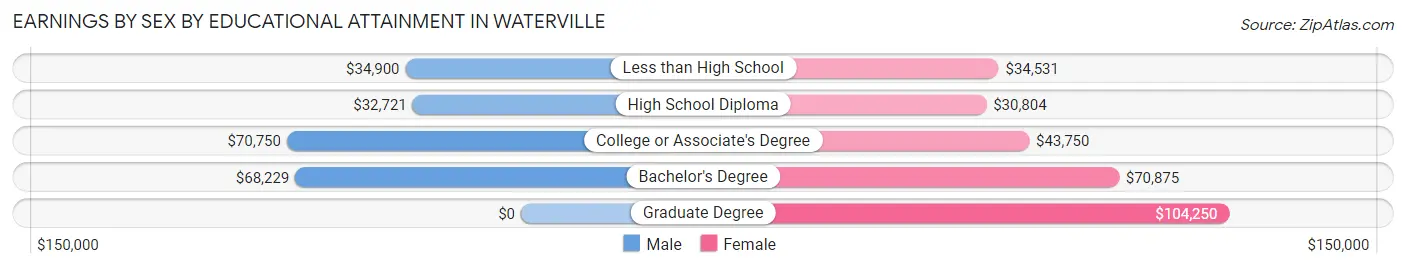
| Educational Attainment | Male Income | Female Income |
| Less than High School | $34,900 | $34,531 |
| High School Diploma | $32,721 | $30,804 |
| College or Associate's Degree | $70,750 | $43,750 |
| Bachelor's Degree | $68,229 | $70,875 |
| Graduate Degree | - | - |
| Total | $46,203 | $42,283 |
Family Income in Waterville
Family Income Brackets in Waterville
According to the Waterville family income data, there are 114 families falling into the $50,000 to $74,999 income range, which is the most common income bracket and makes up 26.8% of all families.
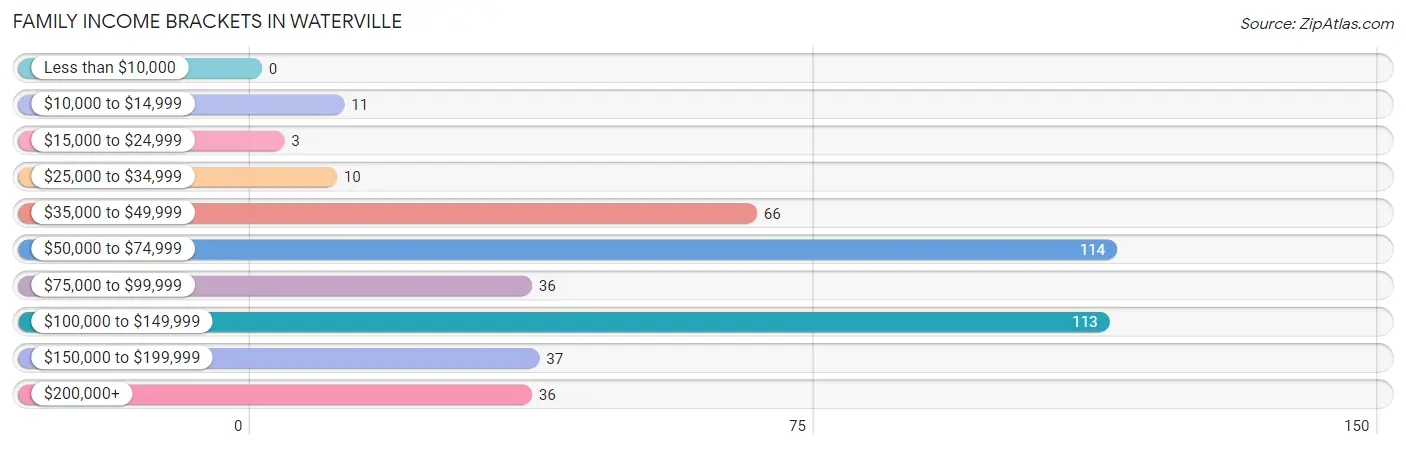
| Income Bracket | # Families | % Families |
| Less than $10,000 | 0 | 0.0% |
| $10,000 to $14,999 | 11 | 2.6% |
| $15,000 to $24,999 | 3 | 0.7% |
| $25,000 to $34,999 | 10 | 2.3% |
| $35,000 to $49,999 | 66 | 15.5% |
| $50,000 to $74,999 | 114 | 26.8% |
| $75,000 to $99,999 | 36 | 8.5% |
| $100,000 to $149,999 | 113 | 26.5% |
| $150,000 to $199,999 | 37 | 8.7% |
| $200,000+ | 36 | 8.5% |
Family Income by Famaliy Size in Waterville
4-person families (35 | 8.2%) account for the highest median family income in Waterville with $184,327 per family, while 4-person families (35 | 8.2%) have the highest median income of $46,082 per family member.
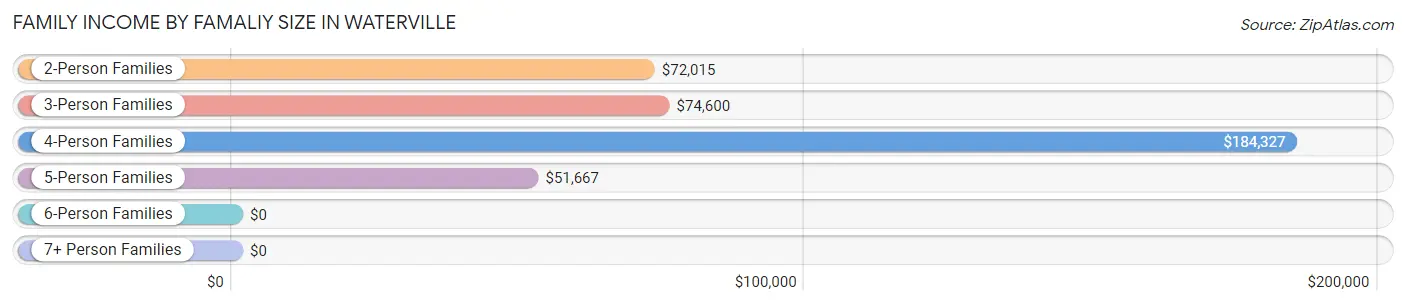
| Income Bracket | # Families | Median Income |
| 2-Person Families | 229 (53.8%) | $72,015 |
| 3-Person Families | 112 (26.3%) | $74,600 |
| 4-Person Families | 35 (8.2%) | $184,327 |
| 5-Person Families | 24 (5.6%) | $51,667 |
| 6-Person Families | 14 (3.3%) | $0 |
| 7+ Person Families | 12 (2.8%) | $0 |
| Total | 426 (100.0%) | $77,045 |
Family Income by Number of Earners in Waterville
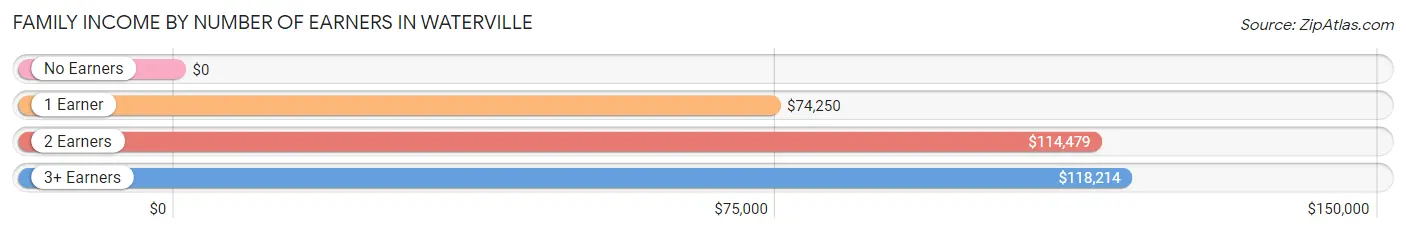
| Number of Earners | # Families | Median Income |
| No Earners | 30 (7.0%) | $0 |
| 1 Earner | 111 (26.1%) | $74,250 |
| 2 Earners | 227 (53.3%) | $114,479 |
| 3+ Earners | 58 (13.6%) | $118,214 |
| Total | 426 (100.0%) | $77,045 |
Household Income in Waterville
Household Income Brackets in Waterville
With 125 households falling in the category, the $100,000 to $149,999 income range is the most frequent in Waterville, accounting for 22.1% of all households. In contrast, only 7 households (1.2%) fall into the $10,000 to $14,999 income bracket, making it the least populous group.
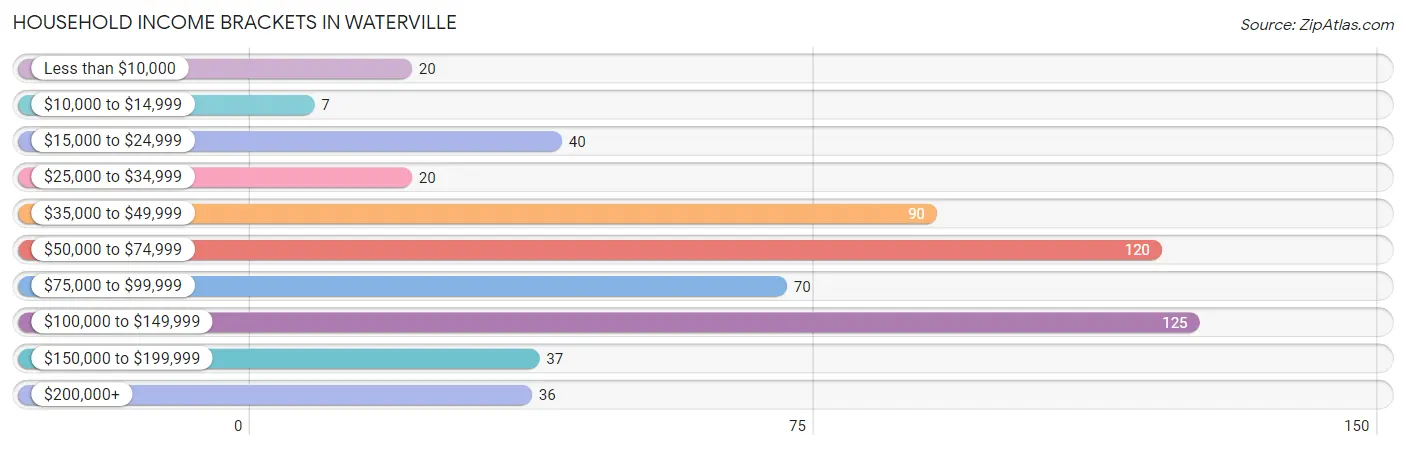
| Income Bracket | # Households | % Households |
| Less than $10,000 | 20 | 3.5% |
| $10,000 to $14,999 | 7 | 1.2% |
| $15,000 to $24,999 | 40 | 7.1% |
| $25,000 to $34,999 | 20 | 3.5% |
| $35,000 to $49,999 | 90 | 15.9% |
| $50,000 to $74,999 | 120 | 21.2% |
| $75,000 to $99,999 | 70 | 12.4% |
| $100,000 to $149,999 | 125 | 22.1% |
| $150,000 to $199,999 | 37 | 6.5% |
| $200,000+ | 36 | 6.4% |
Household Income by Householder Age in Waterville
The median household income in Waterville is $71,964, with the highest median household income of $130,417 found in the 25 to 44 years age bracket for the primary householder. A total of 101 households (17.9%) fall into this category. Meanwhile, the 15 to 24 years age bracket for the primary householder has the lowest median household income of $0, with 29 households (5.1%) in this group.
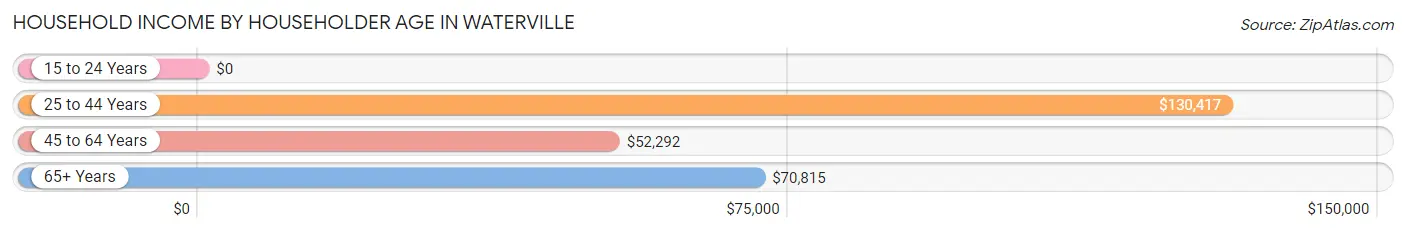
| Income Bracket | # Households | Median Income |
| 15 to 24 Years | 29 (5.1%) | $0 |
| 25 to 44 Years | 101 (17.9%) | $130,417 |
| 45 to 64 Years | 287 (50.8%) | $52,292 |
| 65+ Years | 148 (26.2%) | $70,815 |
| Total | 565 (100.0%) | $71,964 |
Poverty in Waterville
Income Below Poverty by Sex and Age in Waterville
With 4.9% poverty level for males and 5.8% for females among the residents of Waterville, 75 year old and over males and 75 year old and over females are the most vulnerable to poverty, with 6 males (16.7%) and 3 females (20.0%) in their respective age groups living below the poverty level.
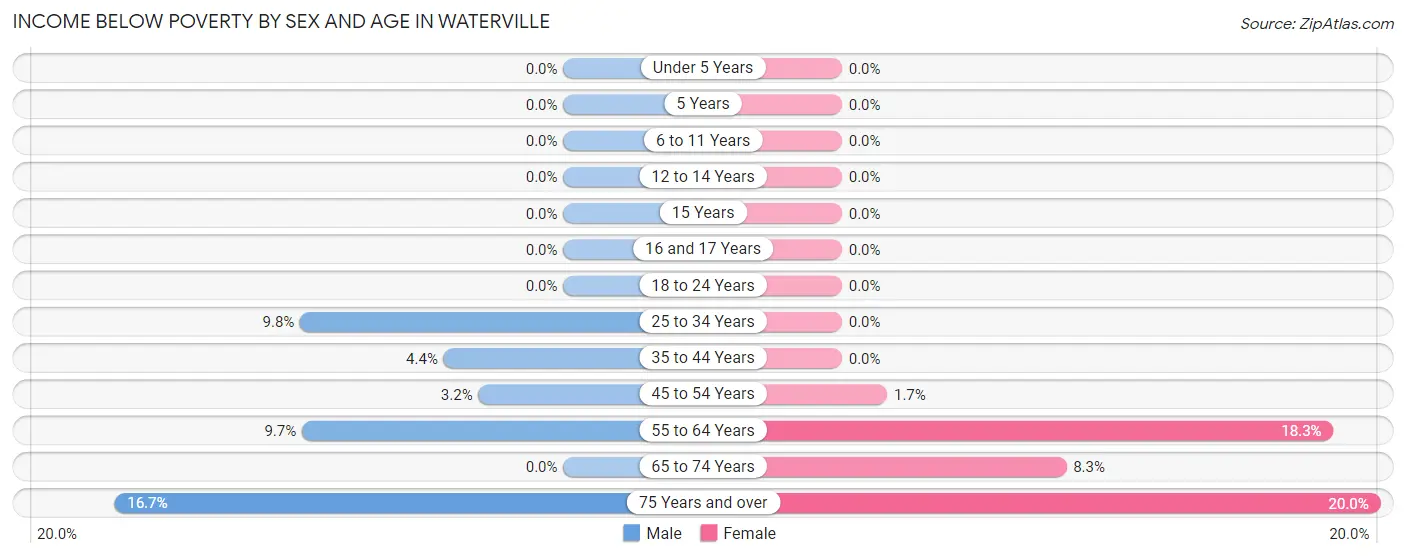
| Age Bracket | Male | Female |
| Under 5 Years | 0 (0.0%) | 0 (0.0%) |
| 5 Years | 0 (0.0%) | 0 (0.0%) |
| 6 to 11 Years | 0 (0.0%) | 0 (0.0%) |
| 12 to 14 Years | 0 (0.0%) | 0 (0.0%) |
| 15 Years | 0 (0.0%) | 0 (0.0%) |
| 16 and 17 Years | 0 (0.0%) | 0 (0.0%) |
| 18 to 24 Years | 0 (0.0%) | 0 (0.0%) |
| 25 to 34 Years | 13 (9.8%) | 0 (0.0%) |
| 35 to 44 Years | 4 (4.4%) | 0 (0.0%) |
| 45 to 54 Years | 4 (3.2%) | 2 (1.7%) |
| 55 to 64 Years | 13 (9.7%) | 25 (18.2%) |
| 65 to 74 Years | 0 (0.0%) | 9 (8.3%) |
| 75 Years and over | 6 (16.7%) | 3 (20.0%) |
| Total | 40 (4.9%) | 39 (5.8%) |
Income Above Poverty by Sex and Age in Waterville
According to the poverty statistics in Waterville, males aged under 5 years and females aged under 5 years are the age groups that are most secure financially, with 100.0% of males and 100.0% of females in these age groups living above the poverty line.
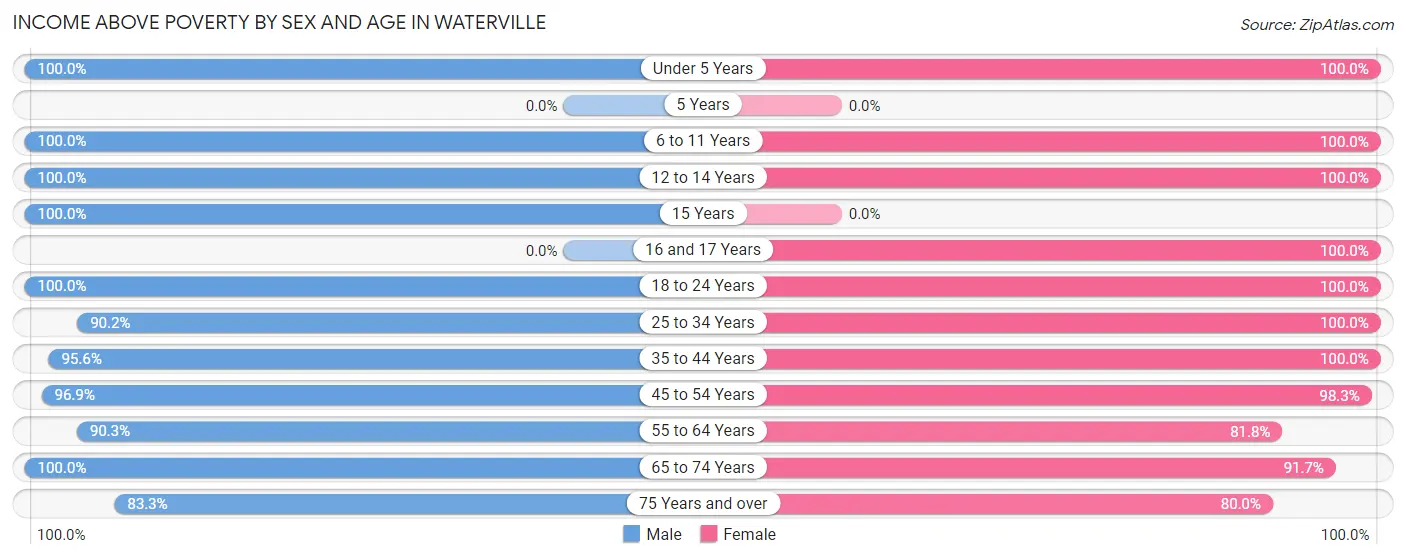
| Age Bracket | Male | Female |
| Under 5 Years | 33 (100.0%) | 48 (100.0%) |
| 5 Years | 0 (0.0%) | 0 (0.0%) |
| 6 to 11 Years | 35 (100.0%) | 14 (100.0%) |
| 12 to 14 Years | 48 (100.0%) | 7 (100.0%) |
| 15 Years | 45 (100.0%) | 0 (0.0%) |
| 16 and 17 Years | 0 (0.0%) | 17 (100.0%) |
| 18 to 24 Years | 26 (100.0%) | 77 (100.0%) |
| 25 to 34 Years | 120 (90.2%) | 57 (100.0%) |
| 35 to 44 Years | 86 (95.6%) | 72 (100.0%) |
| 45 to 54 Years | 123 (96.9%) | 117 (98.3%) |
| 55 to 64 Years | 121 (90.3%) | 112 (81.8%) |
| 65 to 74 Years | 110 (100.0%) | 99 (91.7%) |
| 75 Years and over | 30 (83.3%) | 12 (80.0%) |
| Total | 777 (95.1%) | 632 (94.2%) |
Income Below Poverty Among Married-Couple Families in Waterville
The poverty statistics for married-couple families in Waterville show that 0.8% or 3 of the total 362 families live below the poverty line. Families with no children have the highest poverty rate of 1.3%, comprising of 3 families. On the other hand, families with 1 or 2 children have the lowest poverty rate of 0.0%, which includes 0 families.
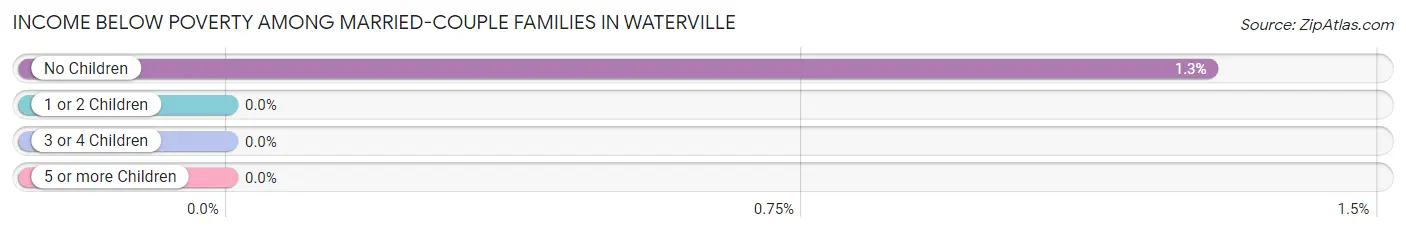
| Children | Above Poverty | Below Poverty |
| No Children | 231 (98.7%) | 3 (1.3%) |
| 1 or 2 Children | 104 (100.0%) | 0 (0.0%) |
| 3 or 4 Children | 24 (100.0%) | 0 (0.0%) |
| 5 or more Children | 0 (0.0%) | 0 (0.0%) |
| Total | 359 (99.2%) | 3 (0.8%) |
Income Below Poverty Among Single-Parent Households in Waterville
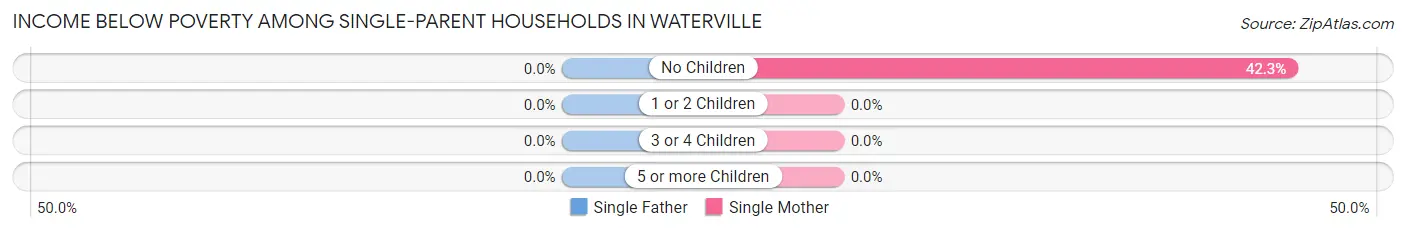
| Children | Single Father | Single Mother |
| No Children | 0 (0.0%) | 11 (42.3%) |
| 1 or 2 Children | 0 (0.0%) | 0 (0.0%) |
| 3 or 4 Children | 0 (0.0%) | 0 (0.0%) |
| 5 or more Children | 0 (0.0%) | 0 (0.0%) |
| Total | 0 (0.0%) | 11 (32.4%) |
Income Below Poverty Among Married-Couple vs Single-Parent Households in Waterville
The poverty data for Waterville shows that 3 of the married-couple family households (0.8%) and 11 of the single-parent households (17.2%) are living below the poverty level. Within the married-couple family households, those with no children have the highest poverty rate, with 3 households (1.3%) falling below the poverty line. Among the single-parent households, those with no children have the highest poverty rate, with 11 household (35.5%) living below poverty.
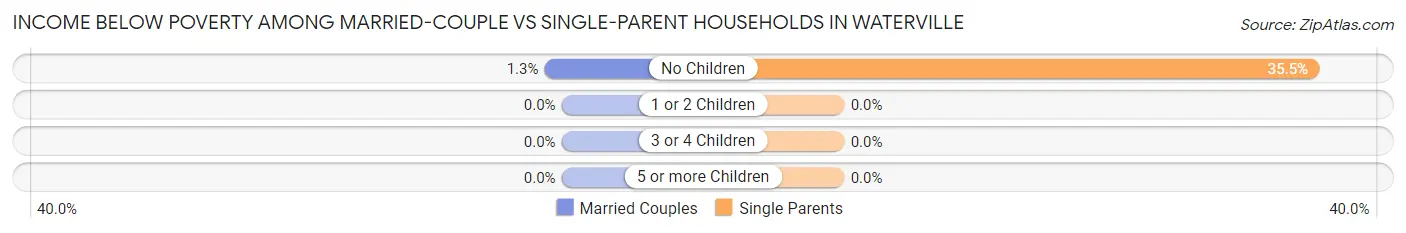
| Children | Married-Couple Families | Single-Parent Households |
| No Children | 3 (1.3%) | 11 (35.5%) |
| 1 or 2 Children | 0 (0.0%) | 0 (0.0%) |
| 3 or 4 Children | 0 (0.0%) | 0 (0.0%) |
| 5 or more Children | 0 (0.0%) | 0 (0.0%) |
| Total | 3 (0.8%) | 11 (17.2%) |
Race in Waterville
The most populous races in Waterville are White / Caucasian (1,197 | 80.4%), Hispanic or Latino (200 | 13.4%), and Some other Race (174 | 11.7%).
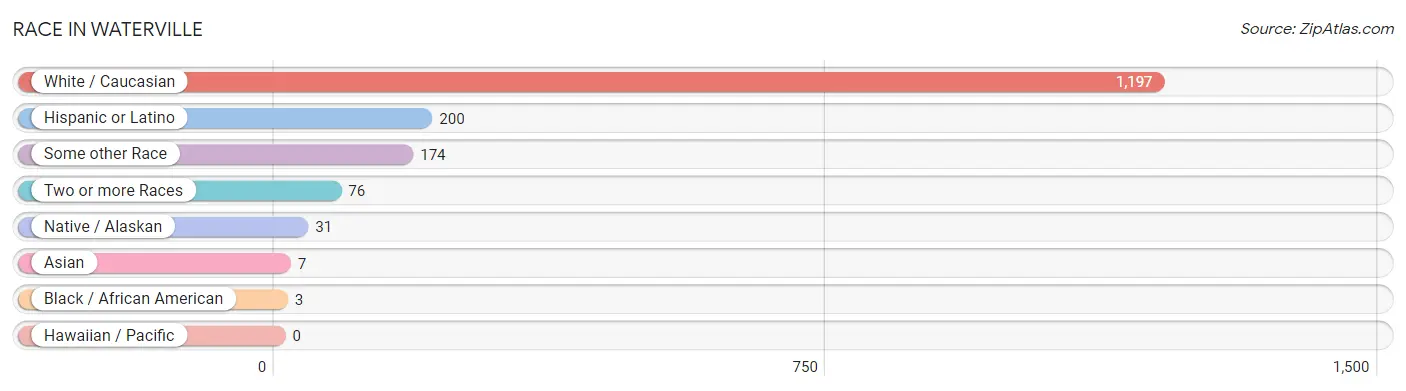
| Race | # Population | % Population |
| Asian | 7 | 0.5% |
| Black / African American | 3 | 0.2% |
| Hawaiian / Pacific | 0 | 0.0% |
| Hispanic or Latino | 200 | 13.4% |
| Native / Alaskan | 31 | 2.1% |
| White / Caucasian | 1,197 | 80.4% |
| Two or more Races | 76 | 5.1% |
| Some other Race | 174 | 11.7% |
| Total | 1,488 | 100.0% |
Ancestry in Waterville
The most populous ancestries reported in Waterville are German (382 | 25.7%), Mexican (200 | 13.4%), English (189 | 12.7%), Norwegian (111 | 7.5%), and Irish (100 | 6.7%), together accounting for 66.0% of all Waterville residents.
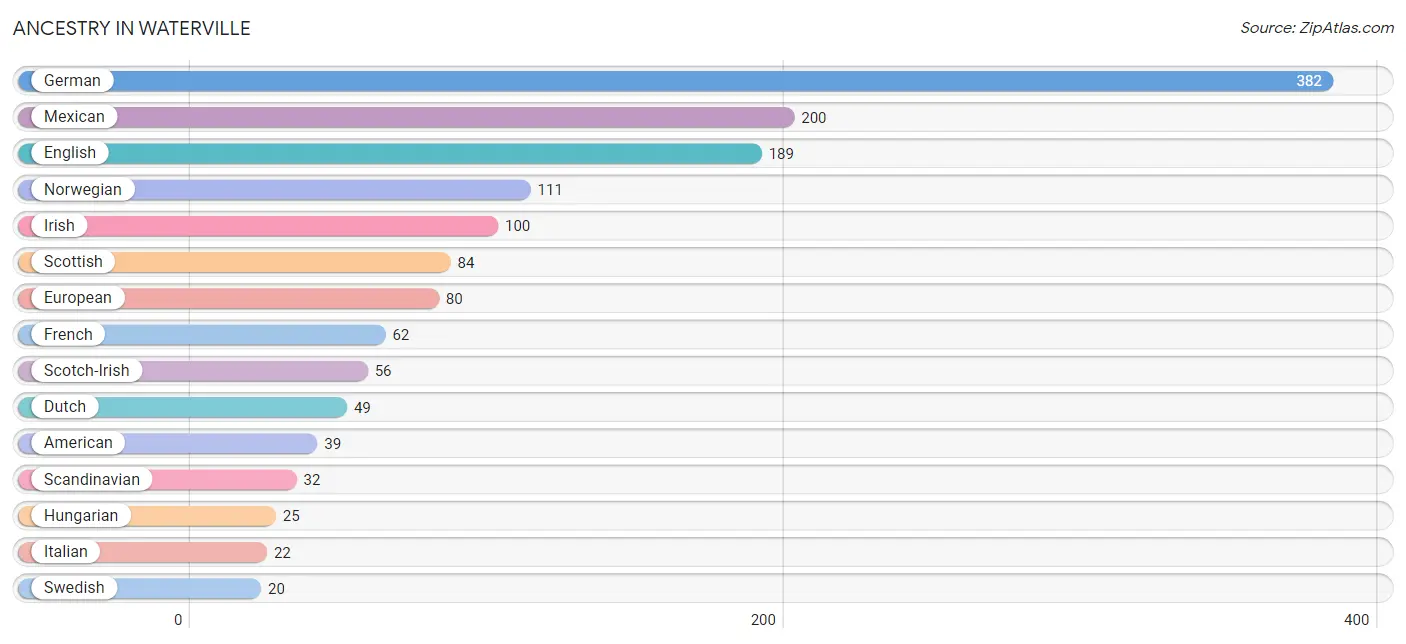
| Ancestry | # Population | % Population |
| American | 39 | 2.6% |
| British | 15 | 1.0% |
| Canadian | 12 | 0.8% |
| Dutch | 49 | 3.3% |
| English | 189 | 12.7% |
| European | 80 | 5.4% |
| French | 62 | 4.2% |
| German | 382 | 25.7% |
| Greek | 3 | 0.2% |
| Hungarian | 25 | 1.7% |
| Indian (Asian) | 8 | 0.5% |
| Irish | 100 | 6.7% |
| Italian | 22 | 1.5% |
| Korean | 7 | 0.5% |
| Mexican | 200 | 13.4% |
| Native Hawaiian | 8 | 0.5% |
| Northern European | 3 | 0.2% |
| Norwegian | 111 | 7.5% |
| Pennsylvania German | 10 | 0.7% |
| Polish | 13 | 0.9% |
| Portuguese | 12 | 0.8% |
| Scandinavian | 32 | 2.1% |
| Scotch-Irish | 56 | 3.8% |
| Scottish | 84 | 5.7% |
| Swedish | 20 | 1.3% |
| Ukrainian | 10 | 0.7% | View All 26 Rows |
Immigrants in Waterville
The most numerous immigrant groups reported in Waterville came from Central America (114 | 7.7%), Latin America (114 | 7.7%), Mexico (114 | 7.7%), and Canada (12 | 0.8%), together accounting for 23.8% of all Waterville residents.
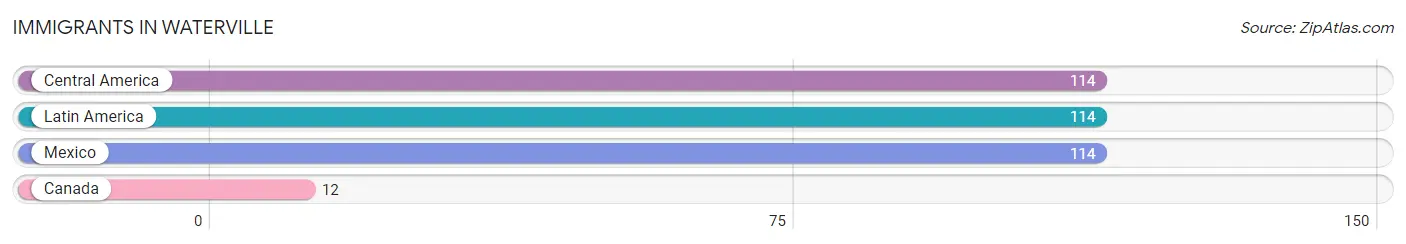
| Immigration Origin | # Population | % Population |
| Canada | 12 | 0.8% |
| Central America | 114 | 7.7% |
| Latin America | 114 | 7.7% |
| Mexico | 114 | 7.7% | View All 4 Rows |
Sex and Age in Waterville
Sex and Age in Waterville
The most populous age groups in Waterville are 25 to 29 Years (110 | 13.5%) for men and 55 to 59 Years (87 | 13.0%) for women.
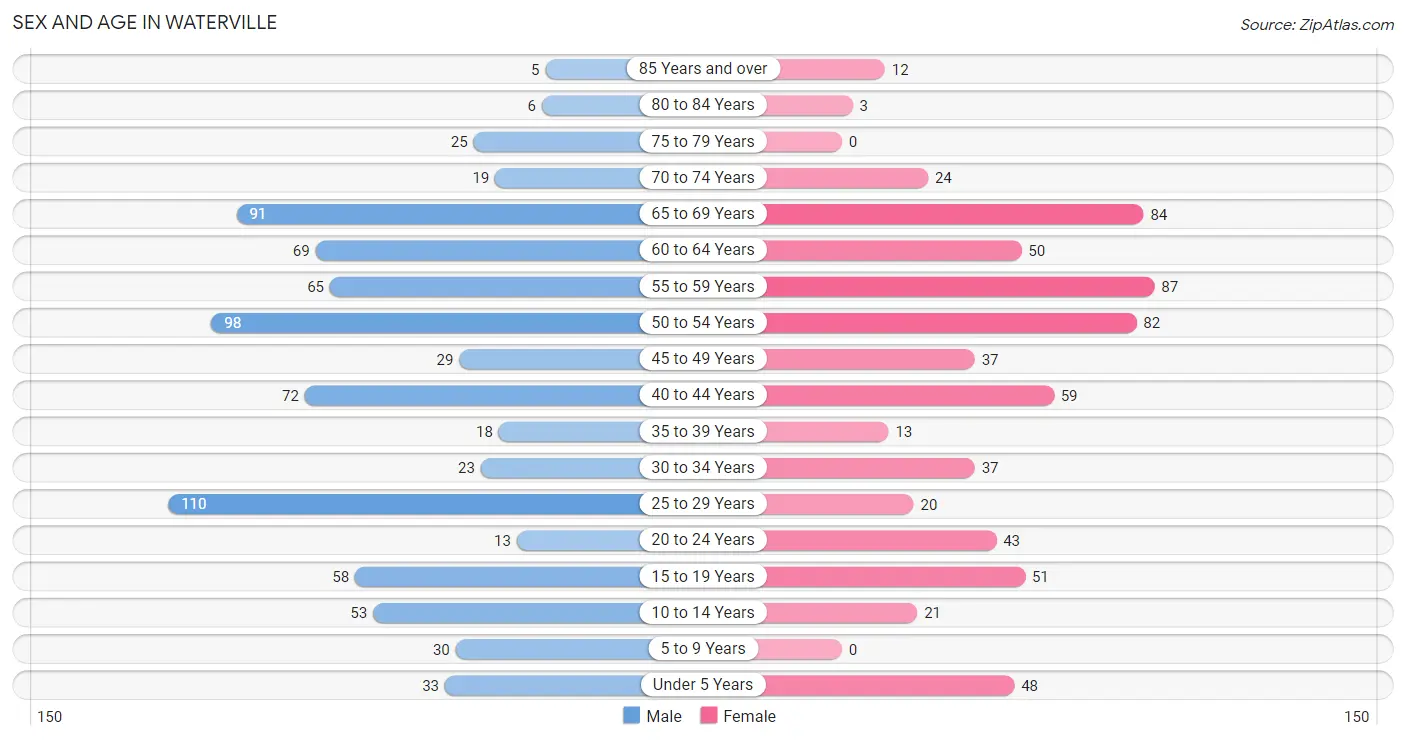
| Age Bracket | Male | Female |
| Under 5 Years | 33 (4.0%) | 48 (7.1%) |
| 5 to 9 Years | 30 (3.7%) | 0 (0.0%) |
| 10 to 14 Years | 53 (6.5%) | 21 (3.1%) |
| 15 to 19 Years | 58 (7.1%) | 51 (7.6%) |
| 20 to 24 Years | 13 (1.6%) | 43 (6.4%) |
| 25 to 29 Years | 110 (13.5%) | 20 (3.0%) |
| 30 to 34 Years | 23 (2.8%) | 37 (5.5%) |
| 35 to 39 Years | 18 (2.2%) | 13 (1.9%) |
| 40 to 44 Years | 72 (8.8%) | 59 (8.8%) |
| 45 to 49 Years | 29 (3.5%) | 37 (5.5%) |
| 50 to 54 Years | 98 (12.0%) | 82 (12.2%) |
| 55 to 59 Years | 65 (8.0%) | 87 (13.0%) |
| 60 to 64 Years | 69 (8.5%) | 50 (7.4%) |
| 65 to 69 Years | 91 (11.1%) | 84 (12.5%) |
| 70 to 74 Years | 19 (2.3%) | 24 (3.6%) |
| 75 to 79 Years | 25 (3.1%) | 0 (0.0%) |
| 80 to 84 Years | 6 (0.7%) | 3 (0.4%) |
| 85 Years and over | 5 (0.6%) | 12 (1.8%) |
| Total | 817 (100.0%) | 671 (100.0%) |
Families and Households in Waterville
Median Family Size in Waterville
The median family size in Waterville is 2.94 persons per family, with married-couple families (362 | 85.0%) accounting for the largest median family size of 3.01 persons per family. On the other hand, single female/mother families (34 | 8.0%) represent the smallest median family size with 2.53 persons per family.
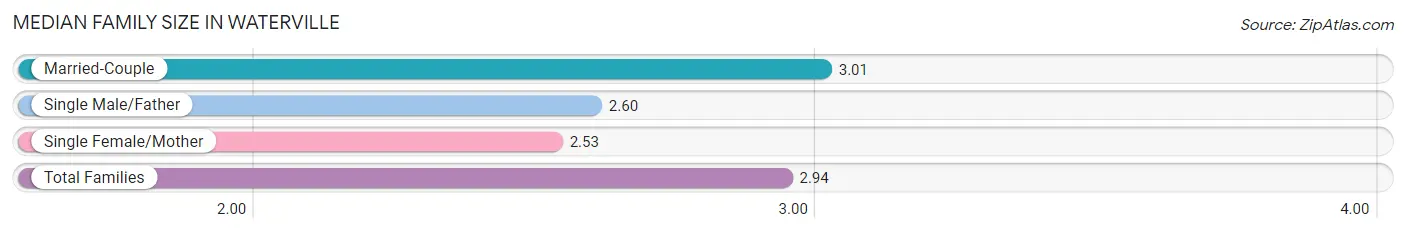
| Family Type | # Families | Family Size |
| Married-Couple | 362 (85.0%) | 3.01 |
| Single Male/Father | 30 (7.0%) | 2.60 |
| Single Female/Mother | 34 (8.0%) | 2.53 |
| Total Families | 426 (100.0%) | 2.94 |
Median Household Size in Waterville
The median household size in Waterville is 2.61 persons per household, with single male/father households (30 | 5.3%) accounting for the largest median household size of 3.87 persons per household. non-family households (139 | 24.6%) represent the smallest median household size with 1.24 persons per household.
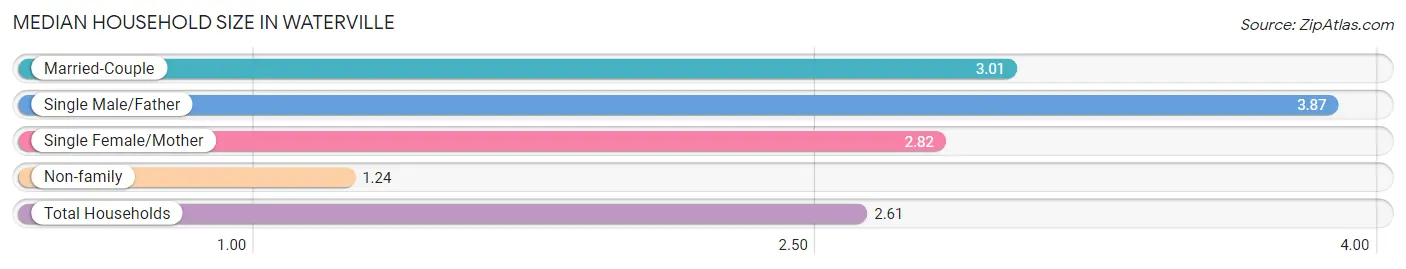
| Household Type | # Households | Household Size |
| Married-Couple | 362 (64.1%) | 3.01 |
| Single Male/Father | 30 (5.3%) | 3.87 |
| Single Female/Mother | 34 (6.0%) | 2.82 |
| Non-family | 139 (24.6%) | 1.24 |
| Total Households | 565 (100.0%) | 2.61 |
Household Size by Marriage Status in Waterville
Out of a total of 565 households in Waterville, 426 (75.4%) are family households, while 139 (24.6%) are nonfamily households. The most numerous type of family households are 2-person households, comprising 213, and the most common type of nonfamily households are 1-person households, comprising 101.
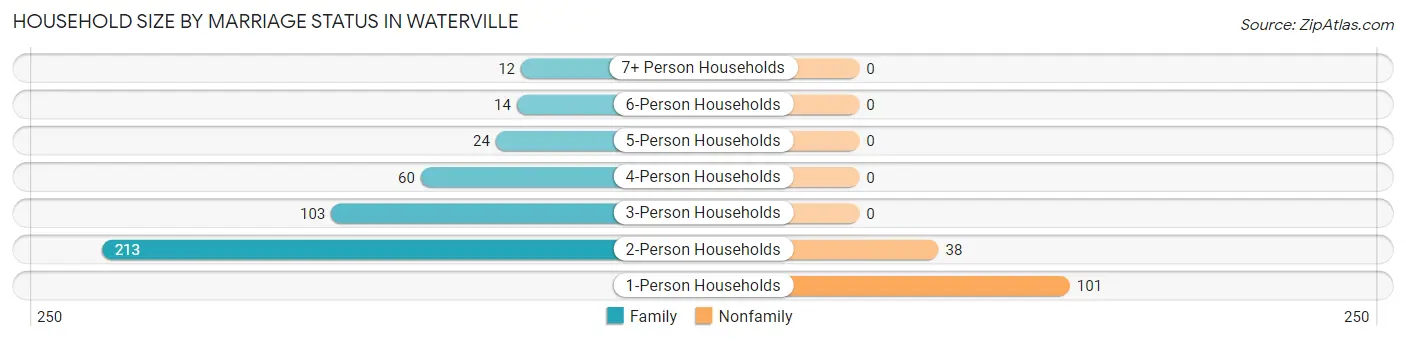
| Household Size | Family Households | Nonfamily Households |
| 1-Person Households | - | 101 (17.9%) |
| 2-Person Households | 213 (37.7%) | 38 (6.7%) |
| 3-Person Households | 103 (18.2%) | 0 (0.0%) |
| 4-Person Households | 60 (10.6%) | 0 (0.0%) |
| 5-Person Households | 24 (4.3%) | 0 (0.0%) |
| 6-Person Households | 14 (2.5%) | 0 (0.0%) |
| 7+ Person Households | 12 (2.1%) | 0 (0.0%) |
| Total | 426 (75.4%) | 139 (24.6%) |
Female Fertility in Waterville
Fertility by Age in Waterville
Average fertility rate in Waterville is 94.0 births per 1,000 women. Women in the age bracket of 20 to 34 years have the highest fertility rate with 190.0 births per 1,000 women. Women in the age bracket of 20 to 34 years acount for 76.0% of all women with births.
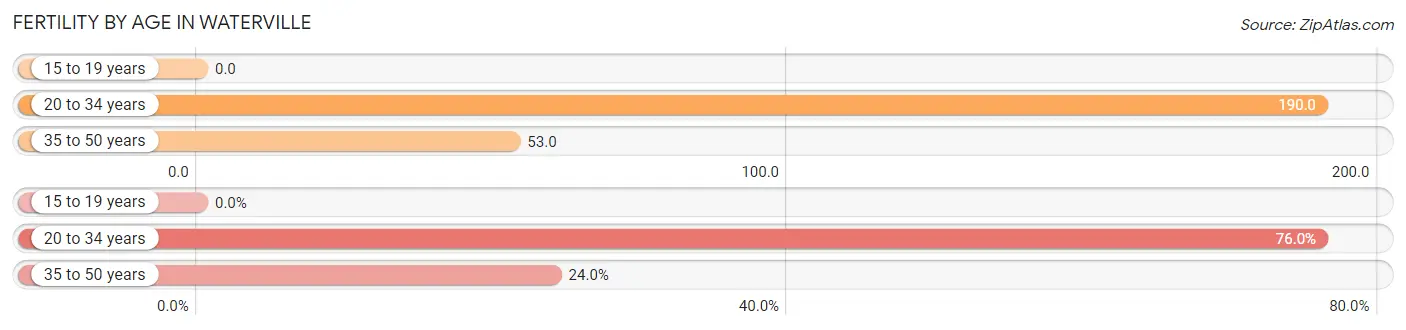
| Age Bracket | Women with Births | Births / 1,000 Women |
| 15 to 19 years | 0 (0.0%) | 0.0 |
| 20 to 34 years | 19 (76.0%) | 190.0 |
| 35 to 50 years | 6 (24.0%) | 53.0 |
| Total | 25 (100.0%) | 94.0 |
Fertility by Age by Marriage Status in Waterville
64.0% of women with births (25) in Waterville are married. The highest percentage of unmarried women with births falls into 20 to 34 years age bracket with 47.4% of them unmarried at the time of birth, while the lowest percentage of unmarried women with births belong to 35 to 50 years age bracket with 0.0% of them unmarried.
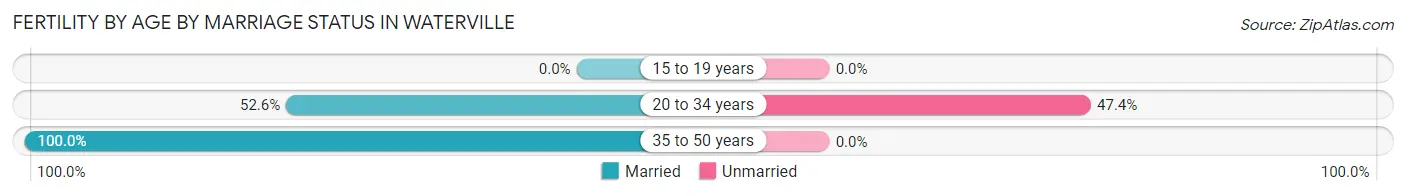
| Age Bracket | Married | Unmarried |
| 15 to 19 years | 0 (0.0%) | 0 (0.0%) |
| 20 to 34 years | 10 (52.6%) | 9 (47.4%) |
| 35 to 50 years | 6 (100.0%) | 0 (0.0%) |
| Total | 16 (64.0%) | 9 (36.0%) |
Fertility by Education in Waterville
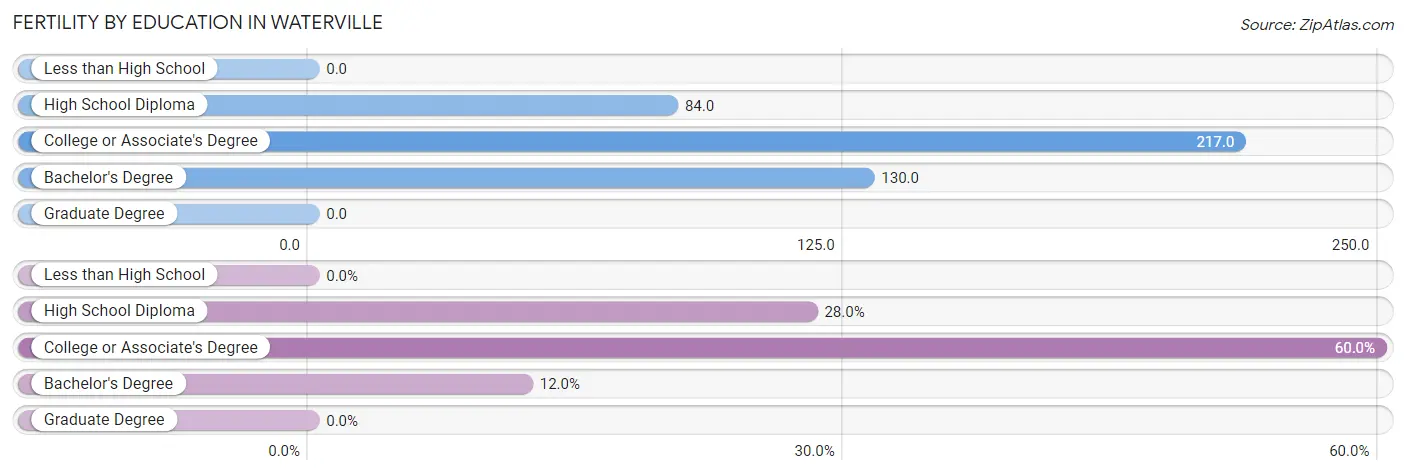
| Educational Attainment | Women with Births | Births / 1,000 Women |
| Less than High School | 0 (0.0%) | 0.0 |
| High School Diploma | 7 (28.0%) | 84.0 |
| College or Associate's Degree | 15 (60.0%) | 217.0 |
| Bachelor's Degree | 3 (12.0%) | 130.0 |
| Graduate Degree | 0 (0.0%) | 0.0 |
| Total | 25 (100.0%) | 94.0 |
Fertility by Education by Marriage Status in Waterville
36.0% of women with births in Waterville are unmarried. Women with the educational attainment of high school diploma are most likely to be married with 100.0% of them married at childbirth, while women with the educational attainment of college or associate's degree are least likely to be married with 60.0% of them unmarried at childbirth.
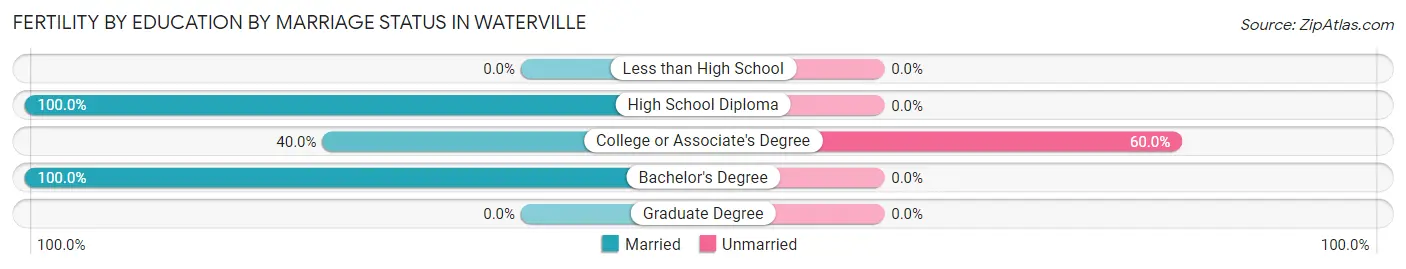
| Educational Attainment | Married | Unmarried |
| Less than High School | 0 (0.0%) | 0 (0.0%) |
| High School Diploma | 7 (100.0%) | 0 (0.0%) |
| College or Associate's Degree | 6 (40.0%) | 9 (60.0%) |
| Bachelor's Degree | 3 (100.0%) | 0 (0.0%) |
| Graduate Degree | 0 (0.0%) | 0 (0.0%) |
| Total | 16 (64.0%) | 9 (36.0%) |
Employment Characteristics in Waterville
Employment by Class of Employer in Waterville
Among the 859 employed individuals in Waterville, private company employees (552 | 64.3%), local government employees (83 | 9.7%), and self-employed (incorporated) (77 | 9.0%) make up the most common classes of employment.
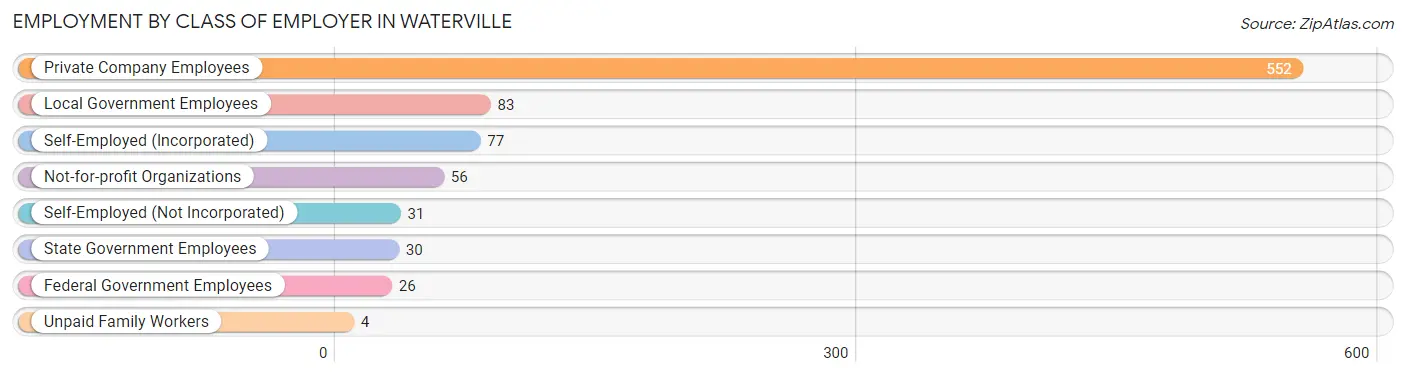
| Employer Class | # Employees | % Employees |
| Private Company Employees | 552 | 64.3% |
| Self-Employed (Incorporated) | 77 | 9.0% |
| Self-Employed (Not Incorporated) | 31 | 3.6% |
| Not-for-profit Organizations | 56 | 6.5% |
| Local Government Employees | 83 | 9.7% |
| State Government Employees | 30 | 3.5% |
| Federal Government Employees | 26 | 3.0% |
| Unpaid Family Workers | 4 | 0.5% |
| Total | 859 | 100.0% |
Employment Status by Age in Waterville
According to the labor force statistics for Waterville, out of the total population over 16 years of age (1,258), 71.5% or 899 individuals are in the labor force, with 1.3% or 12 of them unemployed. The age group with the highest labor force participation rate is 35 to 44 years, with 95.1% or 154 individuals in the labor force. Within the labor force, the 60 to 64 years age range has the highest percentage of unemployed individuals, with 6.1% or 3 of them being unemployed.
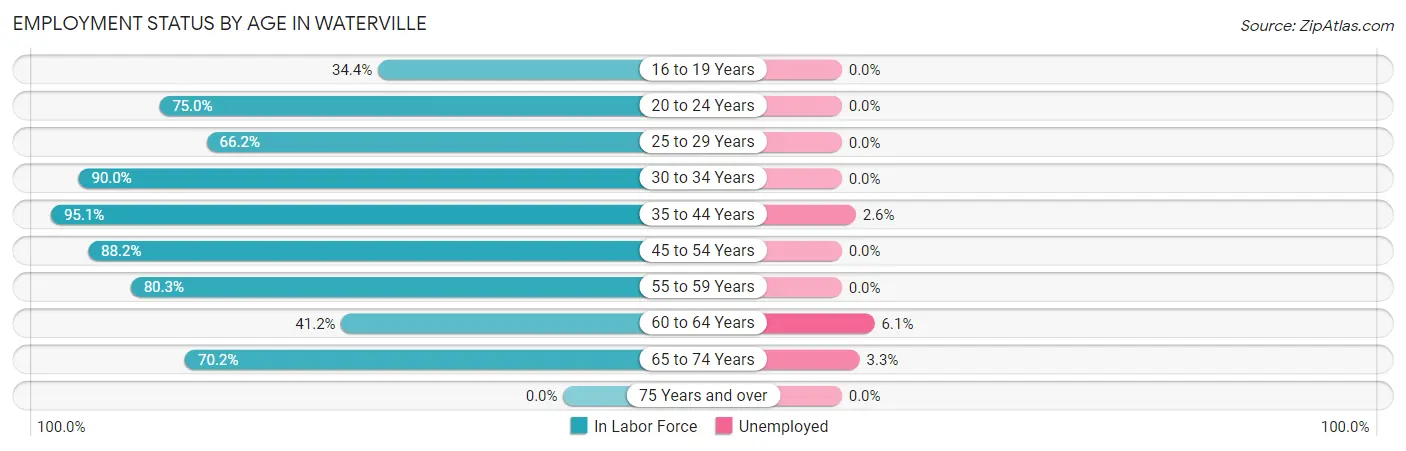
| Age Bracket | In Labor Force | Unemployed |
| 16 to 19 Years | 22 (34.4%) | 0 (0.0%) |
| 20 to 24 Years | 42 (75.0%) | 0 (0.0%) |
| 25 to 29 Years | 86 (66.2%) | 0 (0.0%) |
| 30 to 34 Years | 54 (90.0%) | 0 (0.0%) |
| 35 to 44 Years | 154 (95.1%) | 4 (2.6%) |
| 45 to 54 Years | 217 (88.2%) | 0 (0.0%) |
| 55 to 59 Years | 122 (80.3%) | 0 (0.0%) |
| 60 to 64 Years | 49 (41.2%) | 3 (6.1%) |
| 65 to 74 Years | 153 (70.2%) | 5 (3.3%) |
| 75 Years and over | 0 (0.0%) | 0 (0.0%) |
| Total | 899 (71.5%) | 12 (1.3%) |
Employment Status by Educational Attainment in Waterville
According to labor force statistics for Waterville, 78.5% of individuals (682) out of the total population between 25 and 64 years of age (869) are in the labor force, with 1.0% or 7 of them being unemployed. The group with the highest labor force participation rate are those with the educational attainment of bachelor's degree or higher, with 96.7% or 117 individuals in the labor force. Within the labor force, individuals with college / associate degree education have the highest percentage of unemployment, with 2.3% or 4 of them being unemployed.
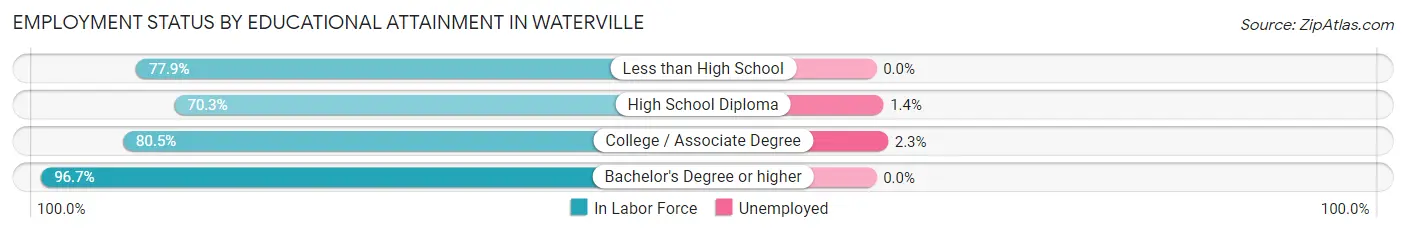
| Educational Attainment | In Labor Force | Unemployed |
| Less than High School | 173 (77.9%) | 0 (0.0%) |
| High School Diploma | 215 (70.3%) | 4 (1.4%) |
| College / Associate Degree | 177 (80.5%) | 5 (2.3%) |
| Bachelor's Degree or higher | 117 (96.7%) | 0 (0.0%) |
| Total | 682 (78.5%) | 9 (1.0%) |
Employment Occupations by Sex in Waterville
Management, Business, Science and Arts Occupations
The most common Management, Business, Science and Arts occupations in Waterville are Management (77 | 8.7%), Community & Social Service (43 | 4.9%), Computers, Engineering & Science (40 | 4.5%), Education Instruction & Library (39 | 4.4%), and Health Diagnosing & Treating (22 | 2.5%).
Management, Business, Science and Arts Occupations by Sex
Within the Management, Business, Science and Arts occupations in Waterville, the most male-oriented occupations are Architecture & Engineering (100.0%), Management (84.4%), and Computers, Engineering & Science (52.5%), while the most female-oriented occupations are Computers & Mathematics (100.0%), Life, Physical & Social Science (100.0%), and Education, Arts & Media (100.0%).
| Occupation | Male | Female |
| Management | 65 (84.4%) | 12 (15.6%) |
| Business & Financial | 4 (30.8%) | 9 (69.2%) |
| Computers, Engineering & Science | 21 (52.5%) | 19 (47.5%) |
| Computers & Mathematics | 0 (0.0%) | 9 (100.0%) |
| Architecture & Engineering | 21 (100.0%) | 0 (0.0%) |
| Life, Physical & Social Science | 0 (0.0%) | 10 (100.0%) |
| Community & Social Service | 13 (30.2%) | 30 (69.8%) |
| Education, Arts & Media | 0 (0.0%) | 4 (100.0%) |
| Legal Services & Support | 0 (0.0%) | 0 (0.0%) |
| Education Instruction & Library | 13 (33.3%) | 26 (66.7%) |
| Arts, Media & Entertainment | 0 (0.0%) | 0 (0.0%) |
| Health Diagnosing & Treating | 0 (0.0%) | 22 (100.0%) |
| Health Technologists | 0 (0.0%) | 13 (100.0%) |
| Total (Category) | 103 (52.8%) | 92 (47.2%) |
| Total (Overall) | 463 (52.2%) | 424 (47.8%) |
Services Occupations
The most common Services occupations in Waterville are Healthcare Support (28 | 3.2%), Food Preparation & Serving (22 | 2.5%), Security & Protection (15 | 1.7%), Firefighting & Prevention (11 | 1.2%), and Personal Care & Service (9 | 1.0%).
Services Occupations by Sex
Within the Services occupations in Waterville, the most male-oriented occupations are Law Enforcement (100.0%), Food Preparation & Serving (27.3%), and Security & Protection (26.7%), while the most female-oriented occupations are Firefighting & Prevention (100.0%), Personal Care & Service (100.0%), and Healthcare Support (89.3%).
| Occupation | Male | Female |
| Healthcare Support | 3 (10.7%) | 25 (89.3%) |
| Security & Protection | 4 (26.7%) | 11 (73.3%) |
| Firefighting & Prevention | 0 (0.0%) | 11 (100.0%) |
| Law Enforcement | 4 (100.0%) | 0 (0.0%) |
| Food Preparation & Serving | 6 (27.3%) | 16 (72.7%) |
| Cleaning & Maintenance | 0 (0.0%) | 0 (0.0%) |
| Personal Care & Service | 0 (0.0%) | 9 (100.0%) |
| Total (Category) | 13 (17.6%) | 61 (82.4%) |
| Total (Overall) | 463 (52.2%) | 424 (47.8%) |
Sales and Office Occupations
The most common Sales and Office occupations in Waterville are Sales & Related (128 | 14.4%), and Office & Administration (73 | 8.2%).
Sales and Office Occupations by Sex
| Occupation | Male | Female |
| Sales & Related | 46 (35.9%) | 82 (64.1%) |
| Office & Administration | 0 (0.0%) | 73 (100.0%) |
| Total (Category) | 46 (22.9%) | 155 (77.1%) |
| Total (Overall) | 463 (52.2%) | 424 (47.8%) |
Natural Resources, Construction and Maintenance Occupations
The most common Natural Resources, Construction and Maintenance occupations in Waterville are Construction & Extraction (109 | 12.3%), Installation, Maintenance & Repair (60 | 6.8%), and Farming, Fishing & Forestry (58 | 6.5%).
Natural Resources, Construction and Maintenance Occupations by Sex
| Occupation | Male | Female |
| Farming, Fishing & Forestry | 58 (100.0%) | 0 (0.0%) |
| Construction & Extraction | 109 (100.0%) | 0 (0.0%) |
| Installation, Maintenance & Repair | 60 (100.0%) | 0 (0.0%) |
| Total (Category) | 227 (100.0%) | 0 (0.0%) |
| Total (Overall) | 463 (52.2%) | 424 (47.8%) |
Production, Transportation and Moving Occupations
The most common Production, Transportation and Moving occupations in Waterville are Material Moving (87 | 9.8%), Production (68 | 7.7%), and Transportation (35 | 4.0%).
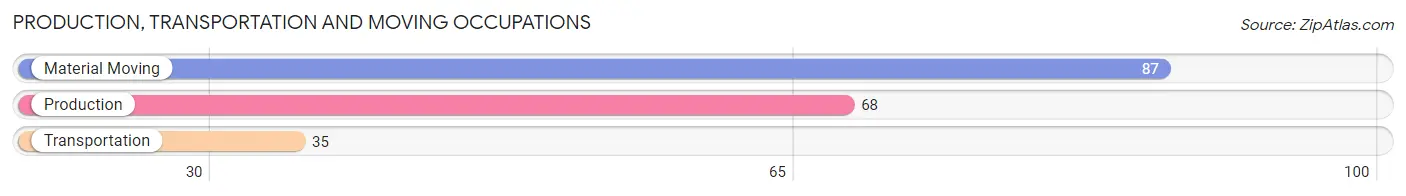
Production, Transportation and Moving Occupations by Sex
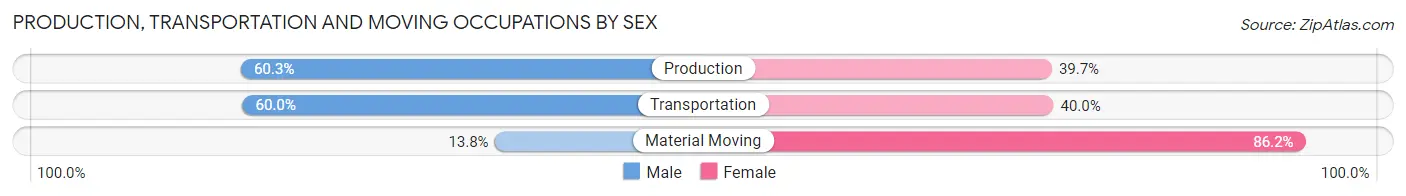
| Occupation | Male | Female |
| Production | 41 (60.3%) | 27 (39.7%) |
| Transportation | 21 (60.0%) | 14 (40.0%) |
| Material Moving | 12 (13.8%) | 75 (86.2%) |
| Total (Category) | 74 (39.0%) | 116 (61.1%) |
| Total (Overall) | 463 (52.2%) | 424 (47.8%) |
Employment Industries by Sex in Waterville
Employment Industries in Waterville
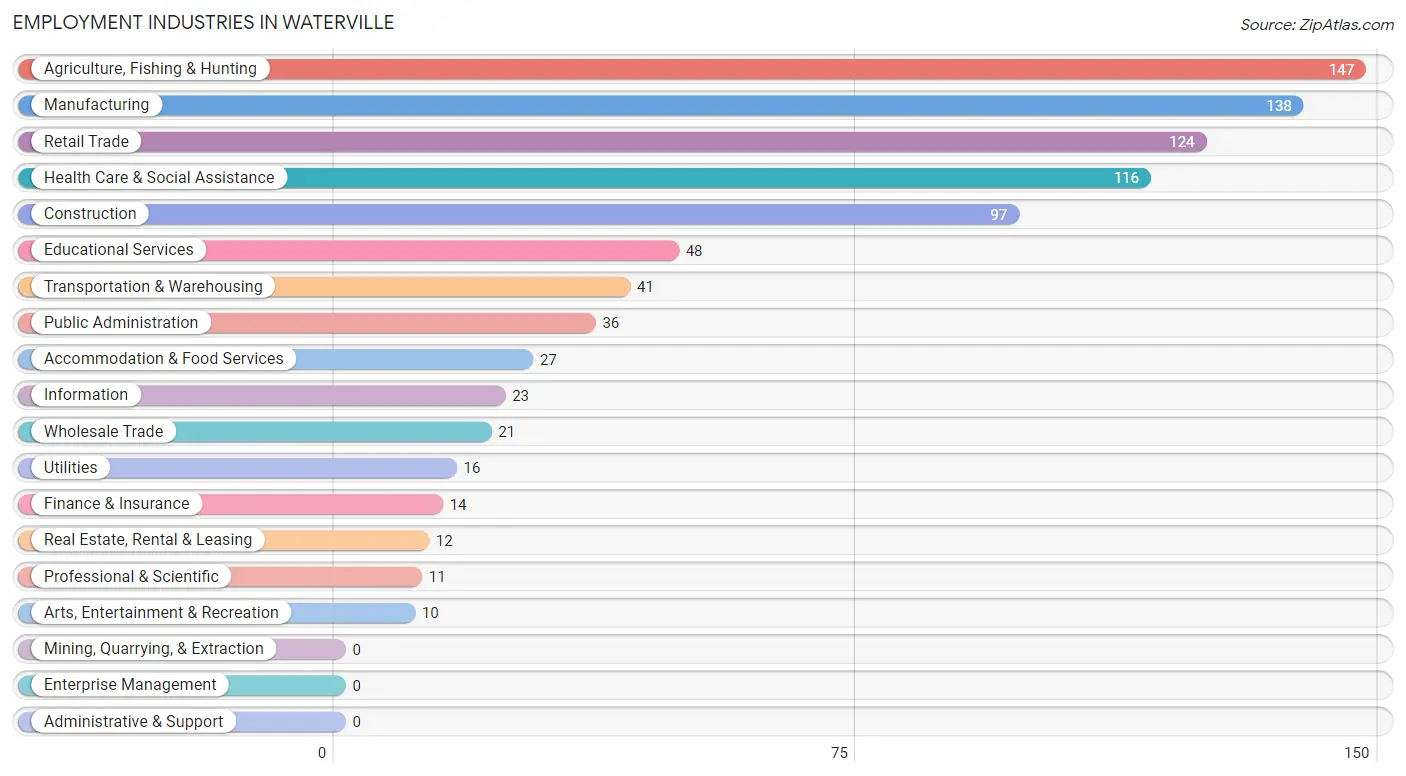
The major employment industries in Waterville include Agriculture, Fishing & Hunting (147 | 16.6%), Manufacturing (138 | 15.6%), Retail Trade (124 | 14.0%), Health Care & Social Assistance (116 | 13.1%), and Construction (97 | 10.9%).
Employment Industries by Sex in Waterville
The Waterville industries that see more men than women are Construction (100.0%), Wholesale Trade (100.0%), and Utilities (100.0%), whereas the industries that tend to have a higher number of women are Finance & Insurance (100.0%), Real Estate, Rental & Leasing (100.0%), and Health Care & Social Assistance (97.4%).
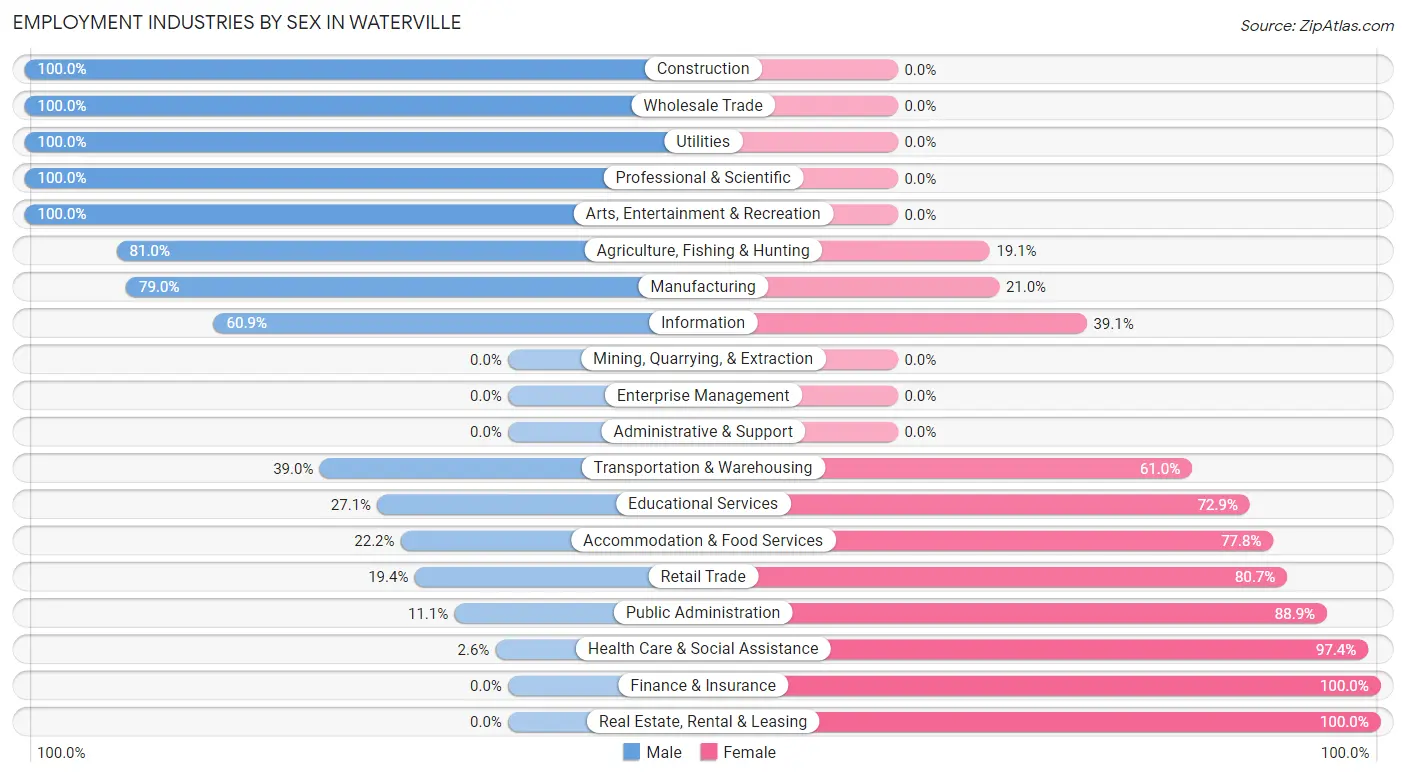
| Industry | Male | Female |
| Agriculture, Fishing & Hunting | 119 (80.9%) | 28 (19.1%) |
| Mining, Quarrying, & Extraction | 0 (0.0%) | 0 (0.0%) |
| Construction | 97 (100.0%) | 0 (0.0%) |
| Manufacturing | 109 (79.0%) | 29 (21.0%) |
| Wholesale Trade | 21 (100.0%) | 0 (0.0%) |
| Retail Trade | 24 (19.4%) | 100 (80.6%) |
| Transportation & Warehousing | 16 (39.0%) | 25 (61.0%) |
| Utilities | 16 (100.0%) | 0 (0.0%) |
| Information | 14 (60.9%) | 9 (39.1%) |
| Finance & Insurance | 0 (0.0%) | 14 (100.0%) |
| Real Estate, Rental & Leasing | 0 (0.0%) | 12 (100.0%) |
| Professional & Scientific | 11 (100.0%) | 0 (0.0%) |
| Enterprise Management | 0 (0.0%) | 0 (0.0%) |
| Administrative & Support | 0 (0.0%) | 0 (0.0%) |
| Educational Services | 13 (27.1%) | 35 (72.9%) |
| Health Care & Social Assistance | 3 (2.6%) | 113 (97.4%) |
| Arts, Entertainment & Recreation | 10 (100.0%) | 0 (0.0%) |
| Accommodation & Food Services | 6 (22.2%) | 21 (77.8%) |
| Public Administration | 4 (11.1%) | 32 (88.9%) |
| Total | 463 (52.2%) | 424 (47.8%) |
Education in Waterville
School Enrollment in Waterville
The most common levels of schooling among the 219 students in Waterville are middle school (66 | 30.1%), high school (62 | 28.3%), and college / undergraduate (40 | 18.3%).
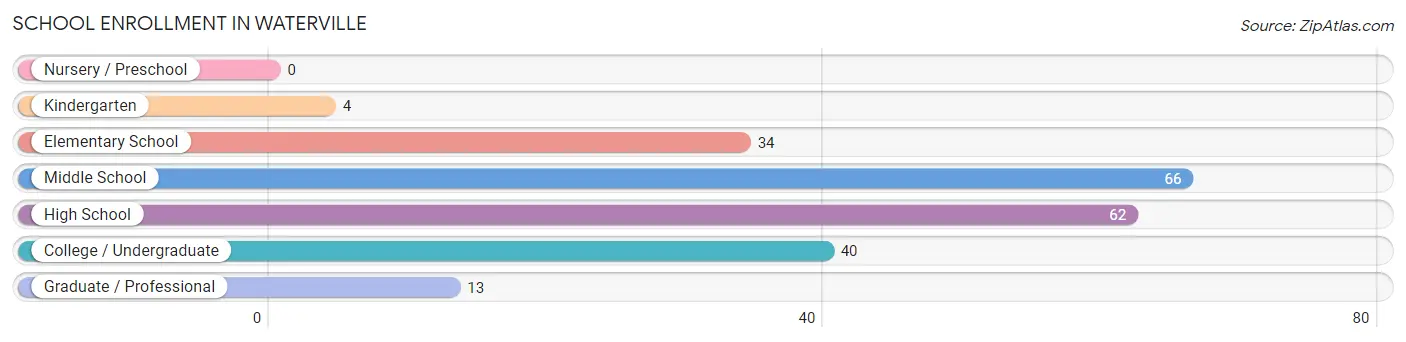
| School Level | # Students | % Students |
| Nursery / Preschool | 0 | 0.0% |
| Kindergarten | 4 | 1.8% |
| Elementary School | 34 | 15.5% |
| Middle School | 66 | 30.1% |
| High School | 62 | 28.3% |
| College / Undergraduate | 40 | 18.3% |
| Graduate / Professional | 13 | 5.9% |
| Total | 219 | 100.0% |
School Enrollment by Age by Funding Source in Waterville
Out of a total of 219 students who are enrolled in schools in Waterville, 40 (18.3%) attend a private institution, while the remaining 179 (81.7%) are enrolled in public schools. The age group of 18 to 19 year olds has the highest likelihood of being enrolled in private schools, with 15 (100.0% in the age bracket) enrolled. Conversely, the age group of 5 to 9 year old has the lowest likelihood of being enrolled in a private school, with 30 (100.0% in the age bracket) attending a public institution.
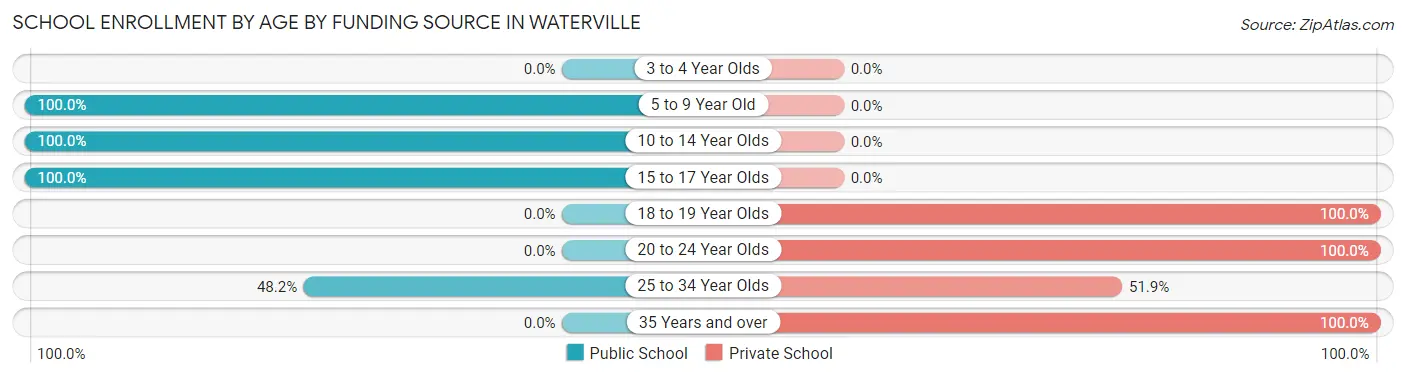
| Age Bracket | Public School | Private School |
| 3 to 4 Year Olds | 0 (0.0%) | 0 (0.0%) |
| 5 to 9 Year Old | 30 (100.0%) | 0 (0.0%) |
| 10 to 14 Year Olds | 74 (100.0%) | 0 (0.0%) |
| 15 to 17 Year Olds | 62 (100.0%) | 0 (0.0%) |
| 18 to 19 Year Olds | 0 (0.0%) | 15 (100.0%) |
| 20 to 24 Year Olds | 0 (0.0%) | 7 (100.0%) |
| 25 to 34 Year Olds | 13 (48.1%) | 14 (51.8%) |
| 35 Years and over | 0 (0.0%) | 4 (100.0%) |
| Total | 179 (81.7%) | 40 (18.3%) |
Educational Attainment by Field of Study in Waterville
Education (50 | 33.8%), business (32 | 21.6%), liberal arts & history (23 | 15.5%), science & technology (22 | 14.9%), and social sciences (10 | 6.8%) are the most common fields of study among 148 individuals in Waterville who have obtained a bachelor's degree or higher.
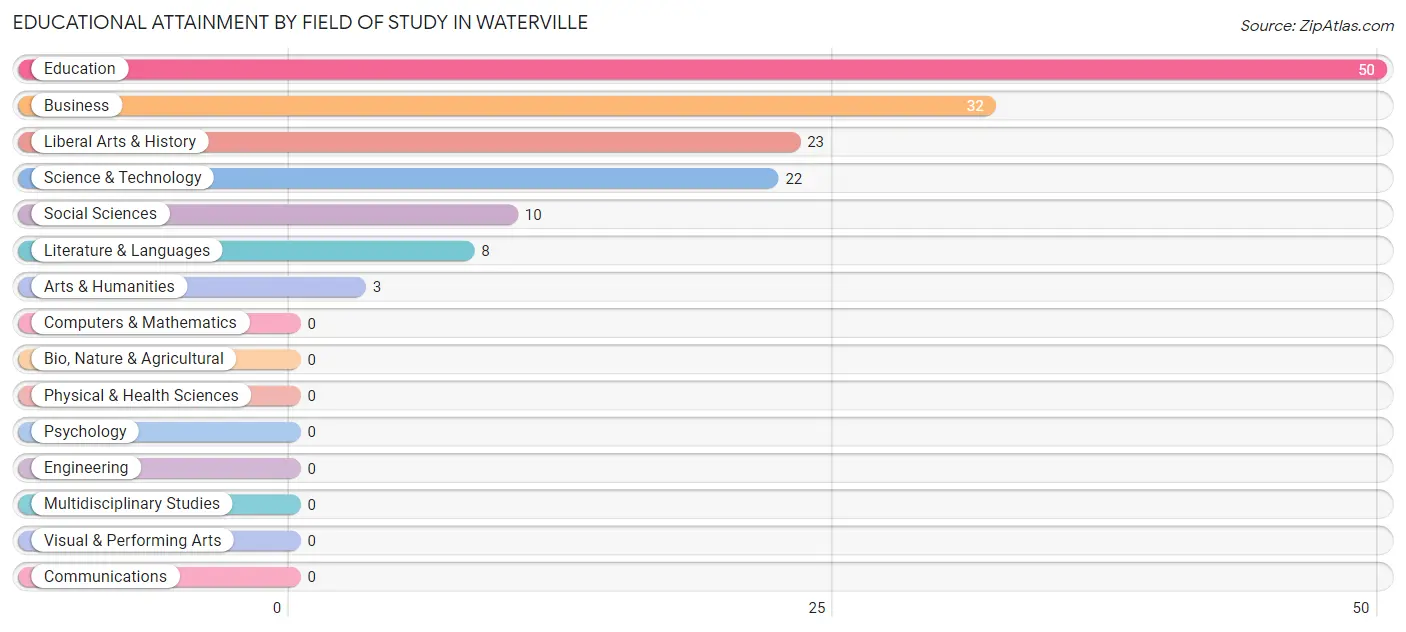
| Field of Study | # Graduates | % Graduates |
| Computers & Mathematics | 0 | 0.0% |
| Bio, Nature & Agricultural | 0 | 0.0% |
| Physical & Health Sciences | 0 | 0.0% |
| Psychology | 0 | 0.0% |
| Social Sciences | 10 | 6.8% |
| Engineering | 0 | 0.0% |
| Multidisciplinary Studies | 0 | 0.0% |
| Science & Technology | 22 | 14.9% |
| Business | 32 | 21.6% |
| Education | 50 | 33.8% |
| Literature & Languages | 8 | 5.4% |
| Liberal Arts & History | 23 | 15.5% |
| Visual & Performing Arts | 0 | 0.0% |
| Communications | 0 | 0.0% |
| Arts & Humanities | 3 | 2.0% |
| Total | 148 | 100.0% |
Transportation & Commute in Waterville
Vehicle Availability by Sex in Waterville
The most prevalent vehicle ownership categories in Waterville are males with 3 vehicles (151, accounting for 34.5%) and females with 3 vehicles (84, making up 35.9%).
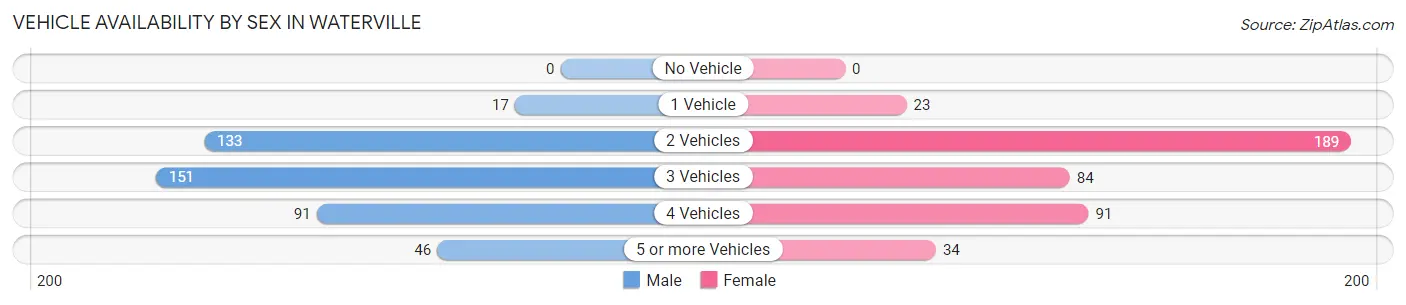
| Vehicles Available | Male | Female |
| No Vehicle | 0 (0.0%) | 0 (0.0%) |
| 1 Vehicle | 17 (3.9%) | 23 (5.5%) |
| 2 Vehicles | 133 (30.4%) | 189 (44.9%) |
| 3 Vehicles | 151 (34.5%) | 84 (20.0%) |
| 4 Vehicles | 91 (20.8%) | 91 (21.6%) |
| 5 or more Vehicles | 46 (10.5%) | 34 (8.1%) |
| Total | 438 (100.0%) | 421 (100.0%) |
Commute Time in Waterville
The most frequently occuring commute durations in Waterville are 40 to 44 minutes (188 commuters, 25.3%), 5 to 9 minutes (143 commuters, 19.2%), and 45 to 59 minutes (96 commuters, 12.9%).
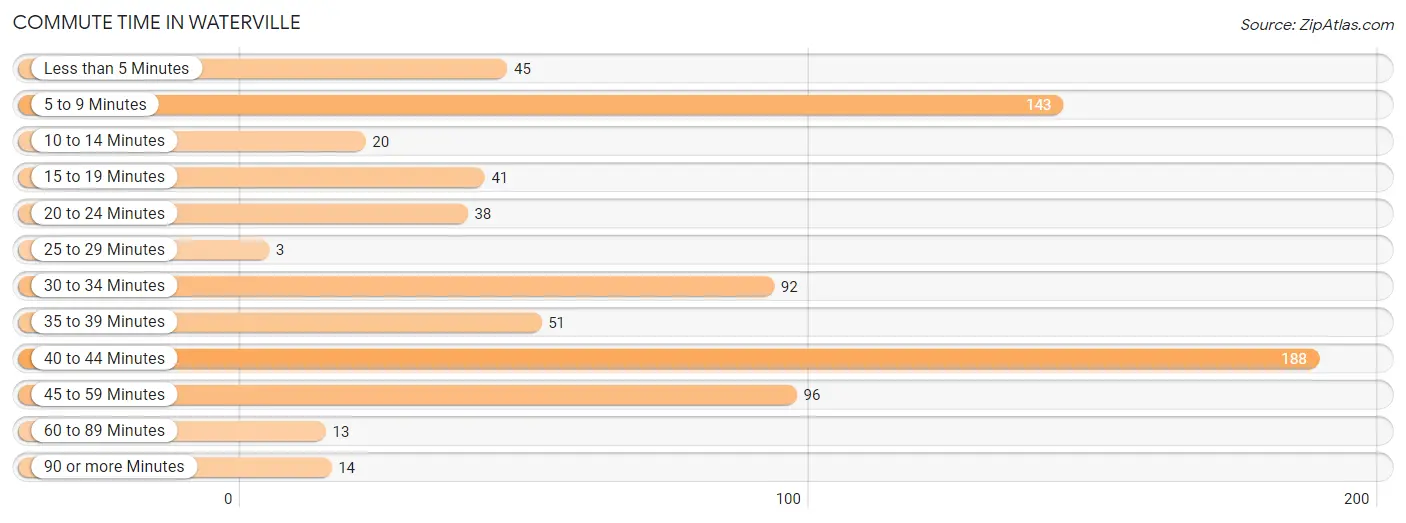
| Commute Time | # Commuters | % Commuters |
| Less than 5 Minutes | 45 | 6.0% |
| 5 to 9 Minutes | 143 | 19.2% |
| 10 to 14 Minutes | 20 | 2.7% |
| 15 to 19 Minutes | 41 | 5.5% |
| 20 to 24 Minutes | 38 | 5.1% |
| 25 to 29 Minutes | 3 | 0.4% |
| 30 to 34 Minutes | 92 | 12.4% |
| 35 to 39 Minutes | 51 | 6.9% |
| 40 to 44 Minutes | 188 | 25.3% |
| 45 to 59 Minutes | 96 | 12.9% |
| 60 to 89 Minutes | 13 | 1.8% |
| 90 or more Minutes | 14 | 1.9% |
Commute Time by Sex in Waterville
The most common commute times in Waterville are 40 to 44 minutes (98 commuters, 25.3%) for males and 40 to 44 minutes (90 commuters, 25.2%) for females.
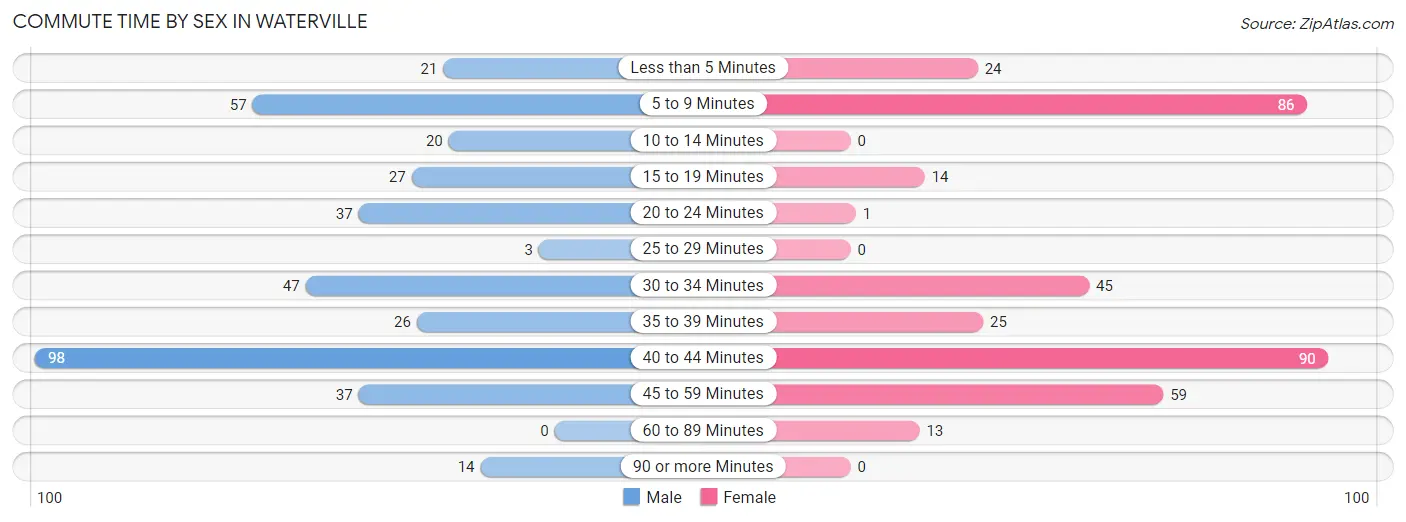
| Commute Time | Male | Female |
| Less than 5 Minutes | 21 (5.4%) | 24 (6.7%) |
| 5 to 9 Minutes | 57 (14.7%) | 86 (24.1%) |
| 10 to 14 Minutes | 20 (5.2%) | 0 (0.0%) |
| 15 to 19 Minutes | 27 (7.0%) | 14 (3.9%) |
| 20 to 24 Minutes | 37 (9.6%) | 1 (0.3%) |
| 25 to 29 Minutes | 3 (0.8%) | 0 (0.0%) |
| 30 to 34 Minutes | 47 (12.1%) | 45 (12.6%) |
| 35 to 39 Minutes | 26 (6.7%) | 25 (7.0%) |
| 40 to 44 Minutes | 98 (25.3%) | 90 (25.2%) |
| 45 to 59 Minutes | 37 (9.6%) | 59 (16.5%) |
| 60 to 89 Minutes | 0 (0.0%) | 13 (3.6%) |
| 90 or more Minutes | 14 (3.6%) | 0 (0.0%) |
Time of Departure to Work by Sex in Waterville
The most frequent times of departure to work in Waterville are 7:00 AM to 7:29 AM (148, 38.2%) for males and 7:00 AM to 7:29 AM (79, 22.1%) for females.
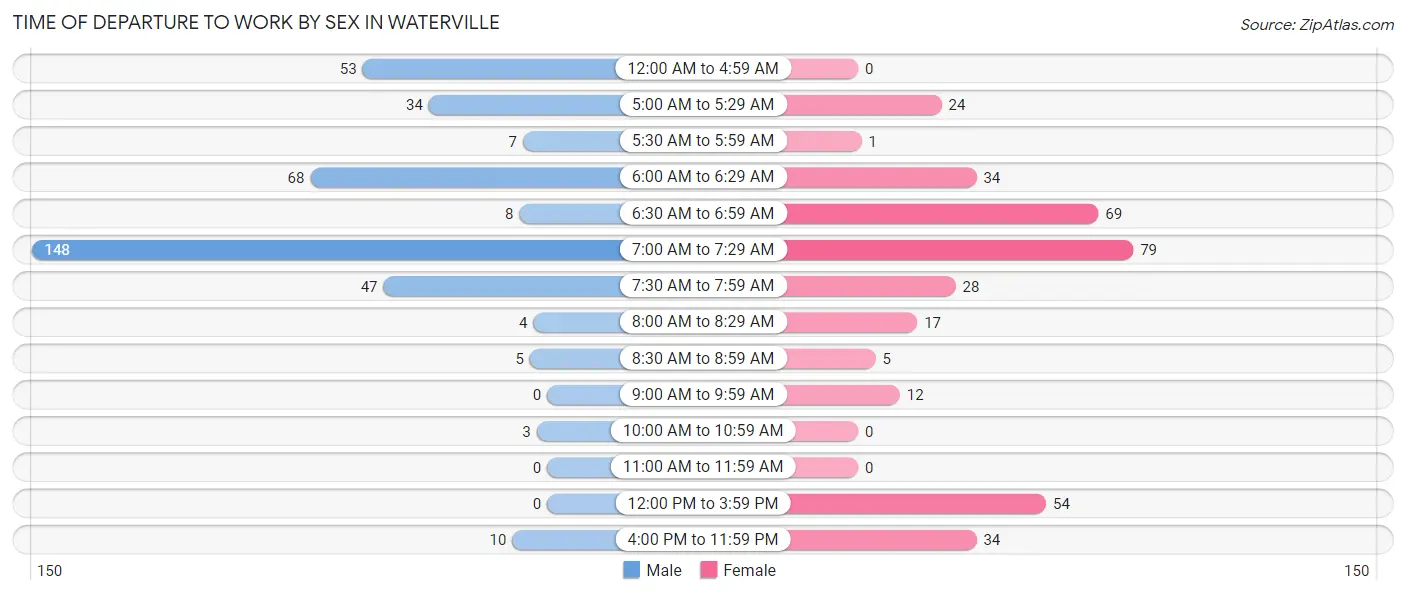
| Time of Departure | Male | Female |
| 12:00 AM to 4:59 AM | 53 (13.7%) | 0 (0.0%) |
| 5:00 AM to 5:29 AM | 34 (8.8%) | 24 (6.7%) |
| 5:30 AM to 5:59 AM | 7 (1.8%) | 1 (0.3%) |
| 6:00 AM to 6:29 AM | 68 (17.6%) | 34 (9.5%) |
| 6:30 AM to 6:59 AM | 8 (2.1%) | 69 (19.3%) |
| 7:00 AM to 7:29 AM | 148 (38.2%) | 79 (22.1%) |
| 7:30 AM to 7:59 AM | 47 (12.1%) | 28 (7.8%) |
| 8:00 AM to 8:29 AM | 4 (1.0%) | 17 (4.8%) |
| 8:30 AM to 8:59 AM | 5 (1.3%) | 5 (1.4%) |
| 9:00 AM to 9:59 AM | 0 (0.0%) | 12 (3.4%) |
| 10:00 AM to 10:59 AM | 3 (0.8%) | 0 (0.0%) |
| 11:00 AM to 11:59 AM | 0 (0.0%) | 0 (0.0%) |
| 12:00 PM to 3:59 PM | 0 (0.0%) | 54 (15.1%) |
| 4:00 PM to 11:59 PM | 10 (2.6%) | 34 (9.5%) |
| Total | 387 (100.0%) | 357 (100.0%) |
Housing Occupancy in Waterville
Occupancy by Ownership in Waterville
Of the total 565 dwellings in Waterville, owner-occupied units account for 478 (84.6%), while renter-occupied units make up 87 (15.4%).
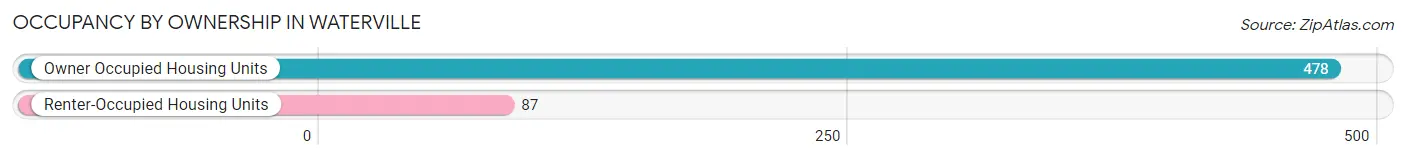
| Occupancy | # Housing Units | % Housing Units |
| Owner Occupied Housing Units | 478 | 84.6% |
| Renter-Occupied Housing Units | 87 | 15.4% |
| Total Occupied Housing Units | 565 | 100.0% |
Occupancy by Household Size in Waterville
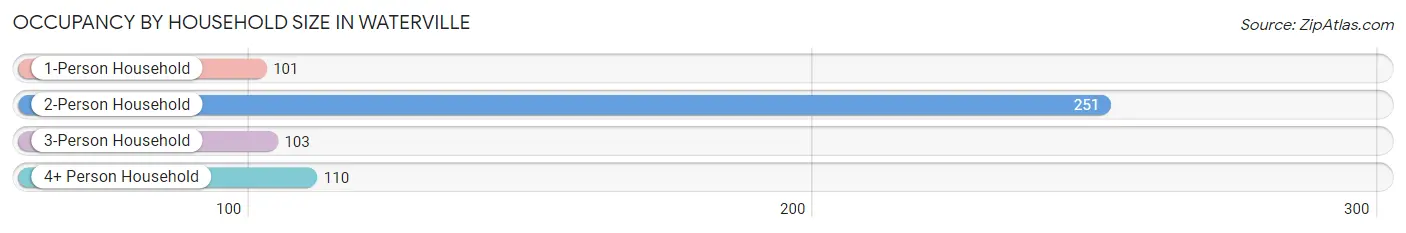
| Household Size | # Housing Units | % Housing Units |
| 1-Person Household | 101 | 17.9% |
| 2-Person Household | 251 | 44.4% |
| 3-Person Household | 103 | 18.2% |
| 4+ Person Household | 110 | 19.5% |
| Total Housing Units | 565 | 100.0% |
Occupancy by Ownership by Household Size in Waterville
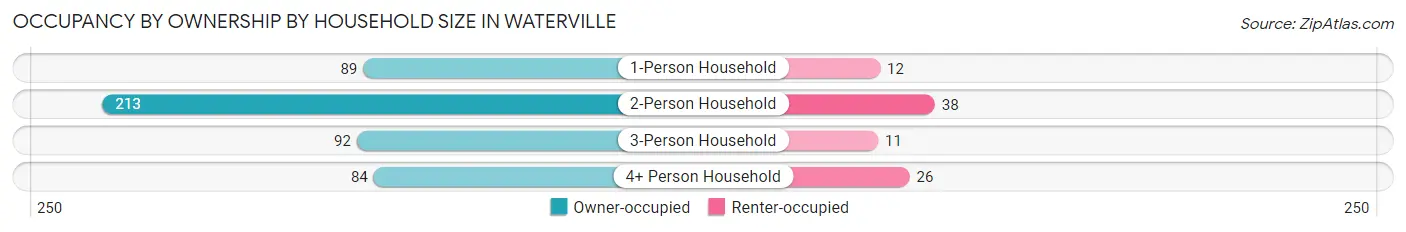
| Household Size | Owner-occupied | Renter-occupied |
| 1-Person Household | 89 (88.1%) | 12 (11.9%) |
| 2-Person Household | 213 (84.9%) | 38 (15.1%) |
| 3-Person Household | 92 (89.3%) | 11 (10.7%) |
| 4+ Person Household | 84 (76.4%) | 26 (23.6%) |
| Total Housing Units | 478 (84.6%) | 87 (15.4%) |
Occupancy by Educational Attainment in Waterville
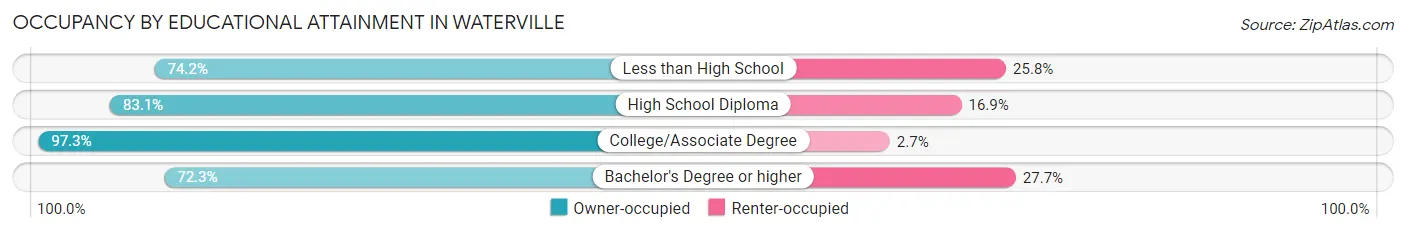
| Household Size | Owner-occupied | Renter-occupied |
| Less than High School | 72 (74.2%) | 25 (25.8%) |
| High School Diploma | 167 (83.1%) | 34 (16.9%) |
| College/Associate Degree | 179 (97.3%) | 5 (2.7%) |
| Bachelor's Degree or higher | 60 (72.3%) | 23 (27.7%) |
Occupancy by Age of Householder in Waterville
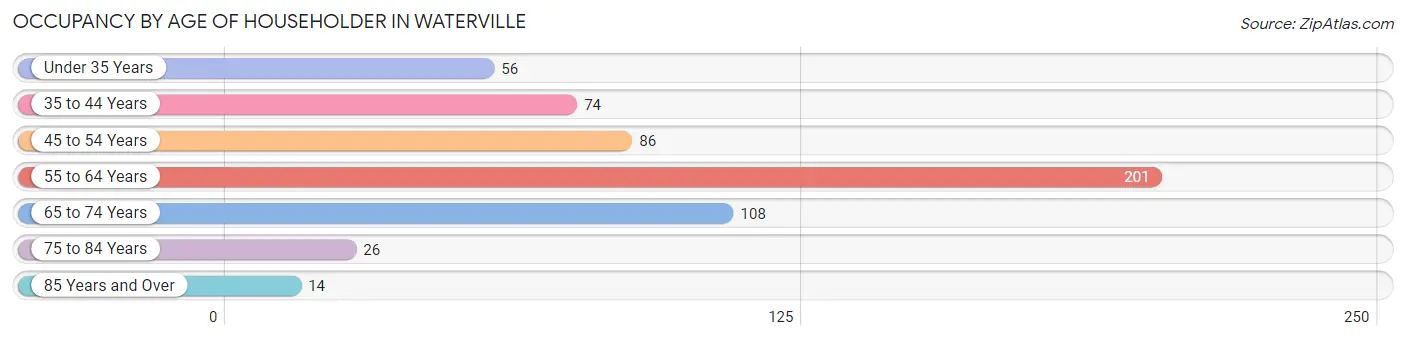
| Age Bracket | # Households | % Households |
| Under 35 Years | 56 | 9.9% |
| 35 to 44 Years | 74 | 13.1% |
| 45 to 54 Years | 86 | 15.2% |
| 55 to 64 Years | 201 | 35.6% |
| 65 to 74 Years | 108 | 19.1% |
| 75 to 84 Years | 26 | 4.6% |
| 85 Years and Over | 14 | 2.5% |
| Total | 565 | 100.0% |
Housing Finances in Waterville
Median Income by Occupancy in Waterville
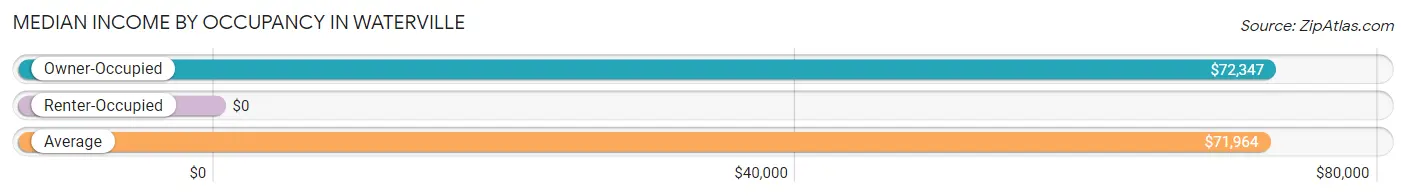
| Occupancy Type | # Households | Median Income |
| Owner-Occupied | 478 (84.6%) | $72,347 |
| Renter-Occupied | 87 (15.4%) | $0 |
| Average | 565 (100.0%) | $71,964 |
Occupancy by Householder Income Bracket in Waterville
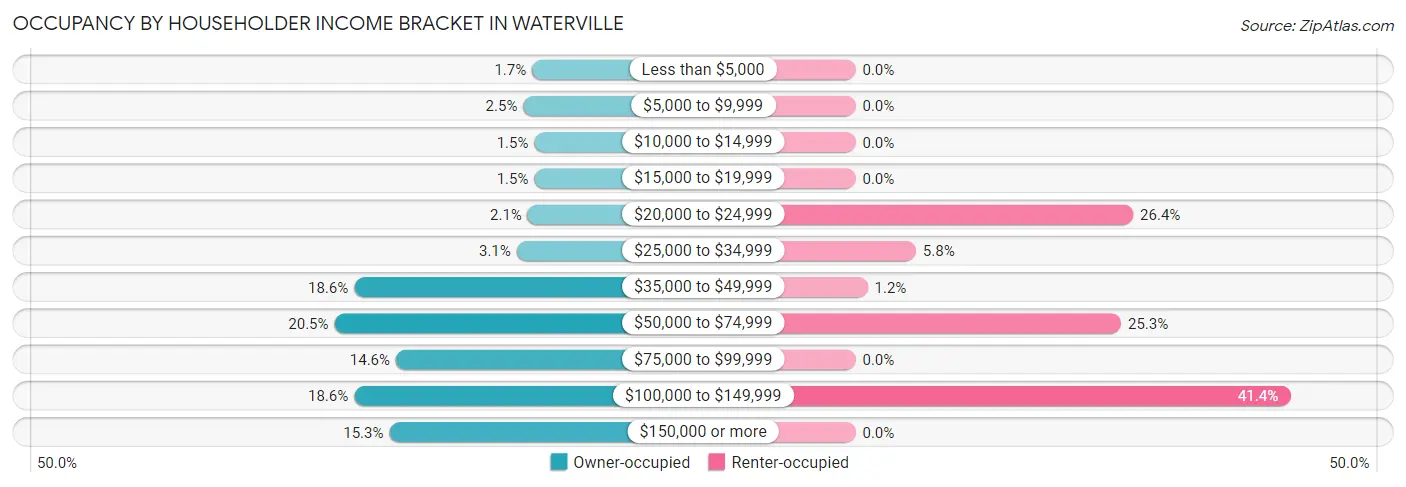
| Income Bracket | Owner-occupied | Renter-occupied |
| Less than $5,000 | 8 (1.7%) | 0 (0.0%) |
| $5,000 to $9,999 | 12 (2.5%) | 0 (0.0%) |
| $10,000 to $14,999 | 7 (1.5%) | 0 (0.0%) |
| $15,000 to $19,999 | 7 (1.5%) | 0 (0.0%) |
| $20,000 to $24,999 | 10 (2.1%) | 23 (26.4%) |
| $25,000 to $34,999 | 15 (3.1%) | 5 (5.8%) |
| $35,000 to $49,999 | 89 (18.6%) | 1 (1.1%) |
| $50,000 to $74,999 | 98 (20.5%) | 22 (25.3%) |
| $75,000 to $99,999 | 70 (14.6%) | 0 (0.0%) |
| $100,000 to $149,999 | 89 (18.6%) | 36 (41.4%) |
| $150,000 or more | 73 (15.3%) | 0 (0.0%) |
| Total | 478 (100.0%) | 87 (100.0%) |
Monthly Housing Cost Tiers in Waterville
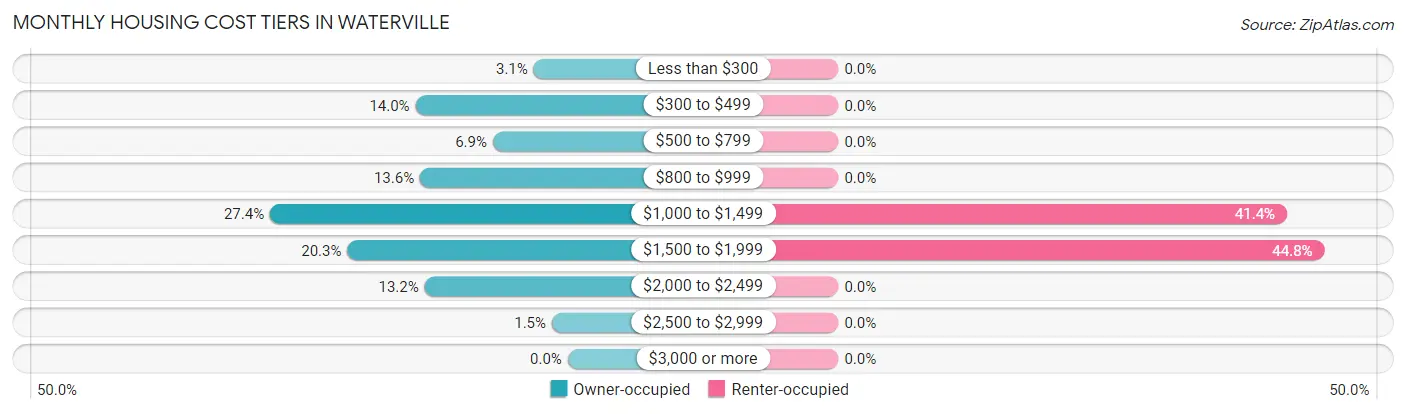
| Monthly Cost | Owner-occupied | Renter-occupied |
| Less than $300 | 15 (3.1%) | 0 (0.0%) |
| $300 to $499 | 67 (14.0%) | 0 (0.0%) |
| $500 to $799 | 33 (6.9%) | 0 (0.0%) |
| $800 to $999 | 65 (13.6%) | 0 (0.0%) |
| $1,000 to $1,499 | 131 (27.4%) | 36 (41.4%) |
| $1,500 to $1,999 | 97 (20.3%) | 39 (44.8%) |
| $2,000 to $2,499 | 63 (13.2%) | 0 (0.0%) |
| $2,500 to $2,999 | 7 (1.5%) | 0 (0.0%) |
| $3,000 or more | 0 (0.0%) | 0 (0.0%) |
| Total | 478 (100.0%) | 87 (100.0%) |
Physical Housing Characteristics in Waterville
Housing Structures in Waterville
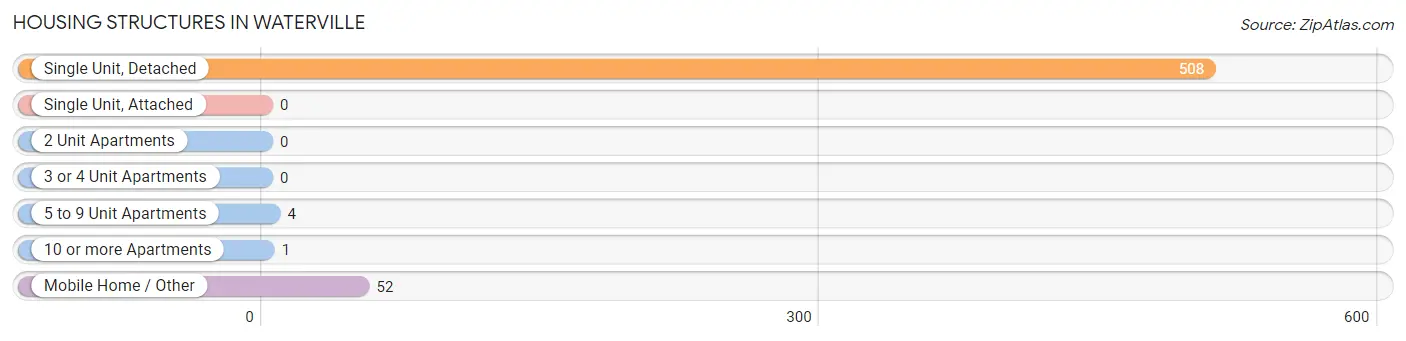
| Structure Type | # Housing Units | % Housing Units |
| Single Unit, Detached | 508 | 89.9% |
| Single Unit, Attached | 0 | 0.0% |
| 2 Unit Apartments | 0 | 0.0% |
| 3 or 4 Unit Apartments | 0 | 0.0% |
| 5 to 9 Unit Apartments | 4 | 0.7% |
| 10 or more Apartments | 1 | 0.2% |
| Mobile Home / Other | 52 | 9.2% |
| Total | 565 | 100.0% |
Housing Structures by Occupancy in Waterville
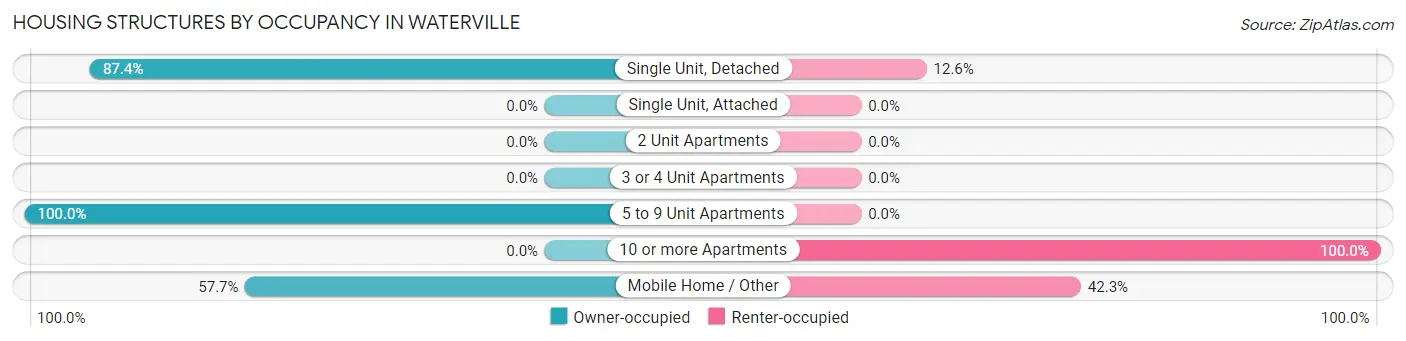
| Structure Type | Owner-occupied | Renter-occupied |
| Single Unit, Detached | 444 (87.4%) | 64 (12.6%) |
| Single Unit, Attached | 0 (0.0%) | 0 (0.0%) |
| 2 Unit Apartments | 0 (0.0%) | 0 (0.0%) |
| 3 or 4 Unit Apartments | 0 (0.0%) | 0 (0.0%) |
| 5 to 9 Unit Apartments | 4 (100.0%) | 0 (0.0%) |
| 10 or more Apartments | 0 (0.0%) | 1 (100.0%) |
| Mobile Home / Other | 30 (57.7%) | 22 (42.3%) |
| Total | 478 (84.6%) | 87 (15.4%) |
Housing Structures by Number of Rooms in Waterville
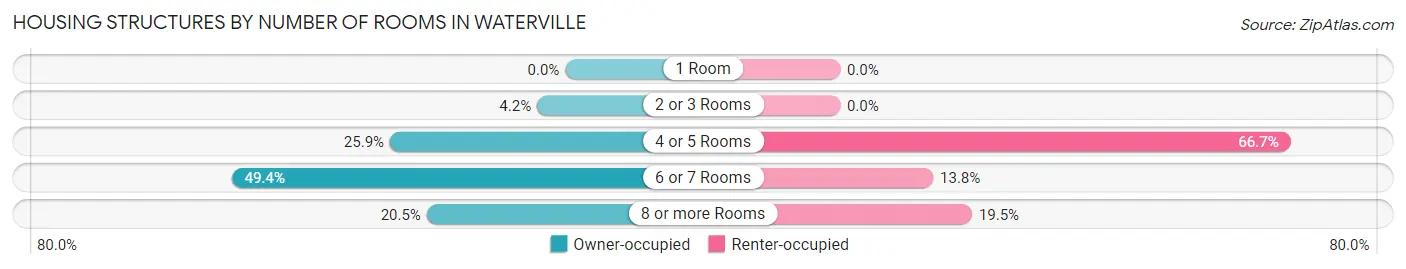
| Number of Rooms | Owner-occupied | Renter-occupied |
| 1 Room | 0 (0.0%) | 0 (0.0%) |
| 2 or 3 Rooms | 20 (4.2%) | 0 (0.0%) |
| 4 or 5 Rooms | 124 (25.9%) | 58 (66.7%) |
| 6 or 7 Rooms | 236 (49.4%) | 12 (13.8%) |
| 8 or more Rooms | 98 (20.5%) | 17 (19.5%) |
| Total | 478 (100.0%) | 87 (100.0%) |
Housing Structure by Heating Type in Waterville
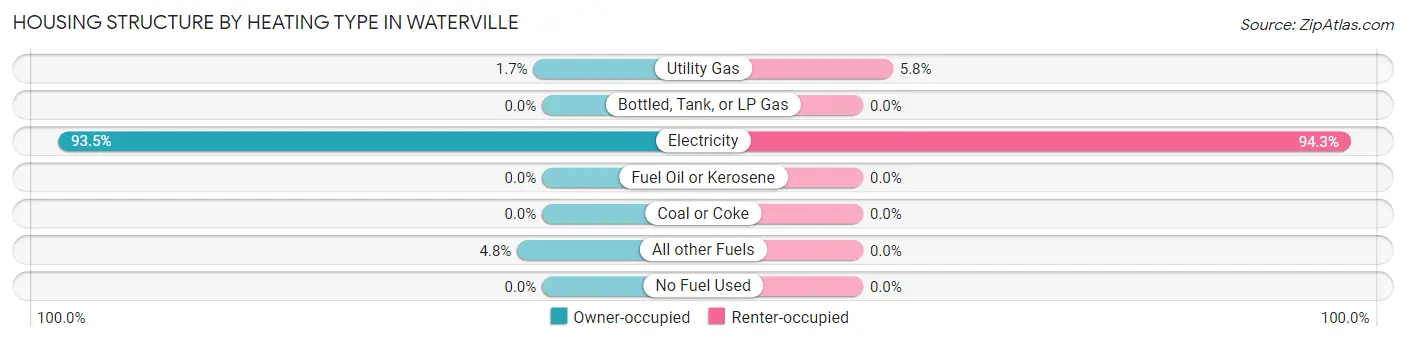
| Heating Type | Owner-occupied | Renter-occupied |
| Utility Gas | 8 (1.7%) | 5 (5.8%) |
| Bottled, Tank, or LP Gas | 0 (0.0%) | 0 (0.0%) |
| Electricity | 447 (93.5%) | 82 (94.3%) |
| Fuel Oil or Kerosene | 0 (0.0%) | 0 (0.0%) |
| Coal or Coke | 0 (0.0%) | 0 (0.0%) |
| All other Fuels | 23 (4.8%) | 0 (0.0%) |
| No Fuel Used | 0 (0.0%) | 0 (0.0%) |
| Total | 478 (100.0%) | 87 (100.0%) |
Household Vehicle Usage in Waterville
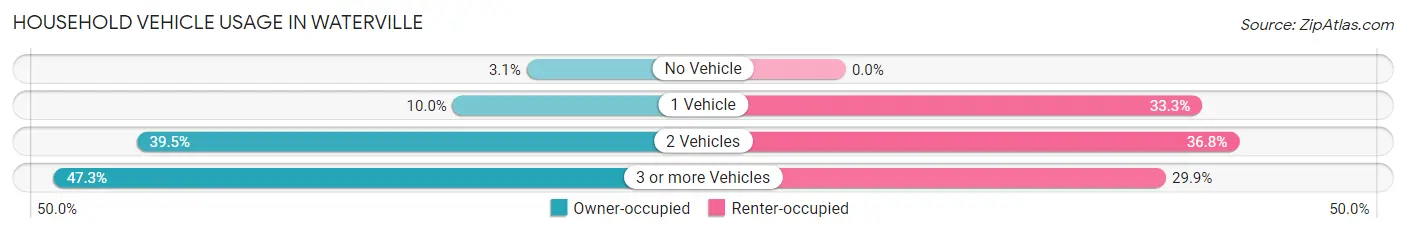
| Vehicles per Household | Owner-occupied | Renter-occupied |
| No Vehicle | 15 (3.1%) | 0 (0.0%) |
| 1 Vehicle | 48 (10.0%) | 29 (33.3%) |
| 2 Vehicles | 189 (39.5%) | 32 (36.8%) |
| 3 or more Vehicles | 226 (47.3%) | 26 (29.9%) |
| Total | 478 (100.0%) | 87 (100.0%) |
Real Estate & Mortgages in Waterville
Real Estate and Mortgage Overview in Waterville
| Characteristic | Without Mortgage | With Mortgage |
| Housing Units | 122 | 356 |
| Median Property Value | $212,100 | $236,600 |
| Median Household Income | - | - |
| Monthly Housing Costs | $458 | $0 |
| Real Estate Taxes | $1,806 | $31 |
Property Value by Mortgage Status in Waterville
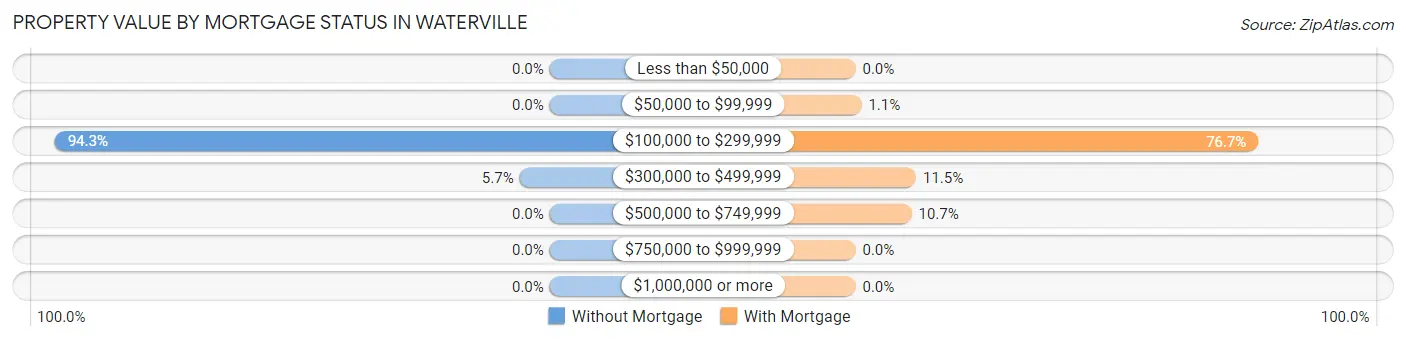
| Property Value | Without Mortgage | With Mortgage |
| Less than $50,000 | 0 (0.0%) | 0 (0.0%) |
| $50,000 to $99,999 | 0 (0.0%) | 4 (1.1%) |
| $100,000 to $299,999 | 115 (94.3%) | 273 (76.7%) |
| $300,000 to $499,999 | 7 (5.7%) | 41 (11.5%) |
| $500,000 to $749,999 | 0 (0.0%) | 38 (10.7%) |
| $750,000 to $999,999 | 0 (0.0%) | 0 (0.0%) |
| $1,000,000 or more | 0 (0.0%) | 0 (0.0%) |
| Total | 122 (100.0%) | 356 (100.0%) |
Household Income by Mortgage Status in Waterville
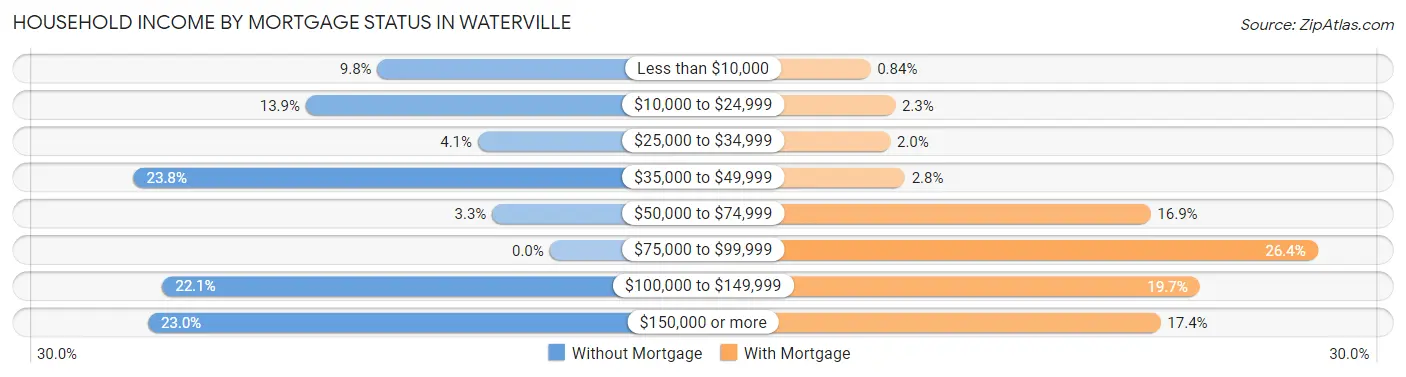
| Household Income | Without Mortgage | With Mortgage |
| Less than $10,000 | 12 (9.8%) | 3 (0.8%) |
| $10,000 to $24,999 | 17 (13.9%) | 8 (2.2%) |
| $25,000 to $34,999 | 5 (4.1%) | 7 (2.0%) |
| $35,000 to $49,999 | 29 (23.8%) | 10 (2.8%) |
| $50,000 to $74,999 | 4 (3.3%) | 60 (16.9%) |
| $75,000 to $99,999 | 0 (0.0%) | 94 (26.4%) |
| $100,000 to $149,999 | 27 (22.1%) | 70 (19.7%) |
| $150,000 or more | 28 (23.0%) | 62 (17.4%) |
| Total | 122 (100.0%) | 356 (100.0%) |
Property Value to Household Income Ratio in Waterville
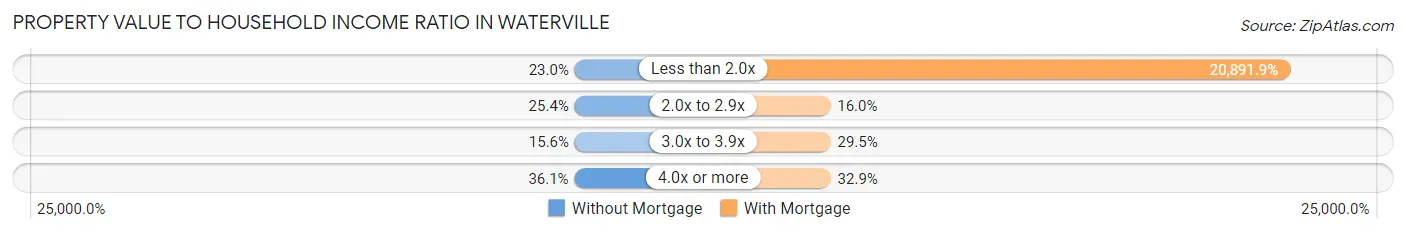
| Value-to-Income Ratio | Without Mortgage | With Mortgage |
| Less than 2.0x | 28 (23.0%) | 74,375 (20,891.8%) |
| 2.0x to 2.9x | 31 (25.4%) | 57 (16.0%) |
| 3.0x to 3.9x | 19 (15.6%) | 105 (29.5%) |
| 4.0x or more | 44 (36.1%) | 117 (32.9%) |
| Total | 122 (100.0%) | 356 (100.0%) |
Real Estate Taxes by Mortgage Status in Waterville
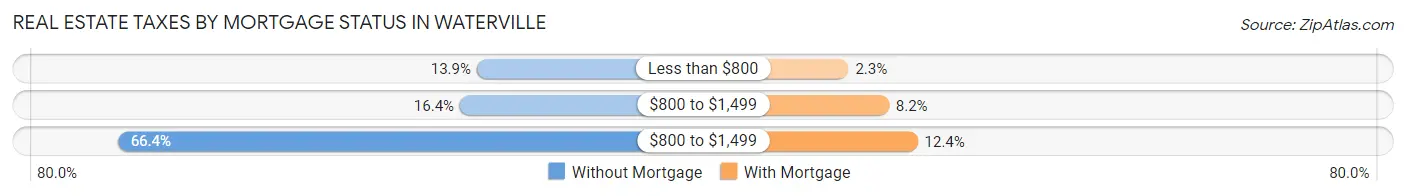
| Property Taxes | Without Mortgage | With Mortgage |
| Less than $800 | 17 (13.9%) | 8 (2.2%) |
| $800 to $1,499 | 20 (16.4%) | 29 (8.2%) |
| $800 to $1,499 | 81 (66.4%) | 44 (12.4%) |
| Total | 122 (100.0%) | 356 (100.0%) |
Health & Disability in Waterville
Health Insurance Coverage by Age in Waterville
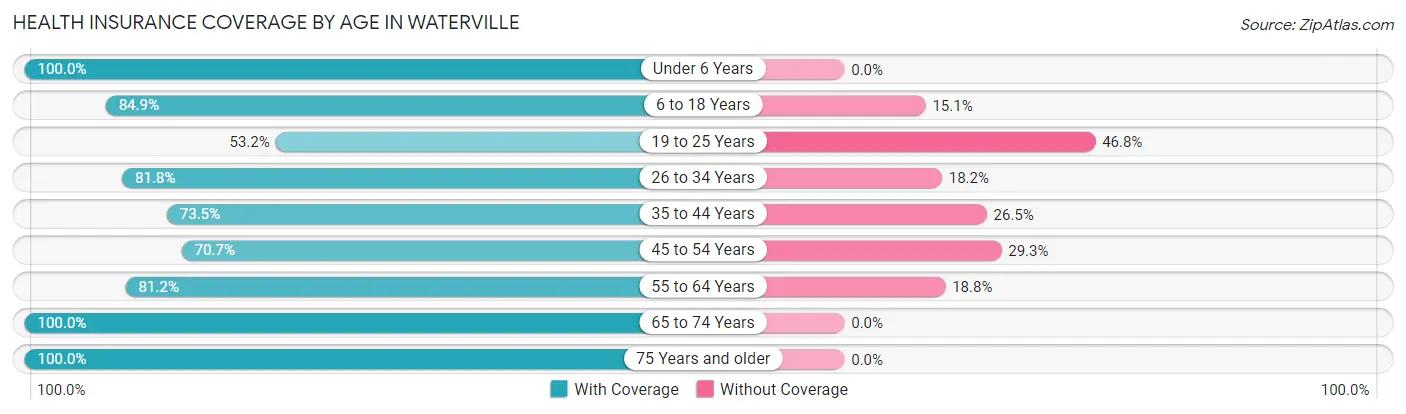
| Age Bracket | With Coverage | Without Coverage |
| Under 6 Years | 81 (100.0%) | 0 (0.0%) |
| 6 to 18 Years | 157 (84.9%) | 28 (15.1%) |
| 19 to 25 Years | 58 (53.2%) | 51 (46.8%) |
| 26 to 34 Years | 135 (81.8%) | 30 (18.2%) |
| 35 to 44 Years | 119 (73.5%) | 43 (26.5%) |
| 45 to 54 Years | 174 (70.7%) | 72 (29.3%) |
| 55 to 64 Years | 220 (81.2%) | 51 (18.8%) |
| 65 to 74 Years | 218 (100.0%) | 0 (0.0%) |
| 75 Years and older | 51 (100.0%) | 0 (0.0%) |
| Total | 1,213 (81.5%) | 275 (18.5%) |
Health Insurance Coverage by Citizenship Status in Waterville
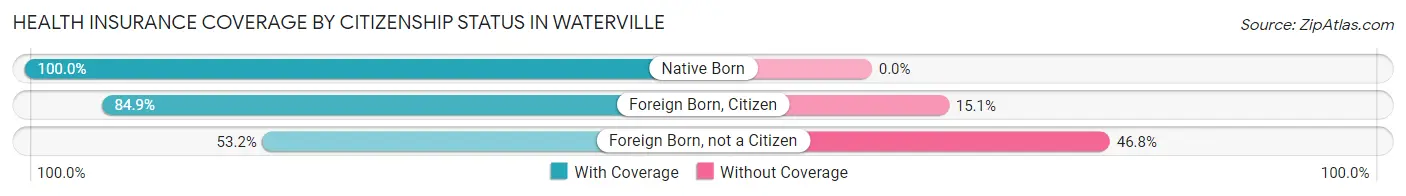
| Citizenship Status | With Coverage | Without Coverage |
| Native Born | 81 (100.0%) | 0 (0.0%) |
| Foreign Born, Citizen | 157 (84.9%) | 28 (15.1%) |
| Foreign Born, not a Citizen | 58 (53.2%) | 51 (46.8%) |
Health Insurance Coverage by Household Income in Waterville
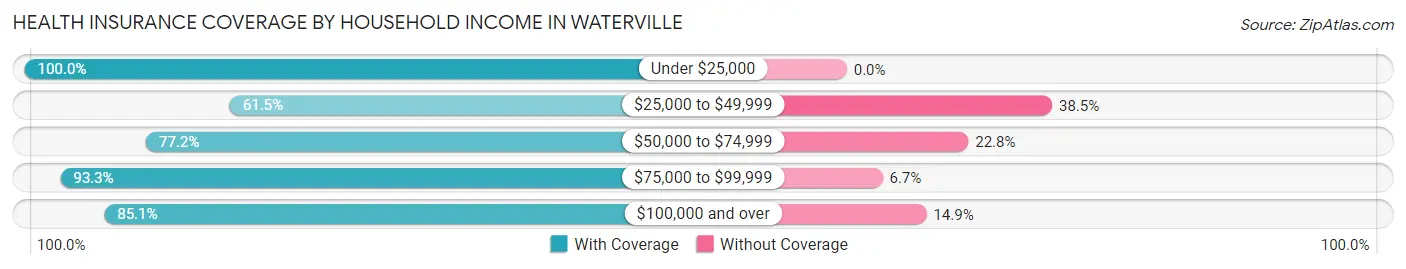
| Household Income | With Coverage | Without Coverage |
| Under $25,000 | 96 (100.0%) | 0 (0.0%) |
| $25,000 to $49,999 | 168 (61.5%) | 105 (38.5%) |
| $50,000 to $74,999 | 207 (77.2%) | 61 (22.8%) |
| $75,000 to $99,999 | 181 (93.3%) | 13 (6.7%) |
| $100,000 and over | 547 (85.1%) | 96 (14.9%) |
Public vs Private Health Insurance Coverage by Age in Waterville
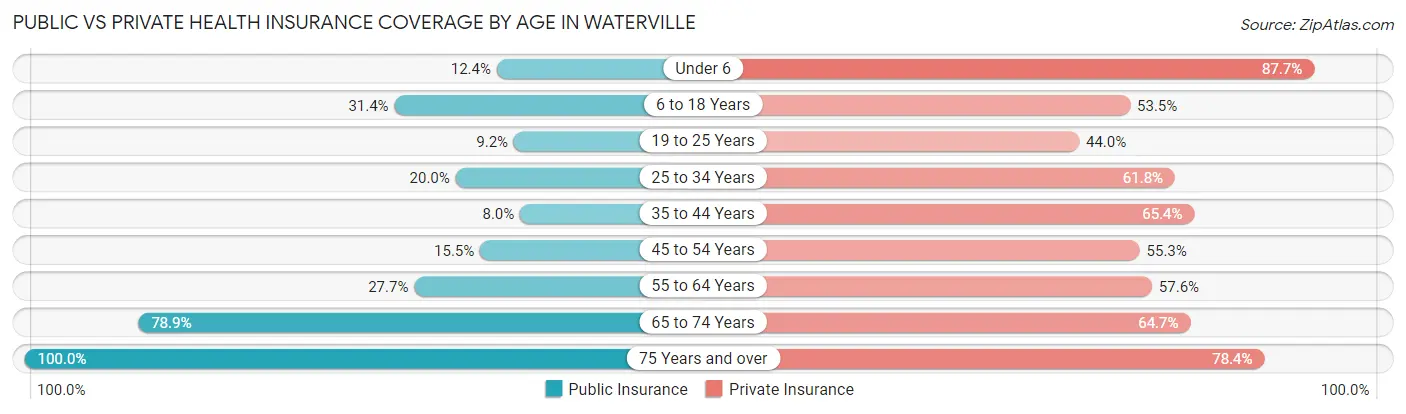
| Age Bracket | Public Insurance | Private Insurance |
| Under 6 | 10 (12.3%) | 71 (87.6%) |
| 6 to 18 Years | 58 (31.4%) | 99 (53.5%) |
| 19 to 25 Years | 10 (9.2%) | 48 (44.0%) |
| 25 to 34 Years | 33 (20.0%) | 102 (61.8%) |
| 35 to 44 Years | 13 (8.0%) | 106 (65.4%) |
| 45 to 54 Years | 38 (15.4%) | 136 (55.3%) |
| 55 to 64 Years | 75 (27.7%) | 156 (57.6%) |
| 65 to 74 Years | 172 (78.9%) | 141 (64.7%) |
| 75 Years and over | 51 (100.0%) | 40 (78.4%) |
| Total | 460 (30.9%) | 899 (60.4%) |
Disability Status by Sex by Age in Waterville
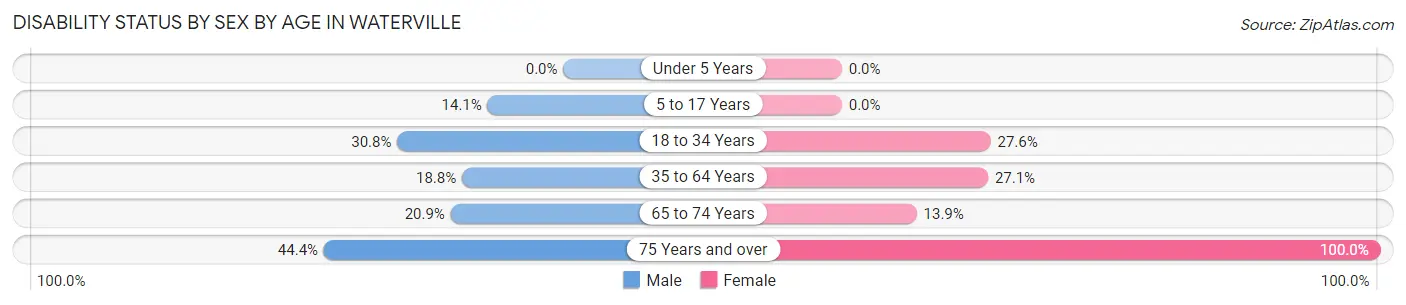
| Age Bracket | Male | Female |
| Under 5 Years | 0 (0.0%) | 0 (0.0%) |
| 5 to 17 Years | 18 (14.1%) | 0 (0.0%) |
| 18 to 34 Years | 49 (30.8%) | 37 (27.6%) |
| 35 to 64 Years | 66 (18.8%) | 89 (27.1%) |
| 65 to 74 Years | 23 (20.9%) | 15 (13.9%) |
| 75 Years and over | 16 (44.4%) | 15 (100.0%) |
Disability Class by Sex by Age in Waterville
Disability Class: Hearing Difficulty
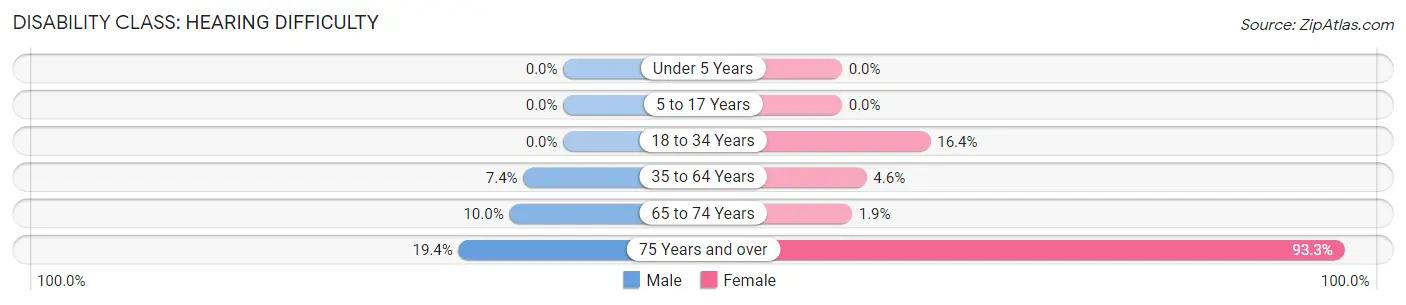
| Age Bracket | Male | Female |
| Under 5 Years | 0 (0.0%) | 0 (0.0%) |
| 5 to 17 Years | 0 (0.0%) | 0 (0.0%) |
| 18 to 34 Years | 0 (0.0%) | 22 (16.4%) |
| 35 to 64 Years | 26 (7.4%) | 15 (4.6%) |
| 65 to 74 Years | 11 (10.0%) | 2 (1.8%) |
| 75 Years and over | 7 (19.4%) | 14 (93.3%) |
Disability Class: Vision Difficulty
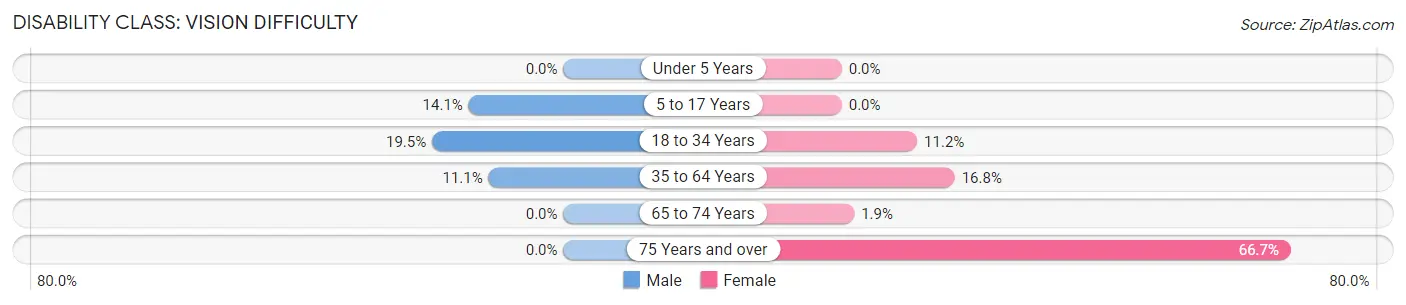
| Age Bracket | Male | Female |
| Under 5 Years | 0 (0.0%) | 0 (0.0%) |
| 5 to 17 Years | 18 (14.1%) | 0 (0.0%) |
| 18 to 34 Years | 31 (19.5%) | 15 (11.2%) |
| 35 to 64 Years | 39 (11.1%) | 55 (16.8%) |
| 65 to 74 Years | 0 (0.0%) | 2 (1.8%) |
| 75 Years and over | 0 (0.0%) | 10 (66.7%) |
Disability Class: Cognitive Difficulty
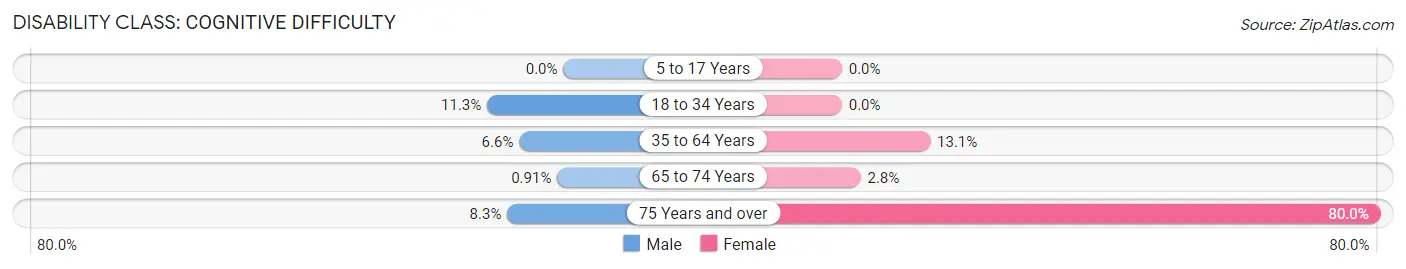
| Age Bracket | Male | Female |
| 5 to 17 Years | 0 (0.0%) | 0 (0.0%) |
| 18 to 34 Years | 18 (11.3%) | 0 (0.0%) |
| 35 to 64 Years | 23 (6.6%) | 43 (13.1%) |
| 65 to 74 Years | 1 (0.9%) | 3 (2.8%) |
| 75 Years and over | 3 (8.3%) | 12 (80.0%) |
Disability Class: Ambulatory Difficulty
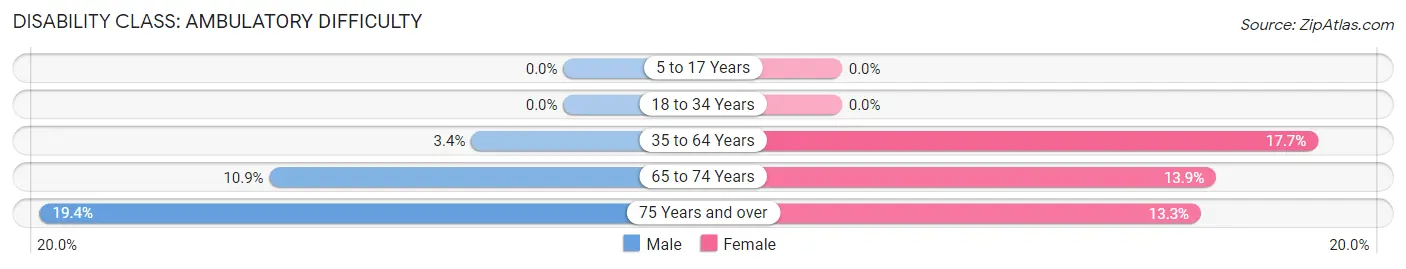
| Age Bracket | Male | Female |
| 5 to 17 Years | 0 (0.0%) | 0 (0.0%) |
| 18 to 34 Years | 0 (0.0%) | 0 (0.0%) |
| 35 to 64 Years | 12 (3.4%) | 58 (17.7%) |
| 65 to 74 Years | 12 (10.9%) | 15 (13.9%) |
| 75 Years and over | 7 (19.4%) | 2 (13.3%) |
Disability Class: Self-Care Difficulty
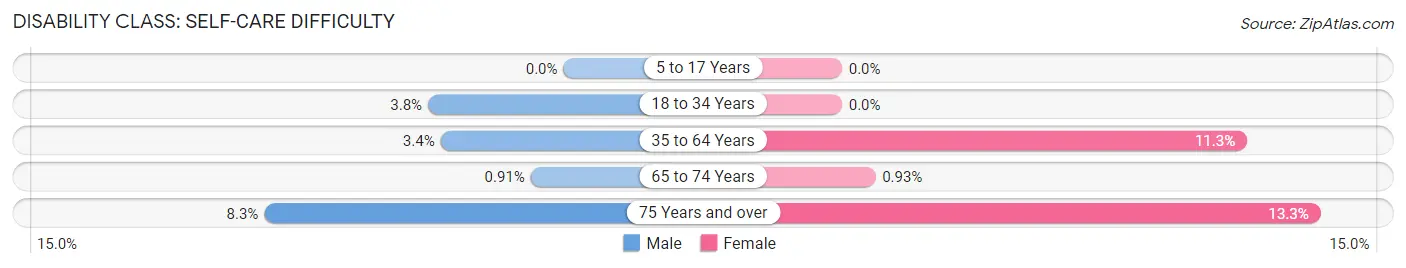
| Age Bracket | Male | Female |
| 5 to 17 Years | 0 (0.0%) | 0 (0.0%) |
| 18 to 34 Years | 6 (3.8%) | 0 (0.0%) |
| 35 to 64 Years | 12 (3.4%) | 37 (11.3%) |
| 65 to 74 Years | 1 (0.9%) | 1 (0.9%) |
| 75 Years and over | 3 (8.3%) | 2 (13.3%) |
Technology Access in Waterville
Computing Device Access in Waterville
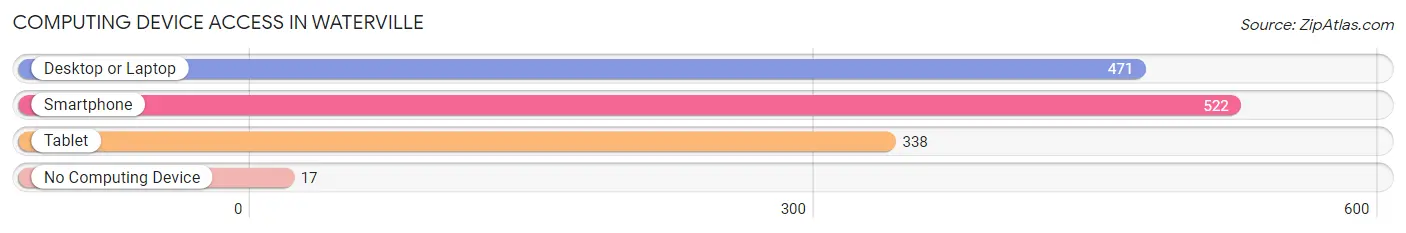
| Device Type | # Households | % Households |
| Desktop or Laptop | 471 | 83.4% |
| Smartphone | 522 | 92.4% |
| Tablet | 338 | 59.8% |
| No Computing Device | 17 | 3.0% |
| Total | 565 | 100.0% |
Internet Access in Waterville
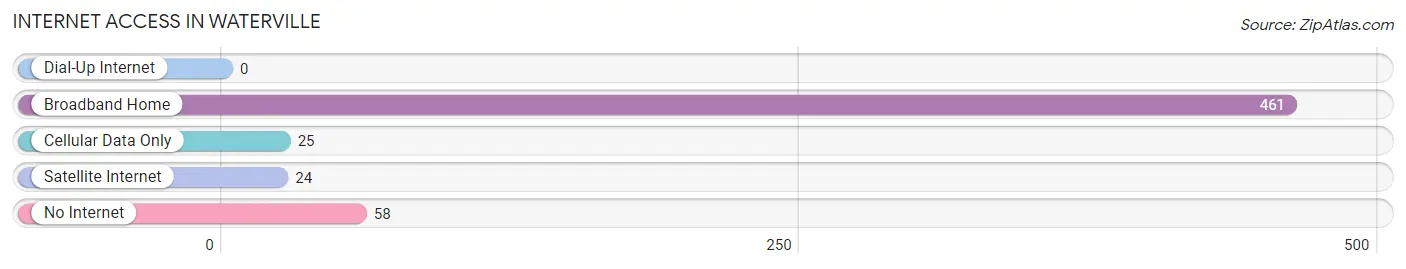
| Internet Type | # Households | % Households |
| Dial-Up Internet | 0 | 0.0% |
| Broadband Home | 461 | 81.6% |
| Cellular Data Only | 25 | 4.4% |
| Satellite Internet | 24 | 4.3% |
| No Internet | 58 | 10.3% |
| Total | 565 | 100.0% |
Waterville Summary
Waterville is a small town located in Douglas County, Washington, United States. It is situated on the banks of the Columbia River, approximately 20 miles east of the city of Wenatchee. The population of Waterville was 1,072 at the 2010 census.
History
The area around Waterville was first inhabited by the Wenatchi people, who lived in the area for thousands of years before the arrival of European settlers. The first white settlers arrived in the area in the late 1800s, and the town of Waterville was officially founded in 1891. The town was named after the nearby Waterville Valley, which was named after the nearby Waterville Indian Reservation.
The town of Waterville was originally a farming and ranching community, and the local economy was largely based on the production of wheat, apples, and other agricultural products. In the early 1900s, the town began to grow as a result of the construction of the Great Northern Railway, which connected Waterville to the larger cities of Wenatchee and Spokane.
Geography
Waterville is located in the Columbia River Valley, approximately 20 miles east of the city of Wenatchee. The town is situated on the banks of the Columbia River, and is surrounded by rolling hills and mountains. The nearby Waterville Valley is a popular destination for outdoor recreation, and is home to several hiking trails, camping sites, and fishing spots.
The climate in Waterville is generally mild, with hot summers and cold winters. The average annual temperature is around 50°F (10°C), and the average annual precipitation is around 16 inches (41 cm).
Economy
The economy of Waterville is largely based on agriculture and tourism. The town is home to several apple orchards, and the local economy is heavily dependent on the production of apples and other agricultural products. The nearby Waterville Valley is a popular destination for outdoor recreation, and the town is home to several restaurants, hotels, and other tourist attractions.
Demographics
As of the 2010 census, the population of Waterville was 1,072. The racial makeup of the town was 94.2% White, 0.7% African American, 0.7% Native American, 0.7% Asian, 0.1% Pacific Islander, 1.2% from other races, and 2.3% from two or more races. Hispanic or Latino of any race were 4.2% of the population.
The median household income in Waterville was $41,250, and the median family income was $48,750. The per capita income for the town was $20,945. About 11.2% of families and 14.2% of the population were below the poverty line, including 18.2% of those under age 18 and 8.3% of those age 65 or over.
Common Questions
What is Per Capita Income in Waterville?
Per Capita income in Waterville is $36,664.
What is the Median Family Income in Waterville?
Median Family Income in Waterville is $77,045.
What is the Median Household income in Waterville?
Median Household Income in Waterville is $71,964.
What is Income or Wage Gap in Waterville?
Income or Wage Gap in Waterville is 13.3%.
Women in Waterville earn 86.7 cents for every dollar earned by a man.
What is Inequality or Gini Index in Waterville?
Inequality or Gini Index in Waterville is 0.38.
What is the Total Population of Waterville?
Total Population of Waterville is 1,488.
What is the Total Male Population of Waterville?
Total Male Population of Waterville is 817.
What is the Total Female Population of Waterville?
Total Female Population of Waterville is 671.
What is the Ratio of Males per 100 Females in Waterville?
There are 121.76 Males per 100 Females in Waterville.
What is the Ratio of Females per 100 Males in Waterville?
There are 82.13 Females per 100 Males in Waterville.
What is the Median Population Age in Waterville?
Median Population Age in Waterville is 49.0 Years.
What is the Average Family Size in Waterville
Average Family Size in Waterville is 2.9 People.
What is the Average Household Size in Waterville
Average Household Size in Waterville is 2.6 People.
How Large is the Labor Force in Waterville?
There are 899 People in the Labor Forcein in Waterville.
What is the Percentage of People in the Labor Force in Waterville?
71.5% of People are in the Labor Force in Waterville.
What is the Unemployment Rate in Waterville?
Unemployment Rate in Waterville is 1.3%.