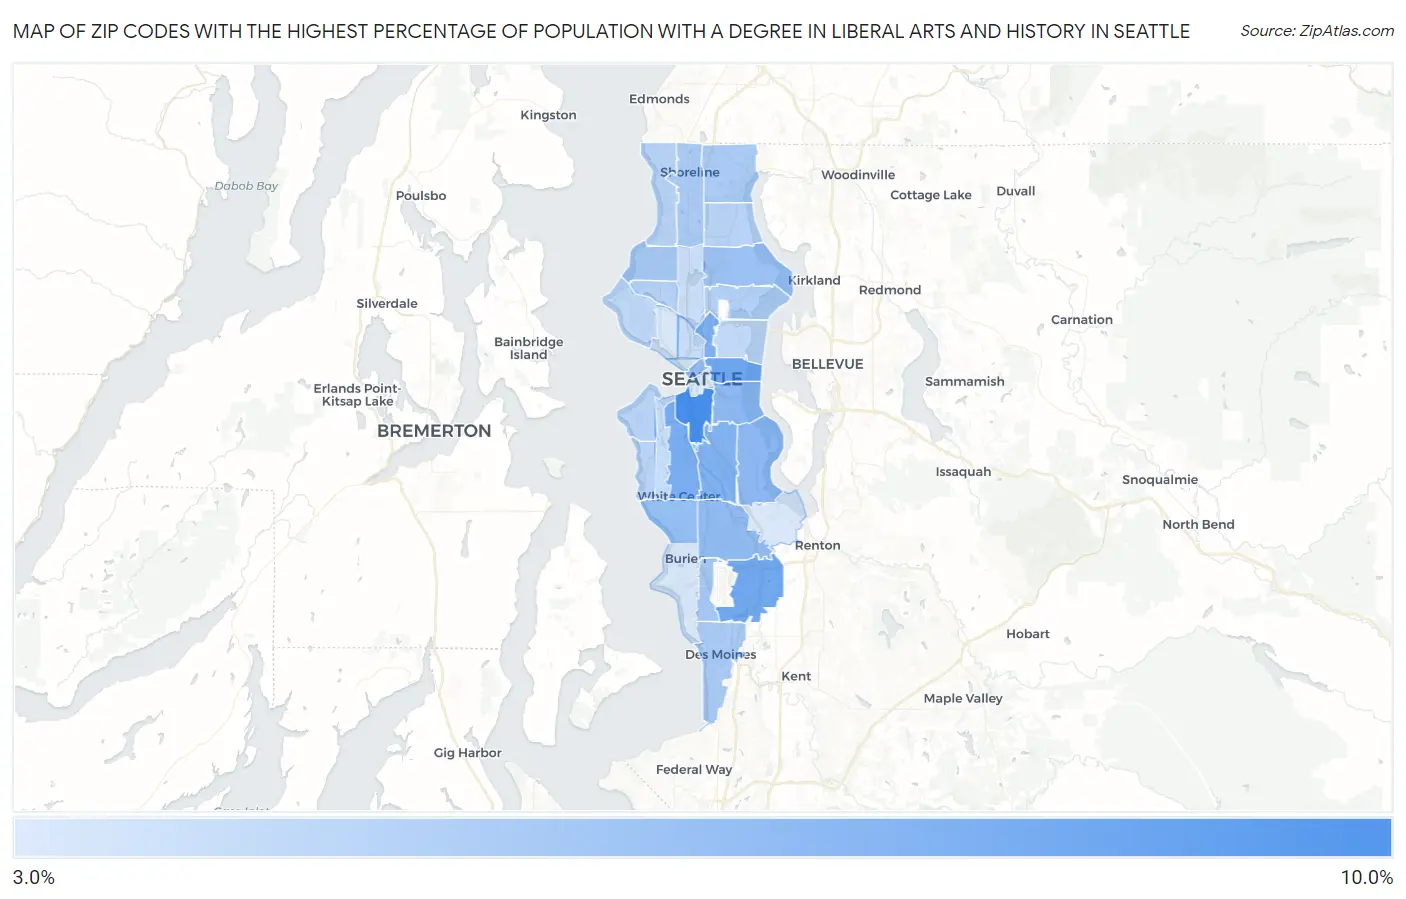
Zip Codes with the Highest Percentage of Population with a Degree in Liberal Arts and History in Seattle, WA
RELATED REPORTS & OPTIONS
Liberal Arts and History
Seattle
Compare Zip Codes
Map of Zip Codes with the Highest Percentage of Population with a Degree in Liberal Arts and History in Seattle
3.8%
8.9%
Zip Codes with the Highest Percentage of Population with a Degree in Liberal Arts and History in Seattle, WA
| Zip Code | % Graduates | vs State | vs National | |
| 1. | 98134 | 8.9% | 5.1%(+3.77)#76 | 4.9%(+4.05)#3,921 |
| 2. | 98122 | 7.5% | 5.1%(+2.39)#104 | 4.9%(+2.66)#5,536 |
| 3. | 98188 | 7.4% | 5.1%(+2.30)#108 | 4.9%(+2.57)#5,681 |
| 4. | 98106 | 7.2% | 5.1%(+2.04)#119 | 4.9%(+2.32)#6,067 |
| 5. | 98102 | 7.0% | 5.1%(+1.88)#132 | 4.9%(+2.16)#6,340 |
| 6. | 98108 | 6.9% | 5.1%(+1.77)#140 | 4.9%(+2.05)#6,524 |
| 7. | 98118 | 6.6% | 5.1%(+1.44)#154 | 4.9%(+1.71)#7,179 |
| 8. | 98144 | 6.6% | 5.1%(+1.40)#157 | 4.9%(+1.68)#7,244 |
| 9. | 98168 | 6.4% | 5.1%(+1.23)#169 | 4.9%(+1.51)#7,606 |
| 10. | 98146 | 6.2% | 5.1%(+1.09)#177 | 4.9%(+1.37)#7,937 |
| 11. | 98101 | 6.2% | 5.1%(+1.05)#180 | 4.9%(+1.33)#8,019 |
| 12. | 98115 | 6.1% | 5.1%(+0.939)#186 | 4.9%(+1.21)#8,301 |
| 13. | 98117 | 5.7% | 5.1%(+0.575)#207 | 4.9%(+0.851)#9,237 |
| 14. | 98148 | 5.7% | 5.1%(+0.562)#208 | 4.9%(+0.838)#9,282 |
| 15. | 98155 | 5.5% | 5.1%(+0.398)#218 | 4.9%(+0.673)#9,735 |
| 16. | 98198 | 5.5% | 5.1%(+0.394)#219 | 4.9%(+0.670)#9,750 |
| 17. | 98133 | 5.5% | 5.1%(+0.349)#221 | 4.9%(+0.625)#9,877 |
| 18. | 98164 | 5.4% | 5.1%(+0.229)#229 | 4.9%(+0.504)#10,191 |
| 19. | 98105 | 5.2% | 5.1%(+0.034)#243 | 4.9%(+0.310)#10,771 |
| 20. | 98107 | 5.2% | 5.1%(+0.005)#246 | 4.9%(+0.281)#10,863 |
| 21. | 98125 | 5.1% | 5.1%(-0.076)#254 | 4.9%(+0.200)#11,128 |
| 22. | 98116 | 5.1% | 5.1%(-0.077)#255 | 4.9%(+0.198)#11,131 |
| 23. | 98177 | 5.1% | 5.1%(-0.078)#256 | 4.9%(+0.197)#11,133 |
| 24. | 98136 | 5.0% | 5.1%(-0.117)#261 | 4.9%(+0.159)#11,259 |
| 25. | 98199 | 4.9% | 5.1%(-0.291)#268 | 4.9%(-0.015)#11,793 |
| 26. | 98112 | 4.7% | 5.1%(-0.412)#273 | 4.9%(-0.136)#12,209 |
| 27. | 98126 | 4.6% | 5.1%(-0.525)#284 | 4.9%(-0.249)#12,576 |
| 28. | 98109 | 4.6% | 5.1%(-0.592)#289 | 4.9%(-0.316)#12,776 |
| 29. | 98103 | 4.5% | 5.1%(-0.692)#294 | 4.9%(-0.416)#13,101 |
| 30. | 98121 | 4.1% | 5.1%(-1.08)#335 | 4.9%(-0.800)#14,501 |
| 31. | 98166 | 4.0% | 5.1%(-1.14)#340 | 4.9%(-0.860)#14,728 |
| 32. | 98119 | 4.0% | 5.1%(-1.16)#343 | 4.9%(-0.880)#14,818 |
| 33. | 98178 | 3.9% | 5.1%(-1.26)#349 | 4.9%(-0.986)#15,220 |
| 34. | 98104 | 3.8% | 5.1%(-1.31)#358 | 4.9%(-1.04)#15,391 |
1
Common Questions
What are the Top 10 Zip Codes with the Highest Percentage of Population with a Degree in Liberal Arts and History in Seattle, WA?
Top 10 Zip Codes with the Highest Percentage of Population with a Degree in Liberal Arts and History in Seattle, WA are:
What zip code has the Highest Percentage of Population with a Degree in Liberal Arts and History in Seattle, WA?
98134 has the Highest Percentage of Population with a Degree in Liberal Arts and History in Seattle, WA with 8.9%.
What is the Percentage of Population with a Degree in Liberal Arts and History in Seattle, WA?
Percentage of Population with a Degree in Liberal Arts and History in Seattle is 5.5%.
What is the Percentage of Population with a Degree in Liberal Arts and History in Washington?
Percentage of Population with a Degree in Liberal Arts and History in Washington is 5.1%.
What is the Percentage of Population with a Degree in Liberal Arts and History in the United States?
Percentage of Population with a Degree in Liberal Arts and History in the United States is 4.9%.