Zip Codes with the Highest Percentage of Population with a Degree in Liberal Arts and History in Tacoma, WA
RELATED REPORTS & OPTIONS
Liberal Arts and History
Tacoma
Compare Zip Codes
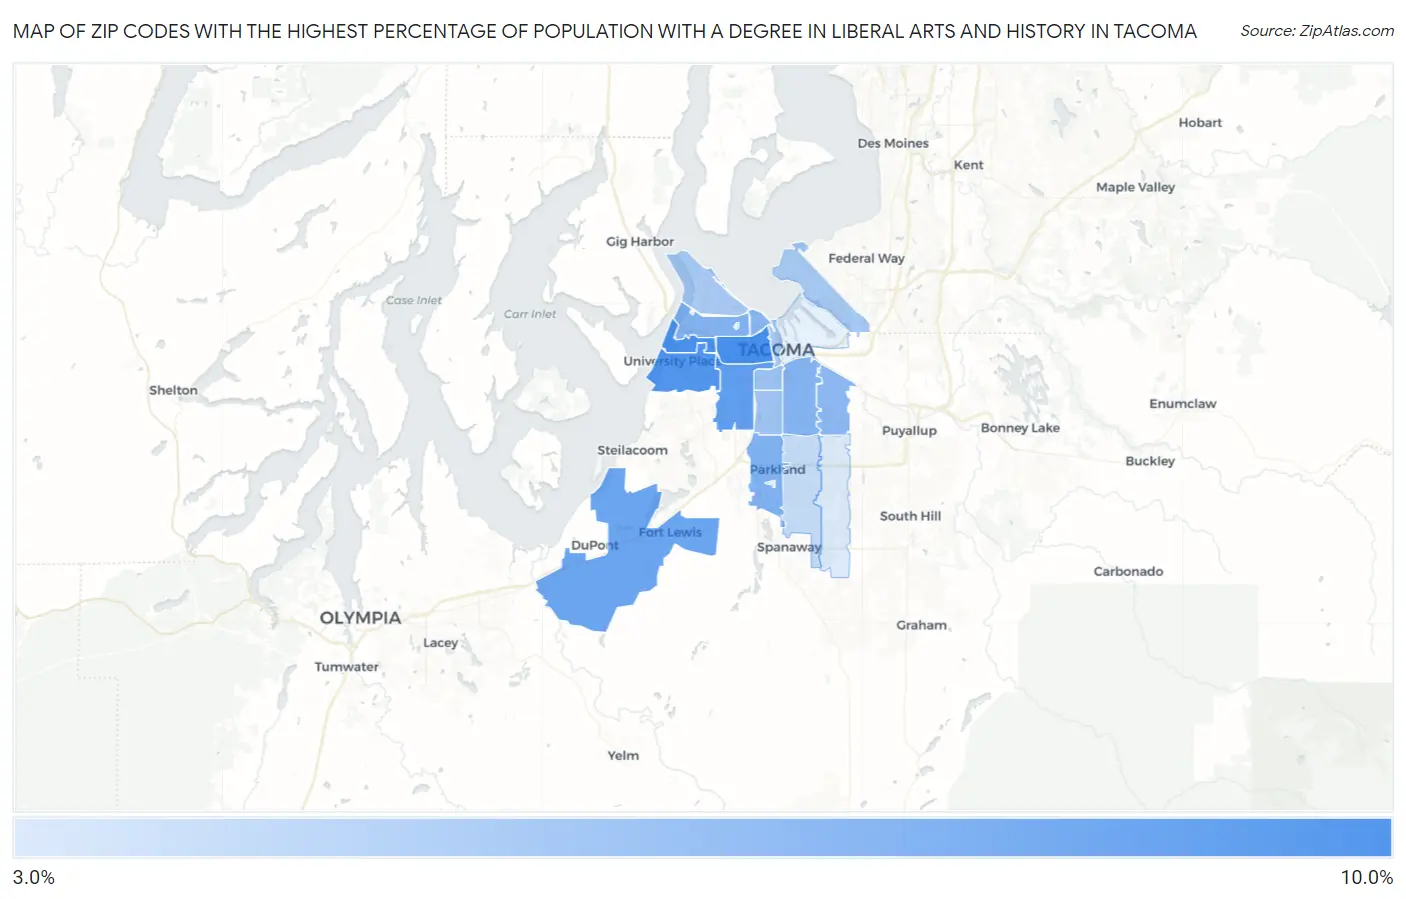
Map of Zip Codes with the Highest Percentage of Population with a Degree in Liberal Arts and History in Tacoma
3.4%
9.5%
Zip Codes with the Highest Percentage of Population with a Degree in Liberal Arts and History in Tacoma, WA
| Zip Code | % Graduates | vs State | vs National | |
| 1. | 98405 | 9.5% | 5.1%(+4.36)#70 | 4.9%(+4.63)#3,454 |
| 2. | 98465 | 9.3% | 5.1%(+4.16)#72 | 4.9%(+4.43)#3,598 |
| 3. | 98466 | 9.1% | 5.1%(+3.92)#75 | 4.9%(+4.20)#3,789 |
| 4. | 98409 | 8.4% | 5.1%(+3.30)#88 | 4.9%(+3.57)#4,391 |
| 5. | 98433 | 8.0% | 5.1%(+2.83)#92 | 4.9%(+3.11)#4,917 |
| 6. | 98444 | 7.1% | 5.1%(+1.94)#125 | 4.9%(+2.22)#6,253 |
| 7. | 98406 | 7.1% | 5.1%(+1.91)#127 | 4.9%(+2.18)#6,299 |
| 8. | 98404 | 7.0% | 5.1%(+1.83)#138 | 4.9%(+2.11)#6,426 |
| 9. | 98403 | 6.8% | 5.1%(+1.66)#147 | 4.9%(+1.93)#6,740 |
| 10. | 98443 | 6.7% | 5.1%(+1.50)#151 | 4.9%(+1.78)#7,046 |
| 11. | 98418 | 6.1% | 5.1%(+0.967)#183 | 4.9%(+1.24)#8,223 |
| 12. | 98408 | 5.8% | 5.1%(+0.629)#202 | 4.9%(+0.905)#9,103 |
| 13. | 98422 | 5.6% | 5.1%(+0.418)#217 | 4.9%(+0.693)#9,660 |
| 14. | 98402 | 5.5% | 5.1%(+0.377)#220 | 4.9%(+0.653)#9,799 |
| 15. | 98407 | 5.5% | 5.1%(+0.307)#223 | 4.9%(+0.583)#9,986 |
| 16. | 98445 | 4.3% | 5.1%(-0.831)#306 | 4.9%(-0.555)#13,580 |
| 17. | 98446 | 3.4% | 5.1%(-1.72)#381 | 4.9%(-1.44)#16,870 |
1
Common Questions
What are the Top 10 Zip Codes with the Highest Percentage of Population with a Degree in Liberal Arts and History in Tacoma, WA?
Top 10 Zip Codes with the Highest Percentage of Population with a Degree in Liberal Arts and History in Tacoma, WA are:
What zip code has the Highest Percentage of Population with a Degree in Liberal Arts and History in Tacoma, WA?
98405 has the Highest Percentage of Population with a Degree in Liberal Arts and History in Tacoma, WA with 9.5%.
What is the Percentage of Population with a Degree in Liberal Arts and History in Tacoma, WA?
Percentage of Population with a Degree in Liberal Arts and History in Tacoma is 7.1%.
What is the Percentage of Population with a Degree in Liberal Arts and History in Washington?
Percentage of Population with a Degree in Liberal Arts and History in Washington is 5.1%.
What is the Percentage of Population with a Degree in Liberal Arts and History in the United States?
Percentage of Population with a Degree in Liberal Arts and History in the United States is 4.9%.