Taholah, WA Map & Demographics
Taholah Map
Taholah Overview
$18,781
PER CAPITA INCOME
$49,750
AVG FAMILY INCOME
$42,750
AVG HOUSEHOLD INCOME
36.8%
WAGE / INCOME GAP [ % ]
63.2¢/ $1
WAGE / INCOME GAP [ $ ]
0.47
INEQUALITY / GINI INDEX
823
TOTAL POPULATION
411
MALE POPULATION
412
FEMALE POPULATION
99.76
MALES / 100 FEMALES
100.24
FEMALES / 100 MALES
36.8
MEDIAN AGE
3.5
AVG FAMILY SIZE
3.2
AVG HOUSEHOLD SIZE
351
LABOR FORCE [ PEOPLE ]
52.4%
PERCENT IN LABOR FORCE
9.4%
UNEMPLOYMENT RATE
Taholah Zip Codes
Taholah Area Codes
Income in Taholah
Income Overview in Taholah
Per Capita Income in Taholah is $18,781, while median incomes of families and households are $49,750 and $42,750 respectively.
| Characteristic | Number | Measure |
| Per Capita Income | 823 | $18,781 |
| Median Family Income | 210 | $49,750 |
| Mean Family Income | 210 | $69,030 |
| Median Household Income | 257 | $42,750 |
| Mean Household Income | 257 | $63,313 |
| Income Deficit | 210 | $0 |
| Wage / Income Gap (%) | 823 | 36.81% |
| Wage / Income Gap ($) | 823 | 63.19¢ per $1 |
| Gini / Inequality Index | 823 | 0.47 |
Earnings by Sex in Taholah
Average Earnings in Taholah are $27,422, $32,045 for men and $20,250 for women, a difference of 36.8%.
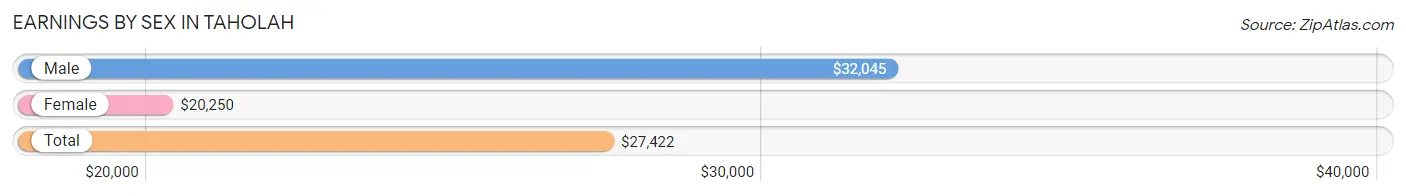
| Sex | Number | Average Earnings |
| Male | 210 (52.9%) | $32,045 |
| Female | 187 (47.1%) | $20,250 |
| Total | 397 (100.0%) | $27,422 |
Earnings by Sex by Income Bracket in Taholah
The most common earnings brackets in Taholah are $40,000 to $44,999 for men (50 | 23.8%) and $2,499 or less for women (43 | 23.0%).
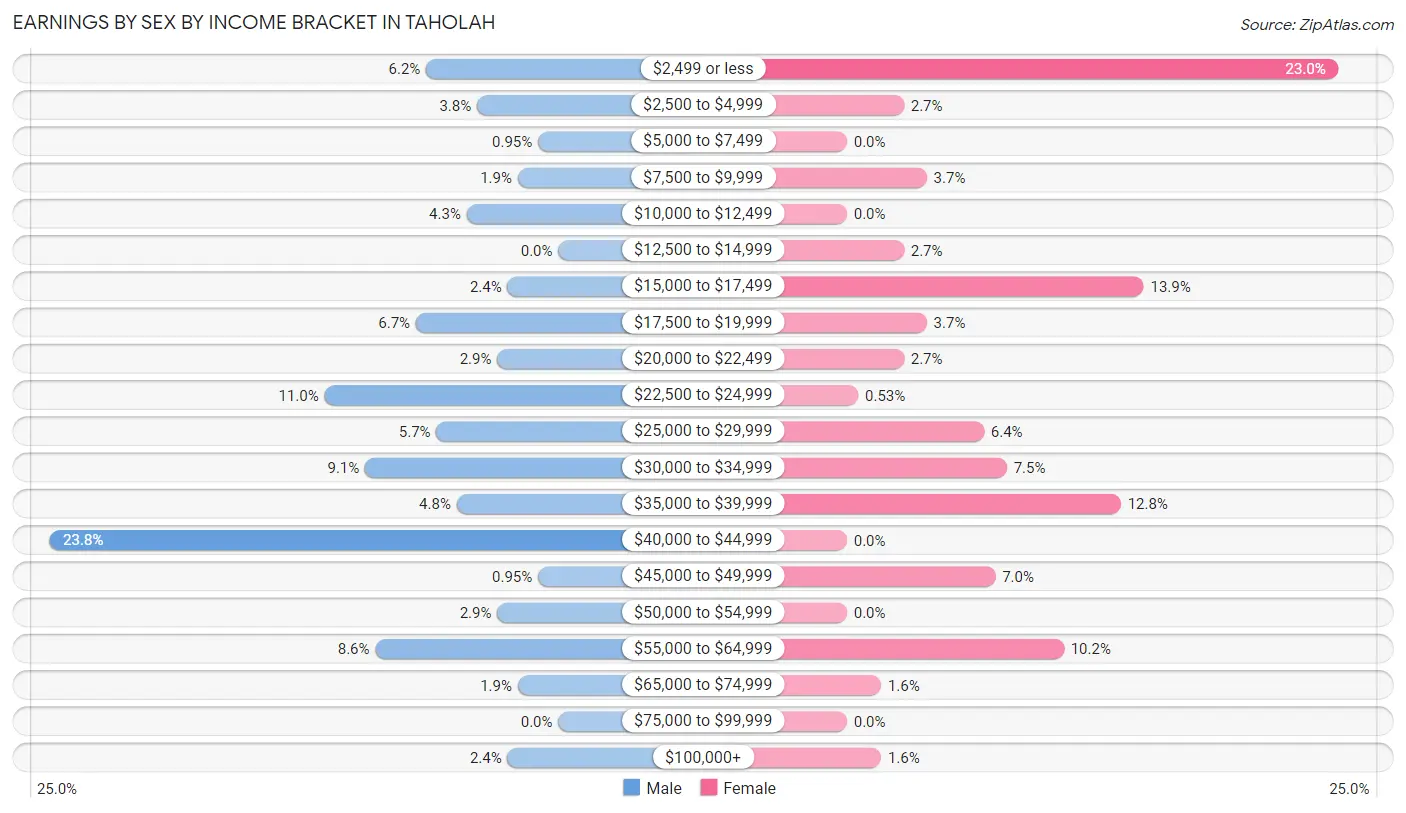
| Income | Male | Female |
| $2,499 or less | 13 (6.2%) | 43 (23.0%) |
| $2,500 to $4,999 | 8 (3.8%) | 5 (2.7%) |
| $5,000 to $7,499 | 2 (0.9%) | 0 (0.0%) |
| $7,500 to $9,999 | 4 (1.9%) | 7 (3.7%) |
| $10,000 to $12,499 | 9 (4.3%) | 0 (0.0%) |
| $12,500 to $14,999 | 0 (0.0%) | 5 (2.7%) |
| $15,000 to $17,499 | 5 (2.4%) | 26 (13.9%) |
| $17,500 to $19,999 | 14 (6.7%) | 7 (3.7%) |
| $20,000 to $22,499 | 6 (2.9%) | 5 (2.7%) |
| $22,500 to $24,999 | 23 (11.0%) | 1 (0.5%) |
| $25,000 to $29,999 | 12 (5.7%) | 12 (6.4%) |
| $30,000 to $34,999 | 19 (9.0%) | 14 (7.5%) |
| $35,000 to $39,999 | 10 (4.8%) | 24 (12.8%) |
| $40,000 to $44,999 | 50 (23.8%) | 0 (0.0%) |
| $45,000 to $49,999 | 2 (0.9%) | 13 (7.0%) |
| $50,000 to $54,999 | 6 (2.9%) | 0 (0.0%) |
| $55,000 to $64,999 | 18 (8.6%) | 19 (10.2%) |
| $65,000 to $74,999 | 4 (1.9%) | 3 (1.6%) |
| $75,000 to $99,999 | 0 (0.0%) | 0 (0.0%) |
| $100,000+ | 5 (2.4%) | 3 (1.6%) |
| Total | 210 (100.0%) | 187 (100.0%) |
Earnings by Sex by Educational Attainment in Taholah
Average earnings in Taholah are $42,600 for men and $34,688 for women, a difference of 18.6%. Men with an educational attainment of high school diploma enjoy the highest average annual earnings of $42,935, while those with less than high school education earn the least with $18,929. Women with an educational attainment of graduate degree earn the most with the average annual earnings of $56,250, while those with college or associate's degree education have the smallest earnings of $22,500.
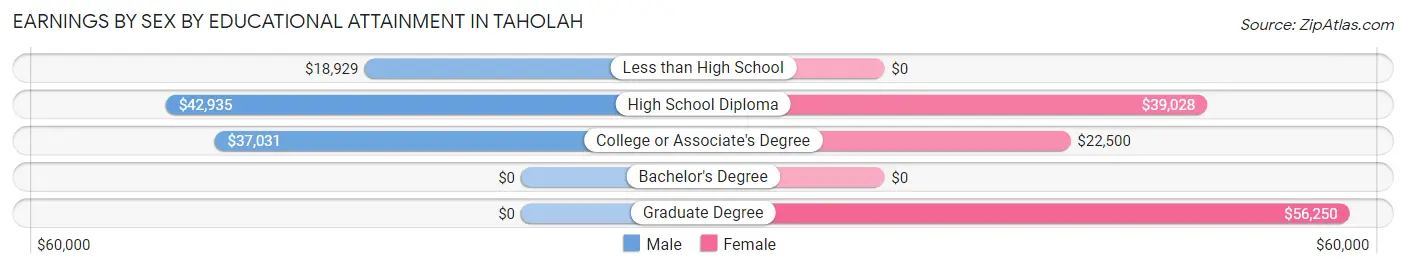
| Educational Attainment | Male Income | Female Income |
| Less than High School | $18,929 | $0 |
| High School Diploma | $42,935 | $39,028 |
| College or Associate's Degree | $37,031 | $22,500 |
| Bachelor's Degree | - | - |
| Graduate Degree | - | - |
| Total | $42,600 | $34,688 |
Family Income in Taholah
Family Income Brackets in Taholah
According to the Taholah family income data, there are 46 families falling into the $75,000 to $99,999 income range, which is the most common income bracket and makes up 21.9% of all families.
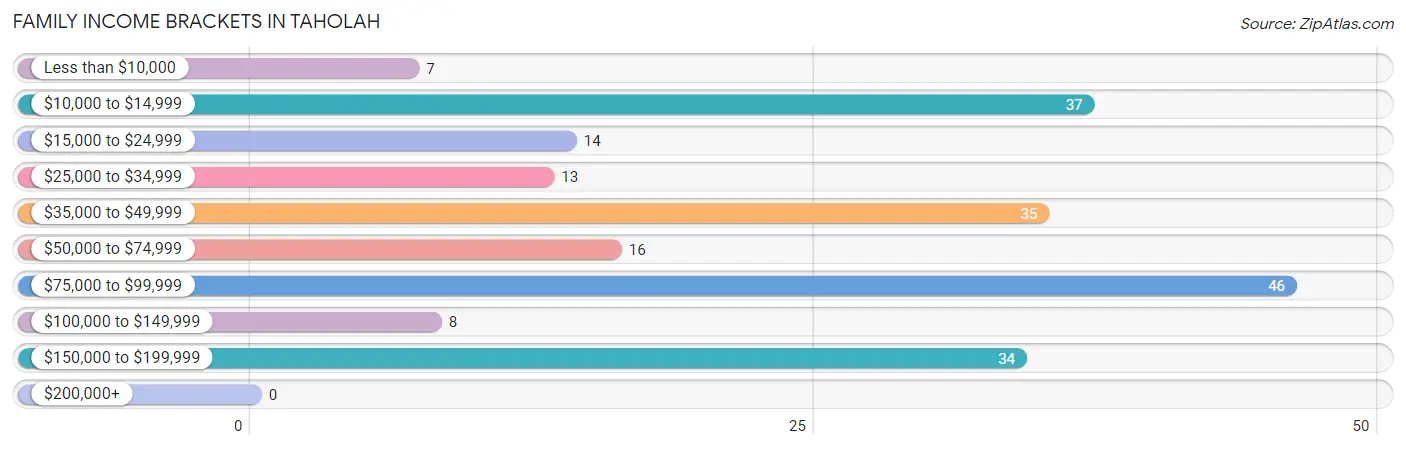
| Income Bracket | # Families | % Families |
| Less than $10,000 | 7 | 3.3% |
| $10,000 to $14,999 | 37 | 17.6% |
| $15,000 to $24,999 | 14 | 6.7% |
| $25,000 to $34,999 | 13 | 6.2% |
| $35,000 to $49,999 | 35 | 16.7% |
| $50,000 to $74,999 | 16 | 7.6% |
| $75,000 to $99,999 | 46 | 21.9% |
| $100,000 to $149,999 | 8 | 3.8% |
| $150,000 to $199,999 | 34 | 16.2% |
| $200,000+ | 0 | 0.0% |
Family Income by Famaliy Size in Taholah
5-person families (45 | 21.4%) account for the highest median family income in Taholah with $168,125 per family, while 5-person families (45 | 21.4%) have the highest median income of $33,625 per family member.
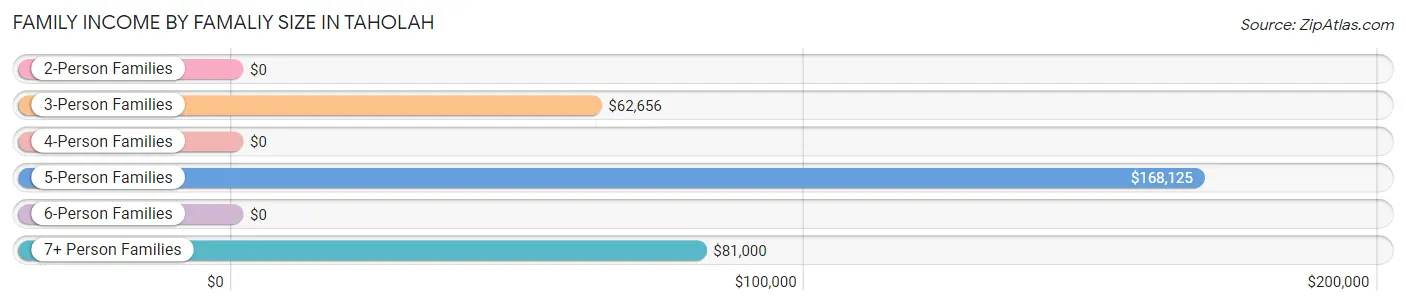
| Income Bracket | # Families | Median Income |
| 2-Person Families | 66 (31.4%) | $0 |
| 3-Person Families | 55 (26.2%) | $62,656 |
| 4-Person Families | 20 (9.5%) | $0 |
| 5-Person Families | 45 (21.4%) | $168,125 |
| 6-Person Families | 10 (4.8%) | $0 |
| 7+ Person Families | 14 (6.7%) | $81,000 |
| Total | 210 (100.0%) | $49,750 |
Family Income by Number of Earners in Taholah
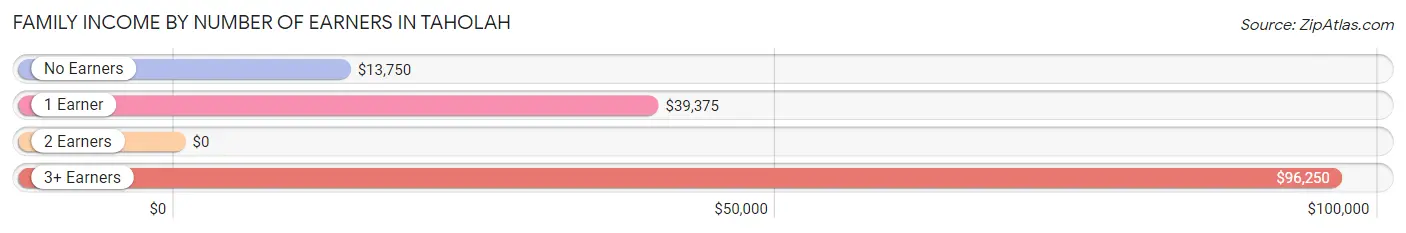
| Number of Earners | # Families | Median Income |
| No Earners | 47 (22.4%) | $13,750 |
| 1 Earner | 71 (33.8%) | $39,375 |
| 2 Earners | 57 (27.1%) | $0 |
| 3+ Earners | 35 (16.7%) | $96,250 |
| Total | 210 (100.0%) | $49,750 |
Household Income in Taholah
Household Income Brackets in Taholah
With 54 households falling in the category, the $10,000 to $14,999 income range is the most frequent in Taholah, accounting for 21.0% of all households.
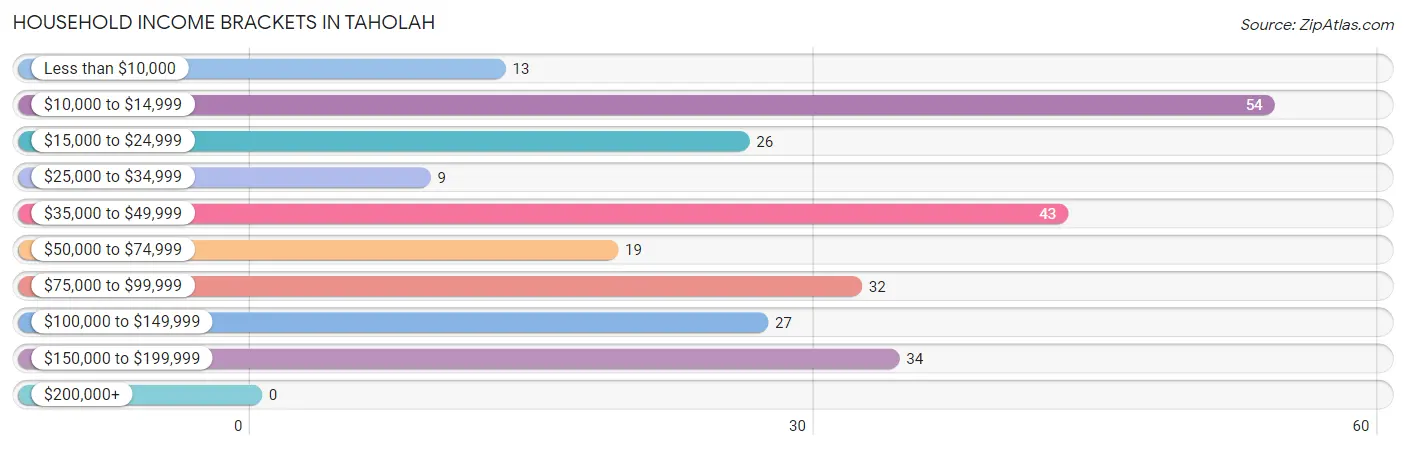
| Income Bracket | # Households | % Households |
| Less than $10,000 | 13 | 5.1% |
| $10,000 to $14,999 | 54 | 21.0% |
| $15,000 to $24,999 | 26 | 10.1% |
| $25,000 to $34,999 | 9 | 3.5% |
| $35,000 to $49,999 | 43 | 16.7% |
| $50,000 to $74,999 | 19 | 7.4% |
| $75,000 to $99,999 | 32 | 12.5% |
| $100,000 to $149,999 | 27 | 10.5% |
| $150,000 to $199,999 | 34 | 13.2% |
| $200,000+ | 0 | 0.0% |
Household Income by Householder Age in Taholah
The median household income in Taholah is $42,750, with the highest median household income of $64,531 found in the 45 to 64 years age bracket for the primary householder. A total of 87 households (33.9%) fall into this category. Meanwhile, the 15 to 24 years age bracket for the primary householder has the lowest median household income of $0, with 5 households (1.9%) in this group.
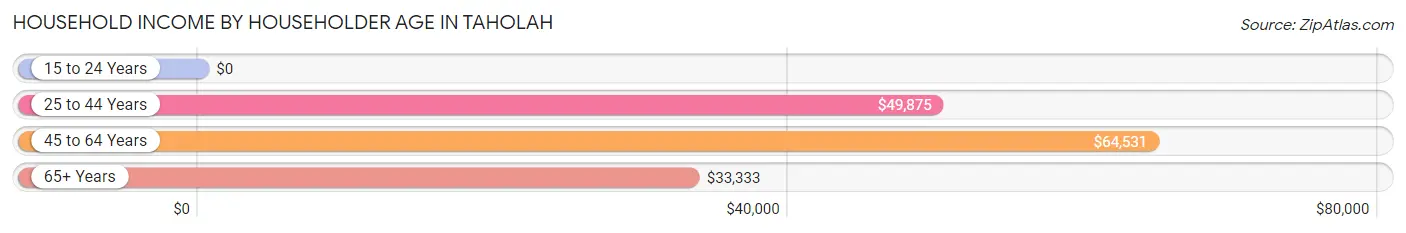
| Income Bracket | # Households | Median Income |
| 15 to 24 Years | 5 (1.9%) | $0 |
| 25 to 44 Years | 49 (19.1%) | $49,875 |
| 45 to 64 Years | 87 (33.9%) | $64,531 |
| 65+ Years | 116 (45.1%) | $33,333 |
| Total | 257 (100.0%) | $42,750 |
Poverty in Taholah
Income Below Poverty by Sex and Age in Taholah
With 28.1% poverty level for males and 36.6% for females among the residents of Taholah, under 5 year old males and 16 and 17 year old females are the most vulnerable to poverty, with 17 males (63.0%) and 11 females (78.6%) in their respective age groups living below the poverty level.
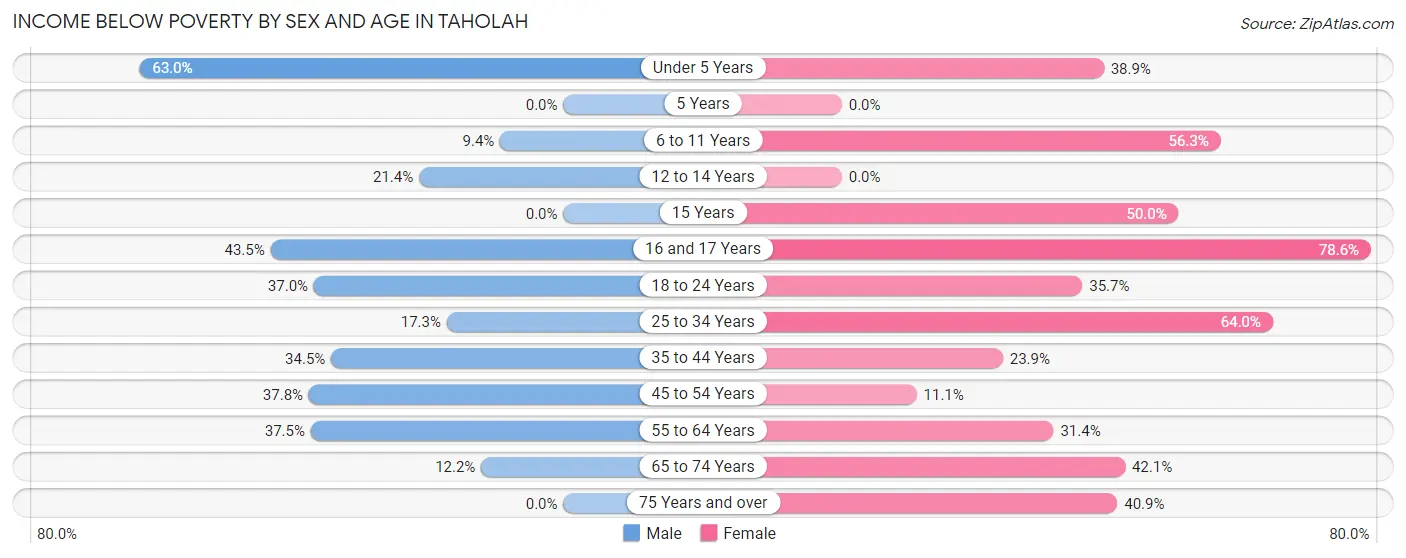
| Age Bracket | Male | Female |
| Under 5 Years | 17 (63.0%) | 7 (38.9%) |
| 5 Years | 0 (0.0%) | 0 (0.0%) |
| 6 to 11 Years | 3 (9.4%) | 18 (56.2%) |
| 12 to 14 Years | 3 (21.4%) | 0 (0.0%) |
| 15 Years | 0 (0.0%) | 2 (50.0%) |
| 16 and 17 Years | 10 (43.5%) | 11 (78.6%) |
| 18 to 24 Years | 20 (37.0%) | 25 (35.7%) |
| 25 to 34 Years | 9 (17.3%) | 16 (64.0%) |
| 35 to 44 Years | 10 (34.5%) | 11 (23.9%) |
| 45 to 54 Years | 17 (37.8%) | 4 (11.1%) |
| 55 to 64 Years | 15 (37.5%) | 11 (31.4%) |
| 65 to 74 Years | 10 (12.2%) | 37 (42.0%) |
| 75 Years and over | 0 (0.0%) | 9 (40.9%) |
| Total | 114 (28.1%) | 151 (36.6%) |
Income Above Poverty by Sex and Age in Taholah
According to the poverty statistics in Taholah, males aged 5 years and females aged 5 years are the age groups that are most secure financially, with 100.0% of males and 100.0% of females in these age groups living above the poverty line.
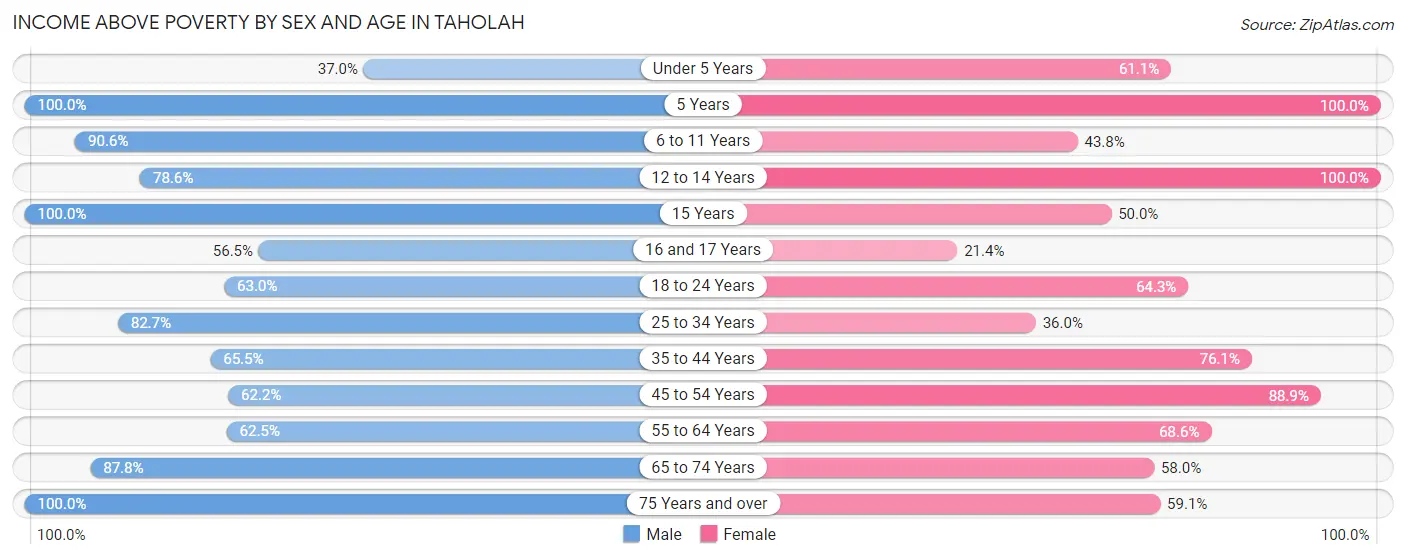
| Age Bracket | Male | Female |
| Under 5 Years | 10 (37.0%) | 11 (61.1%) |
| 5 Years | 3 (100.0%) | 6 (100.0%) |
| 6 to 11 Years | 29 (90.6%) | 14 (43.8%) |
| 12 to 14 Years | 11 (78.6%) | 16 (100.0%) |
| 15 Years | 1 (100.0%) | 2 (50.0%) |
| 16 and 17 Years | 13 (56.5%) | 3 (21.4%) |
| 18 to 24 Years | 34 (63.0%) | 45 (64.3%) |
| 25 to 34 Years | 43 (82.7%) | 9 (36.0%) |
| 35 to 44 Years | 19 (65.5%) | 35 (76.1%) |
| 45 to 54 Years | 28 (62.2%) | 32 (88.9%) |
| 55 to 64 Years | 25 (62.5%) | 24 (68.6%) |
| 65 to 74 Years | 72 (87.8%) | 51 (58.0%) |
| 75 Years and over | 4 (100.0%) | 13 (59.1%) |
| Total | 292 (71.9%) | 261 (63.3%) |
Income Below Poverty Among Married-Couple Families in Taholah
The poverty statistics for married-couple families in Taholah show that 5.6% or 5 of the total 90 families live below the poverty line. Families with no children have the highest poverty rate of 13.2%, comprising of 5 families. On the other hand, families with 1 or 2 children have the lowest poverty rate of 0.0%, which includes 0 families.
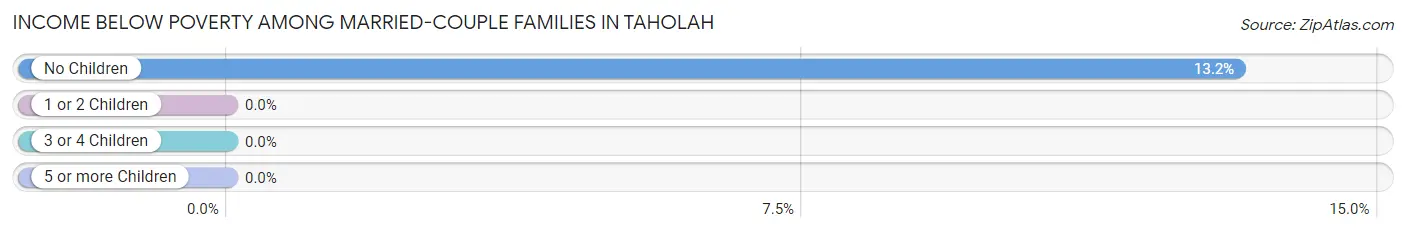
| Children | Above Poverty | Below Poverty |
| No Children | 33 (86.8%) | 5 (13.2%) |
| 1 or 2 Children | 45 (100.0%) | 0 (0.0%) |
| 3 or 4 Children | 6 (100.0%) | 0 (0.0%) |
| 5 or more Children | 1 (100.0%) | 0 (0.0%) |
| Total | 85 (94.4%) | 5 (5.6%) |
Income Below Poverty Among Single-Parent Households in Taholah
According to the poverty data in Taholah, 42.1% or 8 single-father households and 56.4% or 57 single-mother households are living below the poverty line. Among single-father households, those with 1 or 2 children have the highest poverty rate, with 8 households (47.1%) experiencing poverty. Likewise, among single-mother households, those with 3 or 4 children have the highest poverty rate, with 17 households (73.9%) falling below the poverty line.
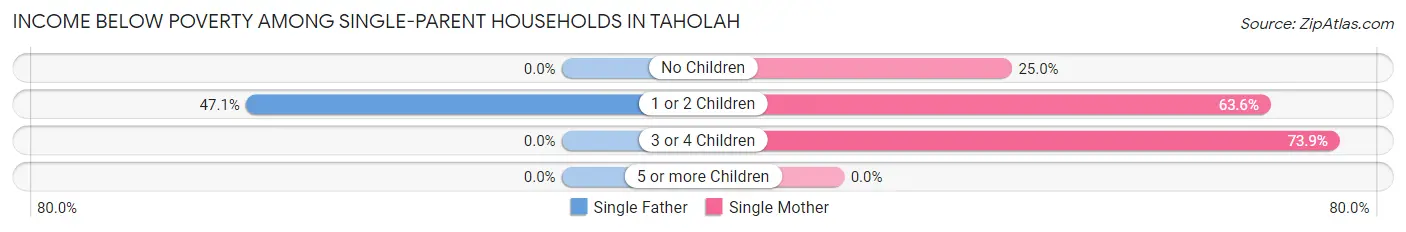
| Children | Single Father | Single Mother |
| No Children | 0 (0.0%) | 5 (25.0%) |
| 1 or 2 Children | 8 (47.1%) | 35 (63.6%) |
| 3 or 4 Children | 0 (0.0%) | 17 (73.9%) |
| 5 or more Children | 0 (0.0%) | 0 (0.0%) |
| Total | 8 (42.1%) | 57 (56.4%) |
Income Below Poverty Among Married-Couple vs Single-Parent Households in Taholah
The poverty data for Taholah shows that 5 of the married-couple family households (5.6%) and 65 of the single-parent households (54.2%) are living below the poverty level. Within the married-couple family households, those with no children have the highest poverty rate, with 5 households (13.2%) falling below the poverty line. Among the single-parent households, those with 3 or 4 children have the highest poverty rate, with 17 household (73.9%) living below poverty.
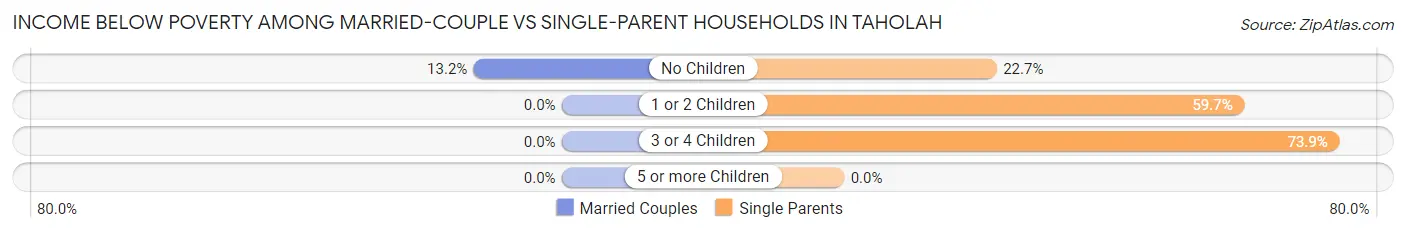
| Children | Married-Couple Families | Single-Parent Households |
| No Children | 5 (13.2%) | 5 (22.7%) |
| 1 or 2 Children | 0 (0.0%) | 43 (59.7%) |
| 3 or 4 Children | 0 (0.0%) | 17 (73.9%) |
| 5 or more Children | 0 (0.0%) | 0 (0.0%) |
| Total | 5 (5.6%) | 65 (54.2%) |
Race in Taholah
The most populous races in Taholah are Native / Alaskan (700 | 85.1%), Hispanic or Latino (77 | 9.4%), and Two or more Races (55 | 6.7%).
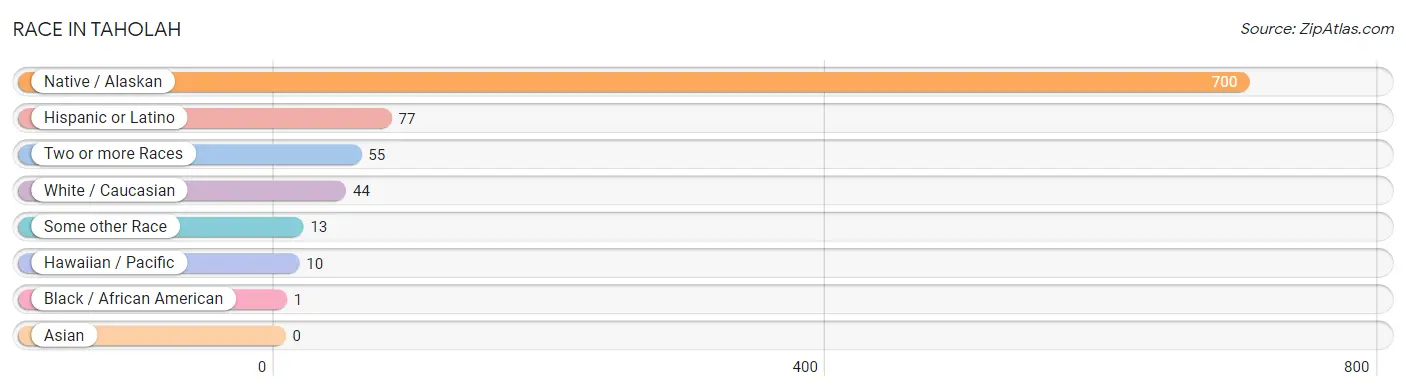
| Race | # Population | % Population |
| Asian | 0 | 0.0% |
| Black / African American | 1 | 0.1% |
| Hawaiian / Pacific | 10 | 1.2% |
| Hispanic or Latino | 77 | 9.4% |
| Native / Alaskan | 700 | 85.1% |
| White / Caucasian | 44 | 5.3% |
| Two or more Races | 55 | 6.7% |
| Some other Race | 13 | 1.6% |
| Total | 823 | 100.0% |
Ancestry in Taholah
The most populous ancestries reported in Taholah are Mexican (60 | 7.3%), Puget Sound Salish (36 | 4.4%), Irish (28 | 3.4%), African (27 | 3.3%), and Subsaharan African (27 | 3.3%), together accounting for 21.6% of all Taholah residents.
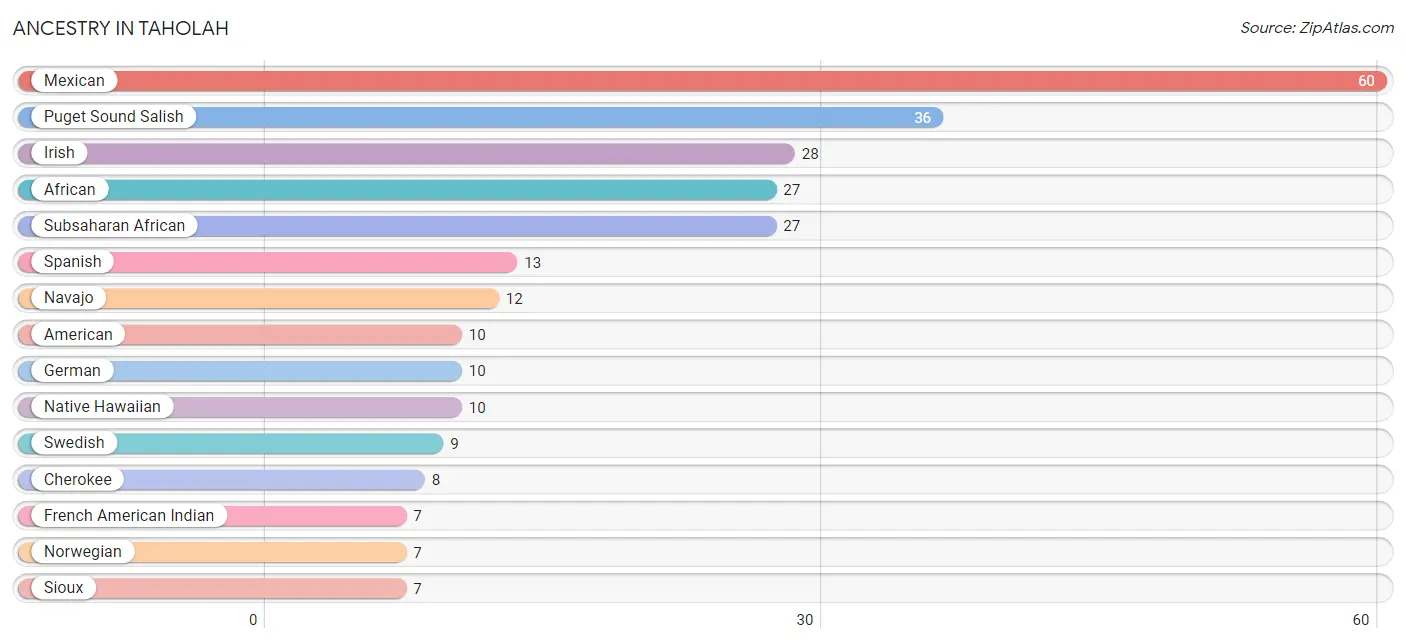
| Ancestry | # Population | % Population |
| African | 27 | 3.3% |
| Alaskan Athabascan | 4 | 0.5% |
| American | 10 | 1.2% |
| Cherokee | 8 | 1.0% |
| Creek | 1 | 0.1% |
| European | 1 | 0.1% |
| French American Indian | 7 | 0.9% |
| German | 10 | 1.2% |
| Irish | 28 | 3.4% |
| Mexican | 60 | 7.3% |
| Native Hawaiian | 10 | 1.2% |
| Navajo | 12 | 1.5% |
| Norwegian | 7 | 0.9% |
| Puerto Rican | 4 | 0.5% |
| Puget Sound Salish | 36 | 4.4% |
| Sioux | 7 | 0.9% |
| Spanish | 13 | 1.6% |
| Subsaharan African | 27 | 3.3% |
| Swedish | 9 | 1.1% |
| Thai | 1 | 0.1% |
| Yakama | 6 | 0.7% | View All 21 Rows |
Immigrants in Taholah
The most numerous immigrant groups reported in Taholah came from Canada (5 | 0.6%), Central America (1 | 0.1%), Latin America (1 | 0.1%), and Mexico (1 | 0.1%), together accounting for 1.0% of all Taholah residents.
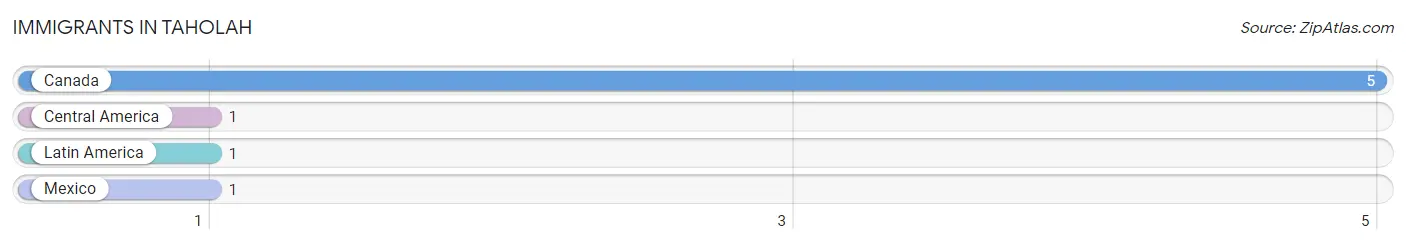
| Immigration Origin | # Population | % Population |
| Canada | 5 | 0.6% |
| Central America | 1 | 0.1% |
| Latin America | 1 | 0.1% |
| Mexico | 1 | 0.1% | View All 4 Rows |
Sex and Age in Taholah
Sex and Age in Taholah
The most populous age groups in Taholah are 70 to 74 Years (60 | 14.6%) for men and 65 to 69 Years (79 | 19.2%) for women.
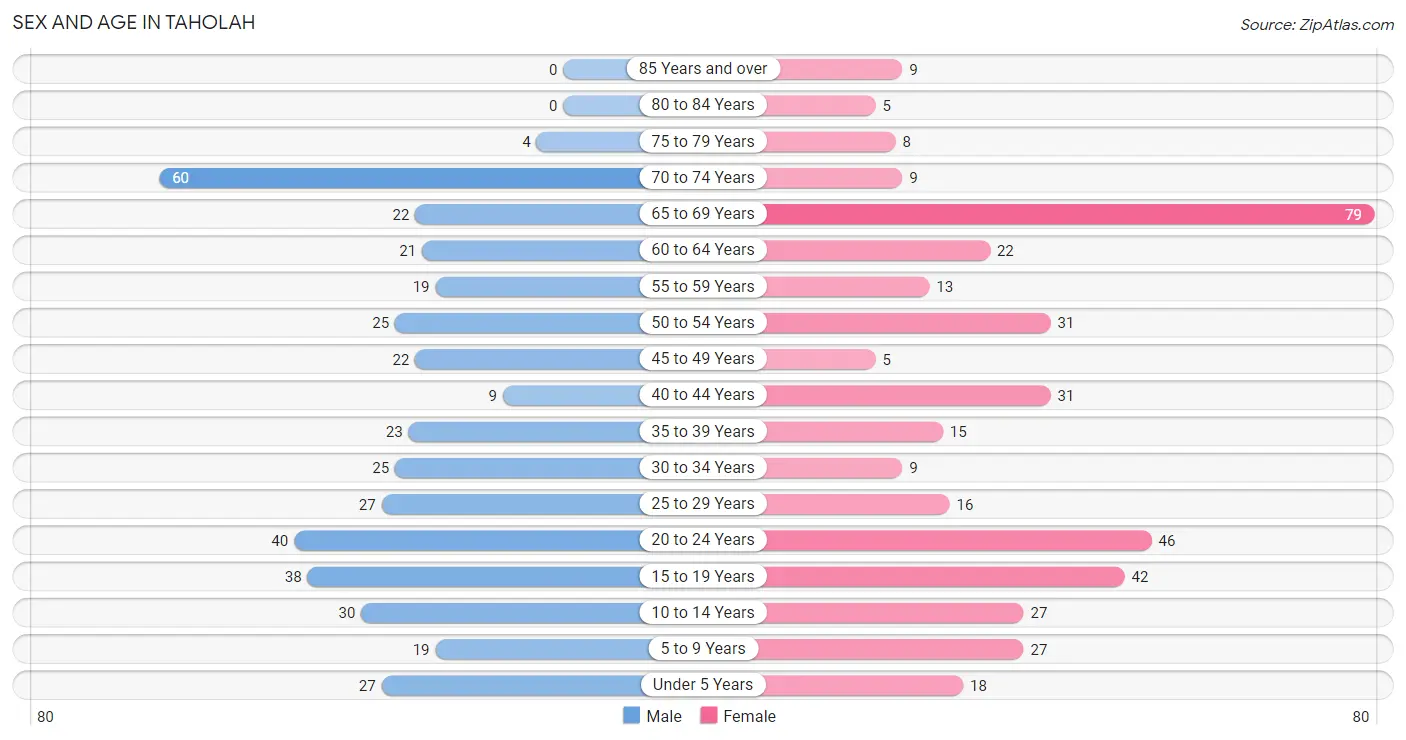
| Age Bracket | Male | Female |
| Under 5 Years | 27 (6.6%) | 18 (4.4%) |
| 5 to 9 Years | 19 (4.6%) | 27 (6.6%) |
| 10 to 14 Years | 30 (7.3%) | 27 (6.6%) |
| 15 to 19 Years | 38 (9.2%) | 42 (10.2%) |
| 20 to 24 Years | 40 (9.7%) | 46 (11.2%) |
| 25 to 29 Years | 27 (6.6%) | 16 (3.9%) |
| 30 to 34 Years | 25 (6.1%) | 9 (2.2%) |
| 35 to 39 Years | 23 (5.6%) | 15 (3.6%) |
| 40 to 44 Years | 9 (2.2%) | 31 (7.5%) |
| 45 to 49 Years | 22 (5.3%) | 5 (1.2%) |
| 50 to 54 Years | 25 (6.1%) | 31 (7.5%) |
| 55 to 59 Years | 19 (4.6%) | 13 (3.2%) |
| 60 to 64 Years | 21 (5.1%) | 22 (5.3%) |
| 65 to 69 Years | 22 (5.3%) | 79 (19.2%) |
| 70 to 74 Years | 60 (14.6%) | 9 (2.2%) |
| 75 to 79 Years | 4 (1.0%) | 8 (1.9%) |
| 80 to 84 Years | 0 (0.0%) | 5 (1.2%) |
| 85 Years and over | 0 (0.0%) | 9 (2.2%) |
| Total | 411 (100.0%) | 412 (100.0%) |
Families and Households in Taholah
Median Family Size in Taholah
The median family size in Taholah is 3.47 persons per family, with married-couple families (90 | 42.9%) accounting for the largest median family size of 3.69 persons per family. On the other hand, single female/mother families (101 | 48.1%) represent the smallest median family size with 3.27 persons per family.
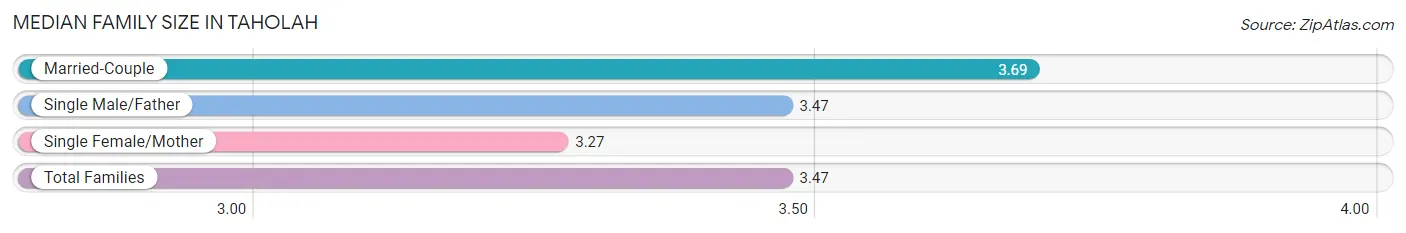
| Family Type | # Families | Family Size |
| Married-Couple | 90 (42.9%) | 3.69 |
| Single Male/Father | 19 (9.0%) | 3.47 |
| Single Female/Mother | 101 (48.1%) | 3.27 |
| Total Families | 210 (100.0%) | 3.47 |
Median Household Size in Taholah
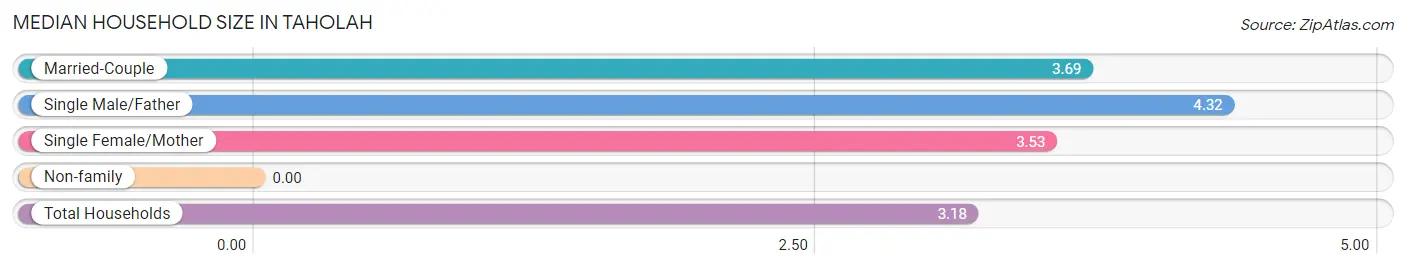
| Household Type | # Households | Household Size |
| Married-Couple | 90 (35.0%) | 3.69 |
| Single Male/Father | 19 (7.4%) | 4.32 |
| Single Female/Mother | 101 (39.3%) | 3.53 |
| Non-family | 47 (18.3%) | - |
| Total Households | 257 (100.0%) | 3.18 |
Household Size by Marriage Status in Taholah
Out of a total of 257 households in Taholah, 210 (81.7%) are family households, while 47 (18.3%) are nonfamily households. The most numerous type of family households are 2-person households, comprising 63, and the most common type of nonfamily households are 1-person households, comprising 47.
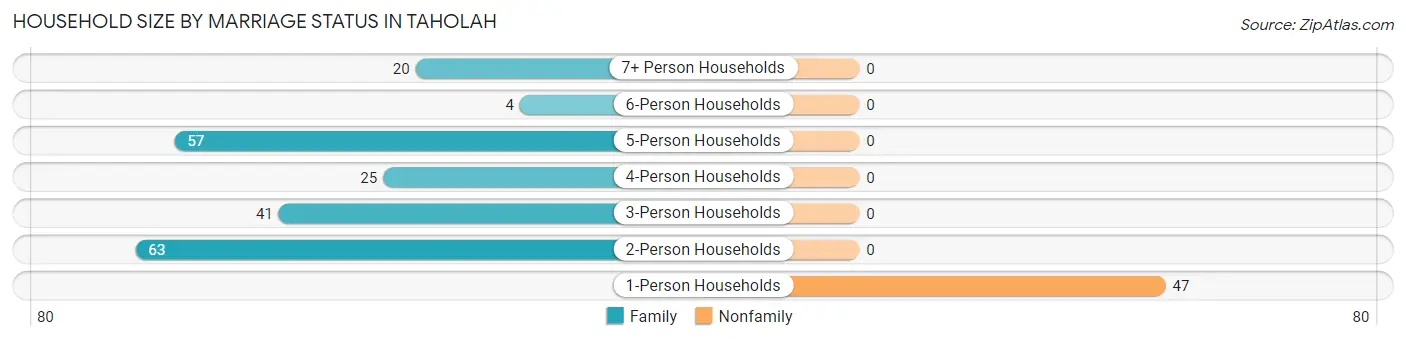
| Household Size | Family Households | Nonfamily Households |
| 1-Person Households | - | 47 (18.3%) |
| 2-Person Households | 63 (24.5%) | 0 (0.0%) |
| 3-Person Households | 41 (16.0%) | 0 (0.0%) |
| 4-Person Households | 25 (9.7%) | 0 (0.0%) |
| 5-Person Households | 57 (22.2%) | 0 (0.0%) |
| 6-Person Households | 4 (1.6%) | 0 (0.0%) |
| 7+ Person Households | 20 (7.8%) | 0 (0.0%) |
| Total | 210 (81.7%) | 47 (18.3%) |
Female Fertility in Taholah
Fertility by Age in Taholah
Average fertility rate in Taholah is 24.0 births per 1,000 women. Women in the age bracket of 20 to 34 years have the highest fertility rate with 56.0 births per 1,000 women. Women in the age bracket of 20 to 34 years acount for 100.0% of all women with births.
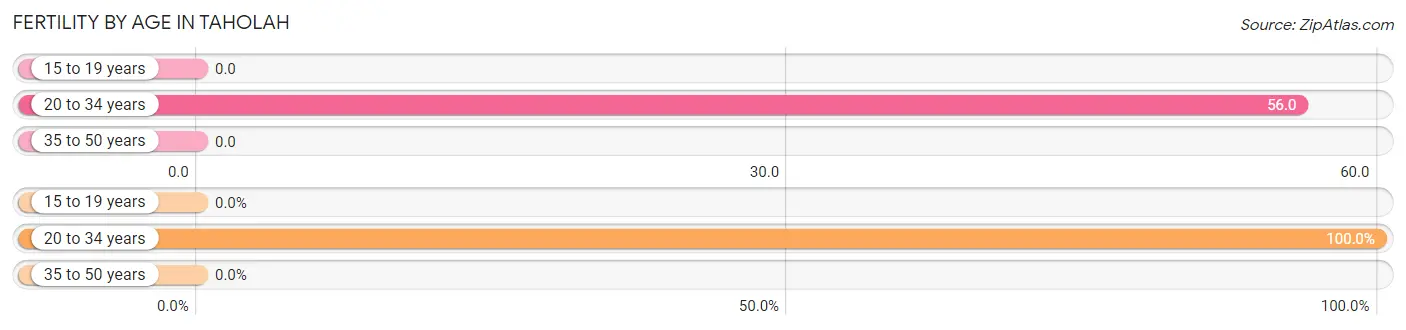
| Age Bracket | Women with Births | Births / 1,000 Women |
| 15 to 19 years | 0 (0.0%) | 0.0 |
| 20 to 34 years | 4 (100.0%) | 56.0 |
| 35 to 50 years | 0 (0.0%) | 0.0 |
| Total | 4 (100.0%) | 24.0 |
Fertility by Age by Marriage Status in Taholah
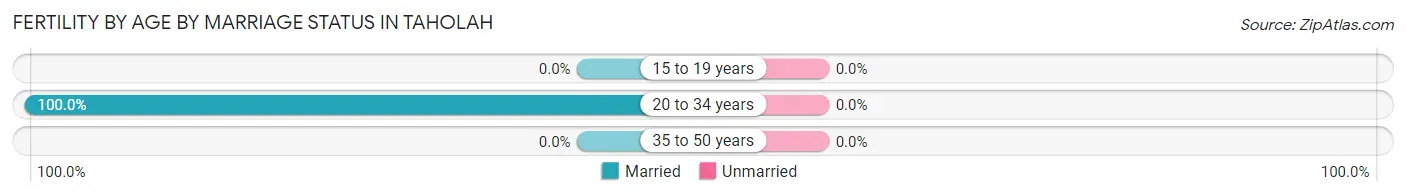
| Age Bracket | Married | Unmarried |
| 15 to 19 years | 0 (0.0%) | 0 (0.0%) |
| 20 to 34 years | 4 (100.0%) | 0 (0.0%) |
| 35 to 50 years | 0 (0.0%) | 0 (0.0%) |
| Total | 4 (100.0%) | 0 (0.0%) |
Fertility by Education in Taholah
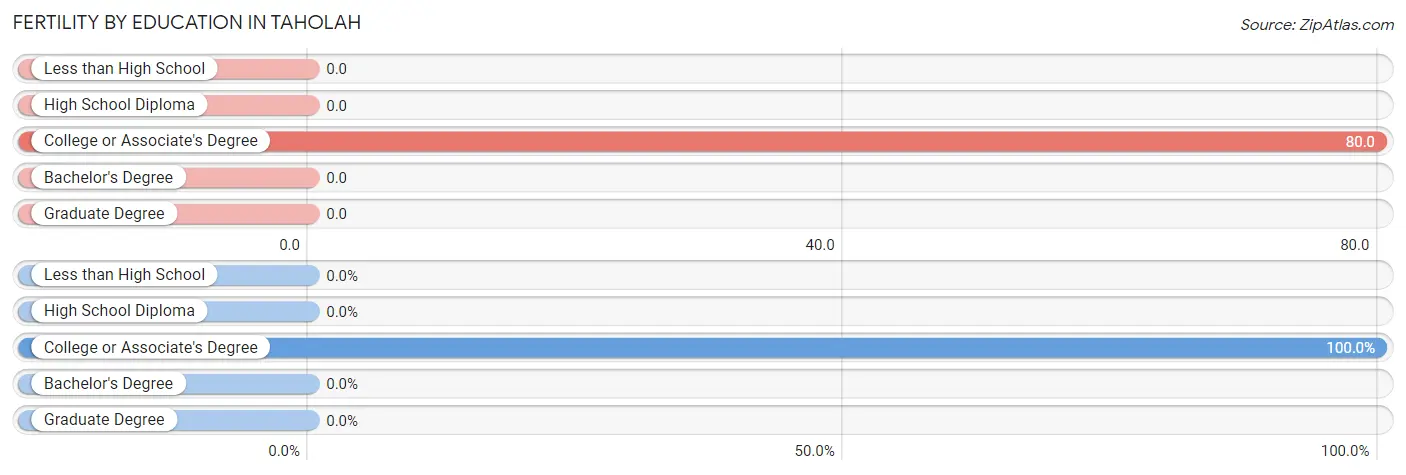
| Educational Attainment | Women with Births | Births / 1,000 Women |
| Less than High School | 0 (0.0%) | 0.0 |
| High School Diploma | 0 (0.0%) | 0.0 |
| College or Associate's Degree | 4 (100.0%) | 80.0 |
| Bachelor's Degree | 0 (0.0%) | 0.0 |
| Graduate Degree | 0 (0.0%) | 0.0 |
| Total | 4 (100.0%) | 24.0 |
Fertility by Education by Marriage Status in Taholah
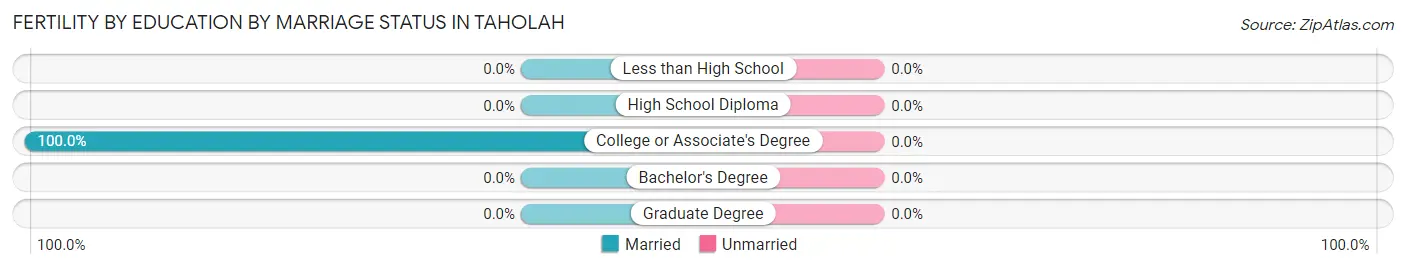
| Educational Attainment | Married | Unmarried |
| Less than High School | 0 (0.0%) | 0 (0.0%) |
| High School Diploma | 0 (0.0%) | 0 (0.0%) |
| College or Associate's Degree | 4 (100.0%) | 0 (0.0%) |
| Bachelor's Degree | 0 (0.0%) | 0 (0.0%) |
| Graduate Degree | 0 (0.0%) | 0 (0.0%) |
| Total | 4 (100.0%) | 0 (0.0%) |
Employment Characteristics in Taholah
Employment by Class of Employer in Taholah
Among the 303 employed individuals in Taholah, local government employees (127 | 41.9%), private company employees (98 | 32.3%), and federal government employees (43 | 14.2%) make up the most common classes of employment.
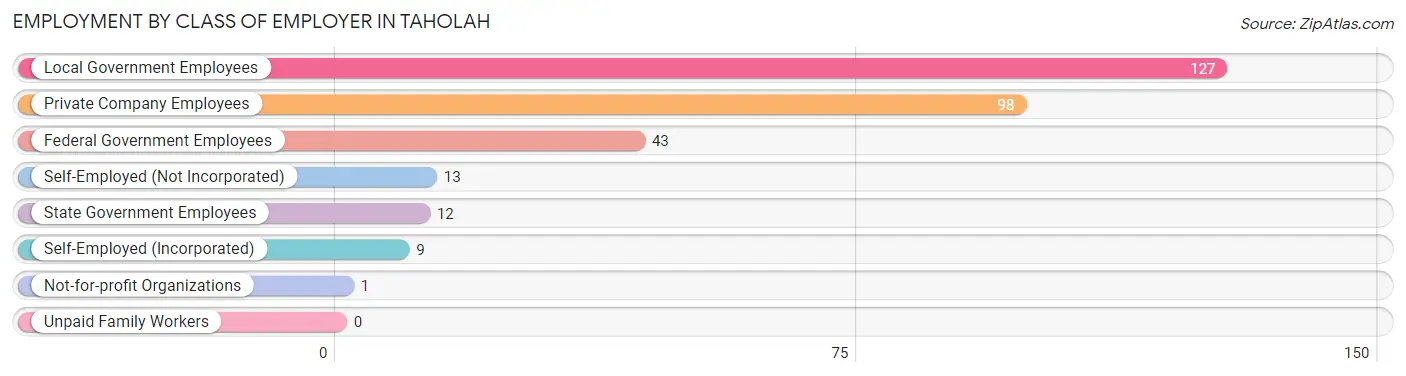
| Employer Class | # Employees | % Employees |
| Private Company Employees | 98 | 32.3% |
| Self-Employed (Incorporated) | 9 | 3.0% |
| Self-Employed (Not Incorporated) | 13 | 4.3% |
| Not-for-profit Organizations | 1 | 0.3% |
| Local Government Employees | 127 | 41.9% |
| State Government Employees | 12 | 4.0% |
| Federal Government Employees | 43 | 14.2% |
| Unpaid Family Workers | 0 | 0.0% |
| Total | 303 | 100.0% |
Employment Status by Age in Taholah
According to the labor force statistics for Taholah, out of the total population over 16 years of age (670), 52.4% or 351 individuals are in the labor force, with 9.4% or 33 of them unemployed. The age group with the highest labor force participation rate is 30 to 34 years, with 85.3% or 29 individuals in the labor force. Within the labor force, the 25 to 29 years age range has the highest percentage of unemployed individuals, with 70.0% or 21 of them being unemployed.
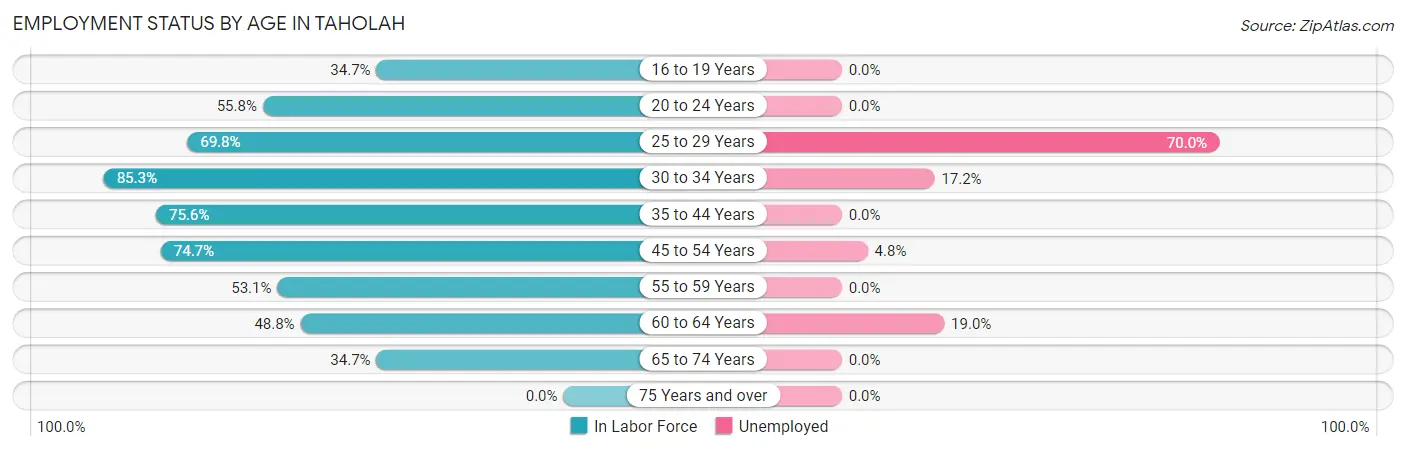
| Age Bracket | In Labor Force | Unemployed |
| 16 to 19 Years | 26 (34.7%) | 0 (0.0%) |
| 20 to 24 Years | 48 (55.8%) | 0 (0.0%) |
| 25 to 29 Years | 30 (69.8%) | 21 (70.0%) |
| 30 to 34 Years | 29 (85.3%) | 5 (17.2%) |
| 35 to 44 Years | 59 (75.6%) | 0 (0.0%) |
| 45 to 54 Years | 62 (74.7%) | 3 (4.8%) |
| 55 to 59 Years | 17 (53.1%) | 0 (0.0%) |
| 60 to 64 Years | 21 (48.8%) | 4 (19.0%) |
| 65 to 74 Years | 59 (34.7%) | 0 (0.0%) |
| 75 Years and over | 0 (0.0%) | 0 (0.0%) |
| Total | 351 (52.4%) | 33 (9.4%) |
Employment Status by Educational Attainment in Taholah
According to labor force statistics for Taholah, 69.6% of individuals (218) out of the total population between 25 and 64 years of age (313) are in the labor force, with 15.1% or 33 of them being unemployed. The group with the highest labor force participation rate are those with the educational attainment of bachelor's degree or higher, with 100.0% or 14 individuals in the labor force. Within the labor force, individuals with less than high school education have the highest percentage of unemployment, with 37.5% or 3 of them being unemployed.
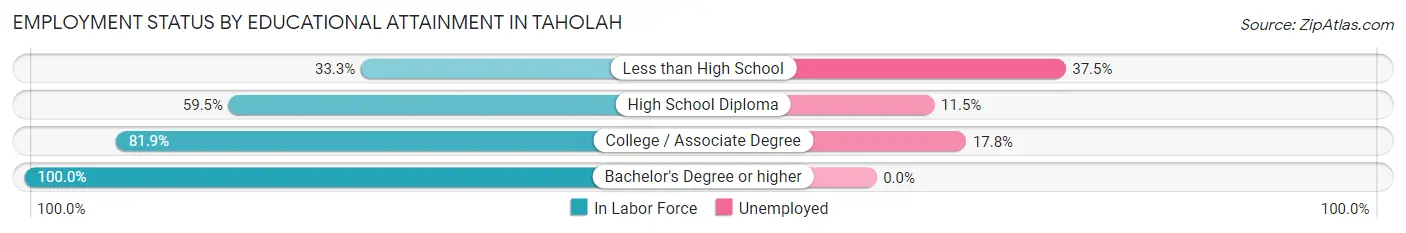
| Educational Attainment | In Labor Force | Unemployed |
| Less than High School | 8 (33.3%) | 9 (37.5%) |
| High School Diploma | 78 (59.5%) | 15 (11.5%) |
| College / Associate Degree | 118 (81.9%) | 26 (17.8%) |
| Bachelor's Degree or higher | 14 (100.0%) | 0 (0.0%) |
| Total | 218 (69.6%) | 47 (15.1%) |
Employment Occupations by Sex in Taholah
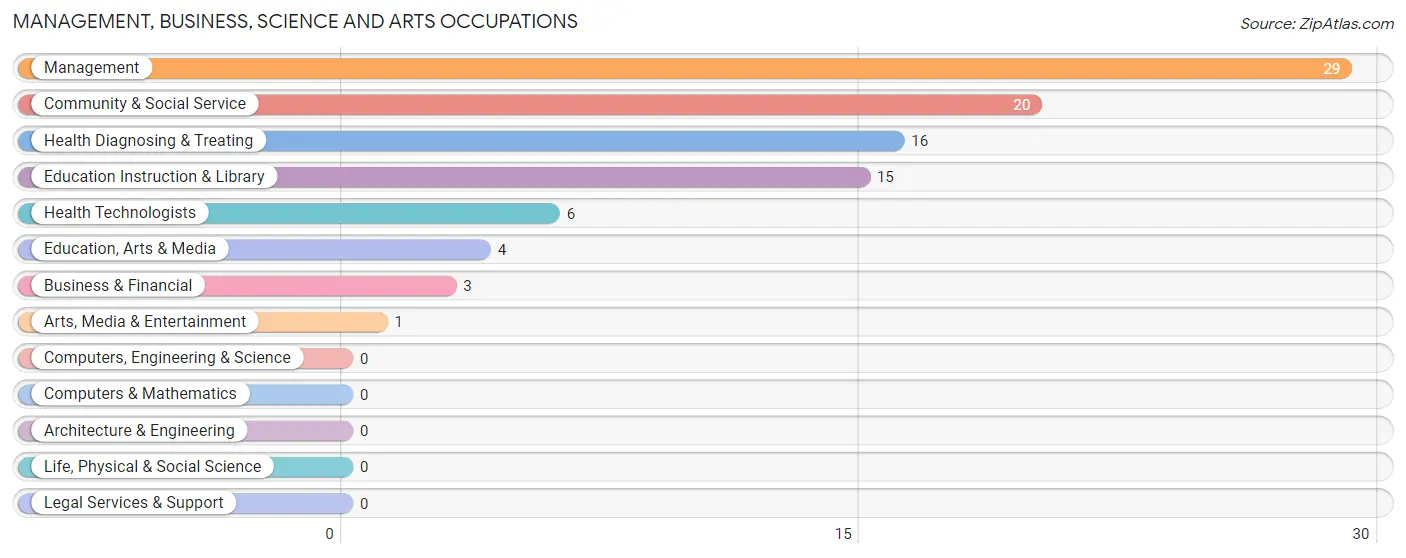
Management, Business, Science and Arts Occupations
The most common Management, Business, Science and Arts occupations in Taholah are Management (29 | 9.1%), Community & Social Service (20 | 6.3%), Health Diagnosing & Treating (16 | 5.0%), Education Instruction & Library (15 | 4.7%), and Health Technologists (6 | 1.9%).
Management, Business, Science and Arts Occupations by Sex
Within the Management, Business, Science and Arts occupations in Taholah, the most male-oriented occupations are Education, Arts & Media (100.0%), Community & Social Service (50.0%), and Education Instruction & Library (40.0%), while the most female-oriented occupations are Business & Financial (100.0%), Arts, Media & Entertainment (100.0%), and Health Diagnosing & Treating (100.0%).
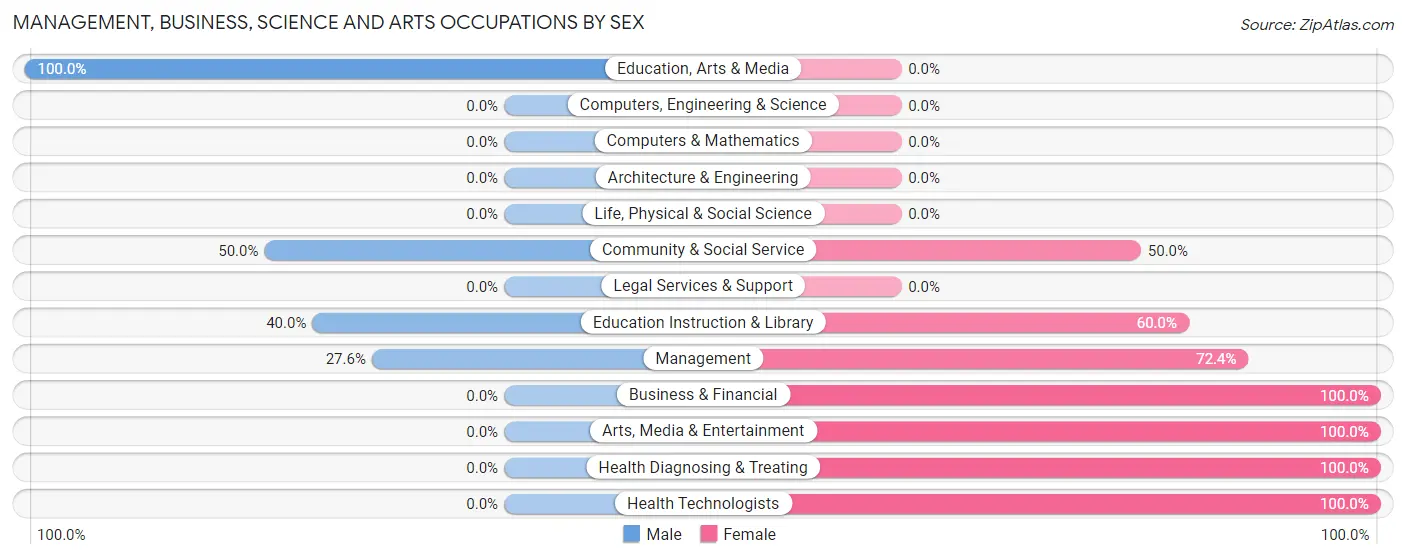
| Occupation | Male | Female |
| Management | 8 (27.6%) | 21 (72.4%) |
| Business & Financial | 0 (0.0%) | 3 (100.0%) |
| Computers, Engineering & Science | 0 (0.0%) | 0 (0.0%) |
| Computers & Mathematics | 0 (0.0%) | 0 (0.0%) |
| Architecture & Engineering | 0 (0.0%) | 0 (0.0%) |
| Life, Physical & Social Science | 0 (0.0%) | 0 (0.0%) |
| Community & Social Service | 10 (50.0%) | 10 (50.0%) |
| Education, Arts & Media | 4 (100.0%) | 0 (0.0%) |
| Legal Services & Support | 0 (0.0%) | 0 (0.0%) |
| Education Instruction & Library | 6 (40.0%) | 9 (60.0%) |
| Arts, Media & Entertainment | 0 (0.0%) | 1 (100.0%) |
| Health Diagnosing & Treating | 0 (0.0%) | 16 (100.0%) |
| Health Technologists | 0 (0.0%) | 6 (100.0%) |
| Total (Category) | 18 (26.5%) | 50 (73.5%) |
| Total (Overall) | 176 (55.3%) | 142 (44.7%) |
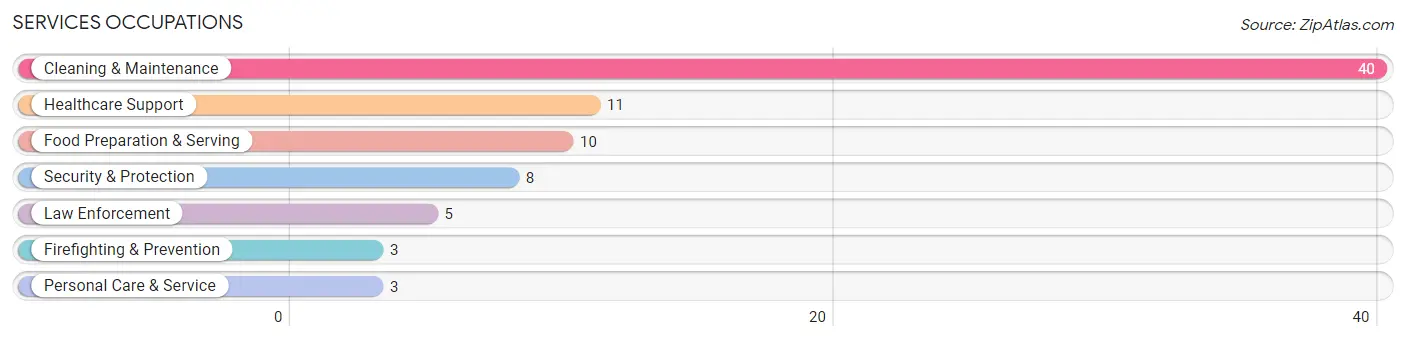
Services Occupations
The most common Services occupations in Taholah are Cleaning & Maintenance (40 | 12.6%), Healthcare Support (11 | 3.5%), Food Preparation & Serving (10 | 3.1%), Security & Protection (8 | 2.5%), and Law Enforcement (5 | 1.6%).
Services Occupations by Sex
Within the Services occupations in Taholah, the most male-oriented occupations are Firefighting & Prevention (100.0%), Food Preparation & Serving (70.0%), and Personal Care & Service (66.7%), while the most female-oriented occupations are Healthcare Support (100.0%), Law Enforcement (100.0%), and Security & Protection (62.5%).
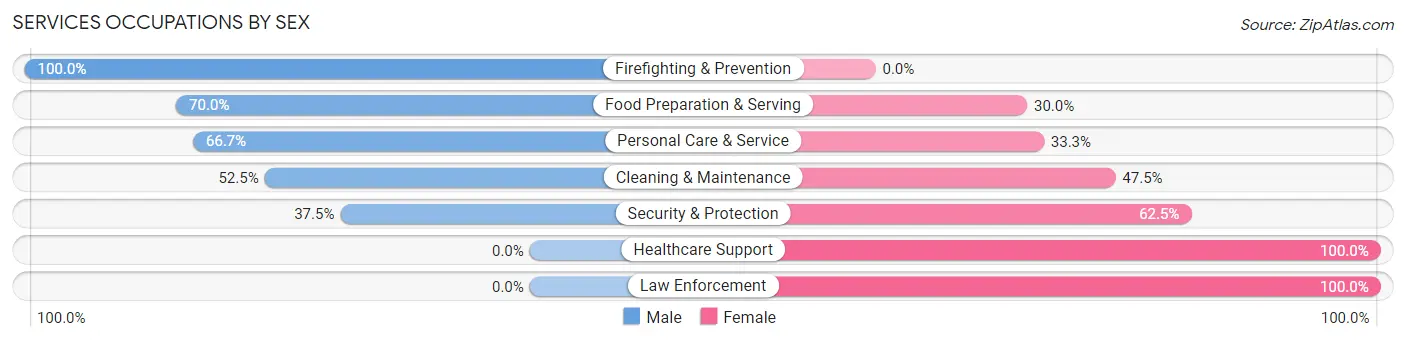
| Occupation | Male | Female |
| Healthcare Support | 0 (0.0%) | 11 (100.0%) |
| Security & Protection | 3 (37.5%) | 5 (62.5%) |
| Firefighting & Prevention | 3 (100.0%) | 0 (0.0%) |
| Law Enforcement | 0 (0.0%) | 5 (100.0%) |
| Food Preparation & Serving | 7 (70.0%) | 3 (30.0%) |
| Cleaning & Maintenance | 21 (52.5%) | 19 (47.5%) |
| Personal Care & Service | 2 (66.7%) | 1 (33.3%) |
| Total (Category) | 33 (45.8%) | 39 (54.2%) |
| Total (Overall) | 176 (55.3%) | 142 (44.7%) |
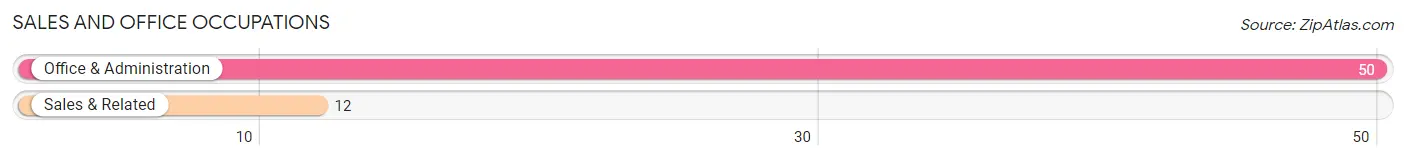
Sales and Office Occupations
The most common Sales and Office occupations in Taholah are Office & Administration (50 | 15.7%), and Sales & Related (12 | 3.8%).
Sales and Office Occupations by Sex
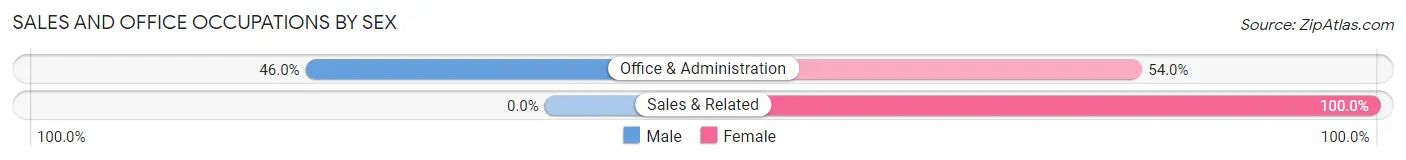
| Occupation | Male | Female |
| Sales & Related | 0 (0.0%) | 12 (100.0%) |
| Office & Administration | 23 (46.0%) | 27 (54.0%) |
| Total (Category) | 23 (37.1%) | 39 (62.9%) |
| Total (Overall) | 176 (55.3%) | 142 (44.7%) |
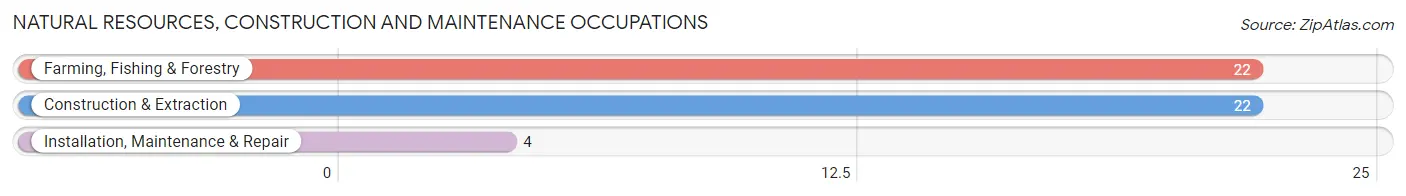
Natural Resources, Construction and Maintenance Occupations
The most common Natural Resources, Construction and Maintenance occupations in Taholah are Farming, Fishing & Forestry (22 | 6.9%), Construction & Extraction (22 | 6.9%), and Installation, Maintenance & Repair (4 | 1.3%).
Natural Resources, Construction and Maintenance Occupations by Sex
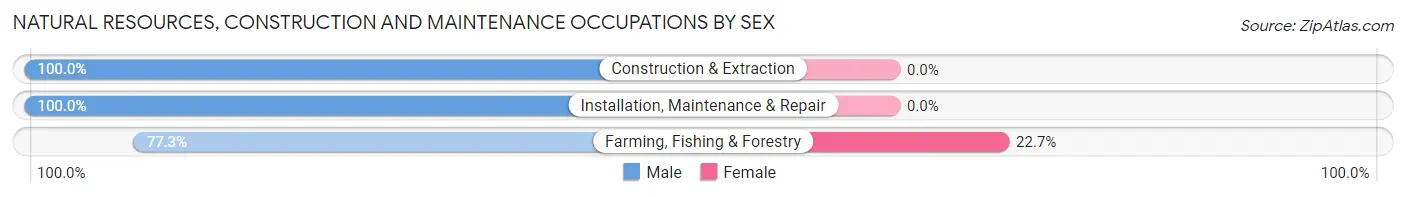
| Occupation | Male | Female |
| Farming, Fishing & Forestry | 17 (77.3%) | 5 (22.7%) |
| Construction & Extraction | 22 (100.0%) | 0 (0.0%) |
| Installation, Maintenance & Repair | 4 (100.0%) | 0 (0.0%) |
| Total (Category) | 43 (89.6%) | 5 (10.4%) |
| Total (Overall) | 176 (55.3%) | 142 (44.7%) |
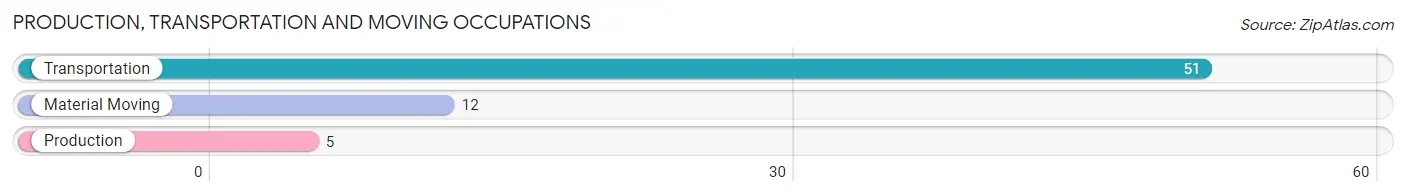
Production, Transportation and Moving Occupations
The most common Production, Transportation and Moving occupations in Taholah are Transportation (51 | 16.0%), Material Moving (12 | 3.8%), and Production (5 | 1.6%).
Production, Transportation and Moving Occupations by Sex
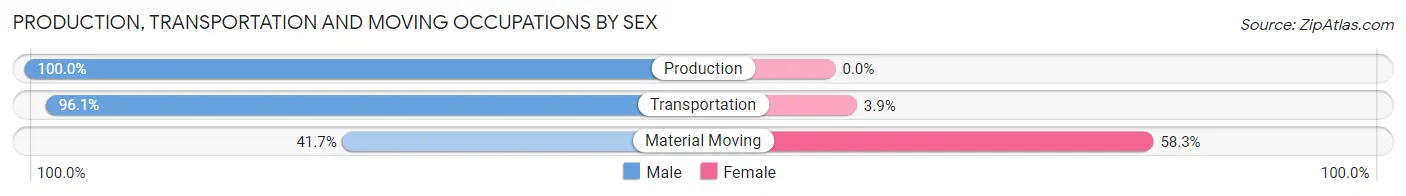
| Occupation | Male | Female |
| Production | 5 (100.0%) | 0 (0.0%) |
| Transportation | 49 (96.1%) | 2 (3.9%) |
| Material Moving | 5 (41.7%) | 7 (58.3%) |
| Total (Category) | 59 (86.8%) | 9 (13.2%) |
| Total (Overall) | 176 (55.3%) | 142 (44.7%) |
Employment Industries by Sex in Taholah
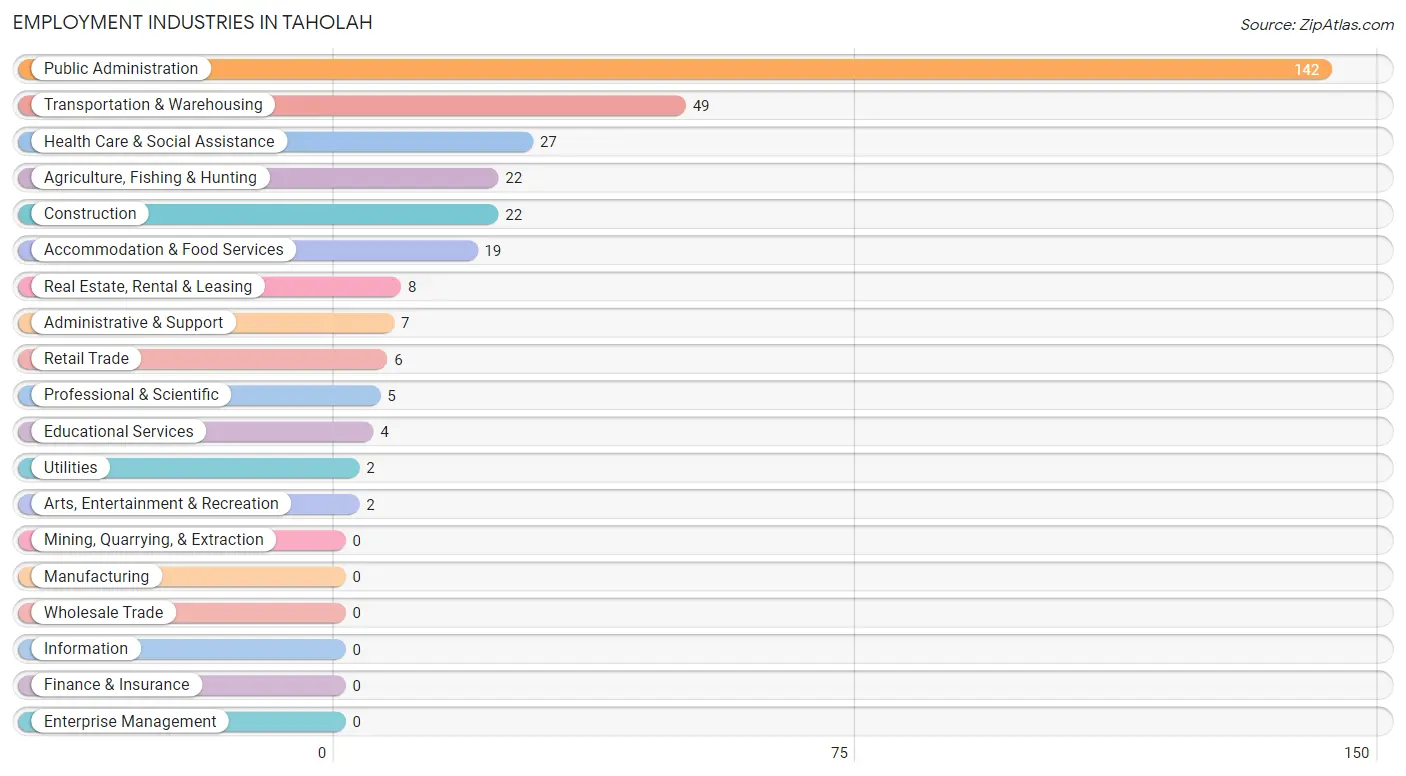
Employment Industries in Taholah
The major employment industries in Taholah include Public Administration (142 | 44.7%), Transportation & Warehousing (49 | 15.4%), Health Care & Social Assistance (27 | 8.5%), Agriculture, Fishing & Hunting (22 | 6.9%), and Construction (22 | 6.9%).
Employment Industries by Sex in Taholah
The Taholah industries that see more men than women are Construction (100.0%), Transportation & Warehousing (100.0%), and Utilities (100.0%), whereas the industries that tend to have a higher number of women are Retail Trade (100.0%), Professional & Scientific (100.0%), and Health Care & Social Assistance (100.0%).
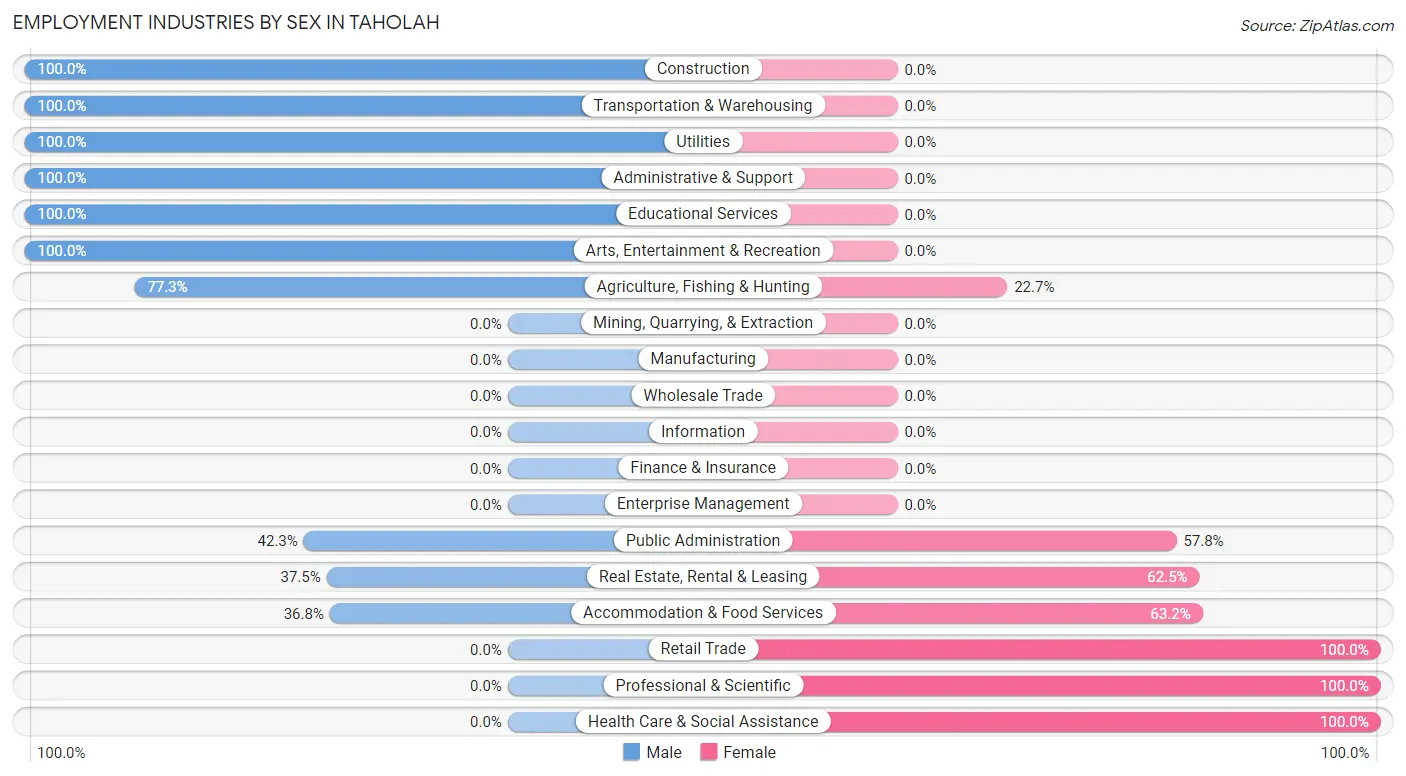
| Industry | Male | Female |
| Agriculture, Fishing & Hunting | 17 (77.3%) | 5 (22.7%) |
| Mining, Quarrying, & Extraction | 0 (0.0%) | 0 (0.0%) |
| Construction | 22 (100.0%) | 0 (0.0%) |
| Manufacturing | 0 (0.0%) | 0 (0.0%) |
| Wholesale Trade | 0 (0.0%) | 0 (0.0%) |
| Retail Trade | 0 (0.0%) | 6 (100.0%) |
| Transportation & Warehousing | 49 (100.0%) | 0 (0.0%) |
| Utilities | 2 (100.0%) | 0 (0.0%) |
| Information | 0 (0.0%) | 0 (0.0%) |
| Finance & Insurance | 0 (0.0%) | 0 (0.0%) |
| Real Estate, Rental & Leasing | 3 (37.5%) | 5 (62.5%) |
| Professional & Scientific | 0 (0.0%) | 5 (100.0%) |
| Enterprise Management | 0 (0.0%) | 0 (0.0%) |
| Administrative & Support | 7 (100.0%) | 0 (0.0%) |
| Educational Services | 4 (100.0%) | 0 (0.0%) |
| Health Care & Social Assistance | 0 (0.0%) | 27 (100.0%) |
| Arts, Entertainment & Recreation | 2 (100.0%) | 0 (0.0%) |
| Accommodation & Food Services | 7 (36.8%) | 12 (63.2%) |
| Public Administration | 60 (42.2%) | 82 (57.8%) |
| Total | 176 (55.3%) | 142 (44.7%) |
Education in Taholah
School Enrollment in Taholah
The most common levels of schooling among the 187 students in Taholah are high school (64 | 34.2%), middle school (43 | 23.0%), and nursery / preschool (32 | 17.1%).
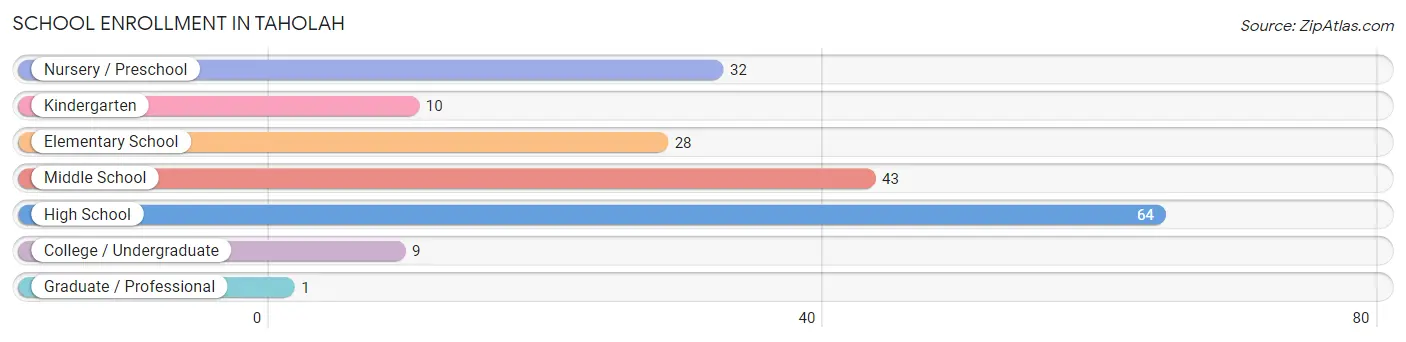
| School Level | # Students | % Students |
| Nursery / Preschool | 32 | 17.1% |
| Kindergarten | 10 | 5.3% |
| Elementary School | 28 | 15.0% |
| Middle School | 43 | 23.0% |
| High School | 64 | 34.2% |
| College / Undergraduate | 9 | 4.8% |
| Graduate / Professional | 1 | 0.5% |
| Total | 187 | 100.0% |
School Enrollment by Age by Funding Source in Taholah
Out of a total of 187 students who are enrolled in schools in Taholah, 8 (4.3%) attend a private institution, while the remaining 179 (95.7%) are enrolled in public schools. The age group of 15 to 17 year olds has the highest likelihood of being enrolled in private schools, with 6 (14.3% in the age bracket) enrolled. Conversely, the age group of 5 to 9 year old has the lowest likelihood of being enrolled in a private school, with 37 (100.0% in the age bracket) attending a public institution.
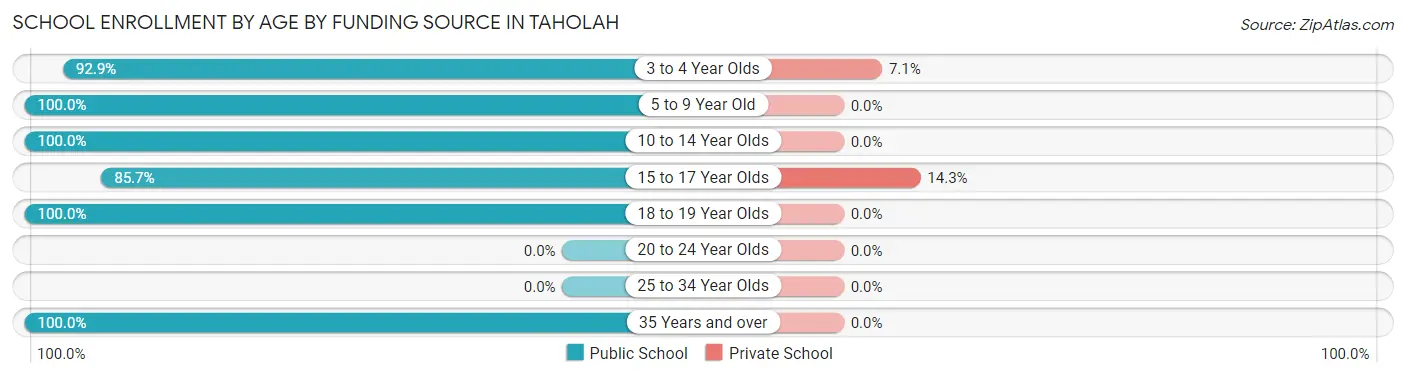
| Age Bracket | Public School | Private School |
| 3 to 4 Year Olds | 26 (92.9%) | 2 (7.1%) |
| 5 to 9 Year Old | 37 (100.0%) | 0 (0.0%) |
| 10 to 14 Year Olds | 57 (100.0%) | 0 (0.0%) |
| 15 to 17 Year Olds | 36 (85.7%) | 6 (14.3%) |
| 18 to 19 Year Olds | 16 (100.0%) | 0 (0.0%) |
| 20 to 24 Year Olds | 0 (0.0%) | 0 (0.0%) |
| 25 to 34 Year Olds | 0 (0.0%) | 0 (0.0%) |
| 35 Years and over | 7 (100.0%) | 0 (0.0%) |
| Total | 179 (95.7%) | 8 (4.3%) |
Educational Attainment by Field of Study in Taholah
Liberal arts & history (10 | 28.6%), social sciences (7 | 20.0%), arts & humanities (6 | 17.1%), psychology (4 | 11.4%), and business (4 | 11.4%) are the most common fields of study among 35 individuals in Taholah who have obtained a bachelor's degree or higher.
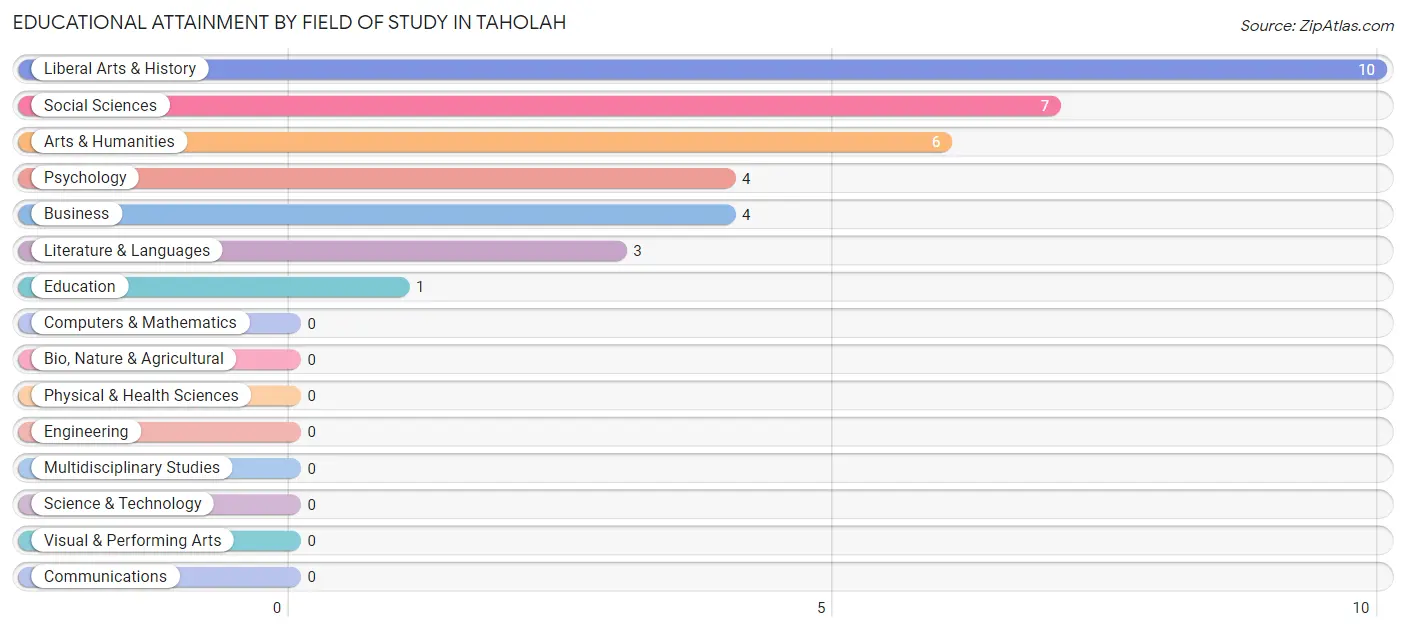
| Field of Study | # Graduates | % Graduates |
| Computers & Mathematics | 0 | 0.0% |
| Bio, Nature & Agricultural | 0 | 0.0% |
| Physical & Health Sciences | 0 | 0.0% |
| Psychology | 4 | 11.4% |
| Social Sciences | 7 | 20.0% |
| Engineering | 0 | 0.0% |
| Multidisciplinary Studies | 0 | 0.0% |
| Science & Technology | 0 | 0.0% |
| Business | 4 | 11.4% |
| Education | 1 | 2.9% |
| Literature & Languages | 3 | 8.6% |
| Liberal Arts & History | 10 | 28.6% |
| Visual & Performing Arts | 0 | 0.0% |
| Communications | 0 | 0.0% |
| Arts & Humanities | 6 | 17.1% |
| Total | 35 | 100.0% |
Transportation & Commute in Taholah
Vehicle Availability by Sex in Taholah
The most prevalent vehicle ownership categories in Taholah are males with 2 vehicles (101, accounting for 59.8%) and females with 2 vehicles (51, making up 75.4%).
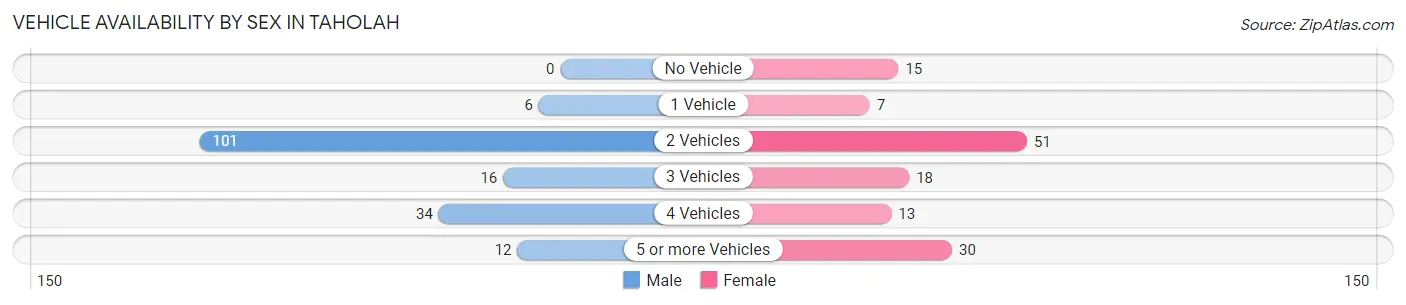
| Vehicles Available | Male | Female |
| No Vehicle | 0 (0.0%) | 15 (11.2%) |
| 1 Vehicle | 6 (3.5%) | 7 (5.2%) |
| 2 Vehicles | 101 (59.8%) | 51 (38.1%) |
| 3 Vehicles | 16 (9.5%) | 18 (13.4%) |
| 4 Vehicles | 34 (20.1%) | 13 (9.7%) |
| 5 or more Vehicles | 12 (7.1%) | 30 (22.4%) |
| Total | 169 (100.0%) | 134 (100.0%) |
Commute Time in Taholah
The most frequently occuring commute durations in Taholah are less than 5 minutes (114 commuters, 37.8%), 5 to 9 minutes (69 commuters, 22.9%), and 10 to 14 minutes (64 commuters, 21.2%).
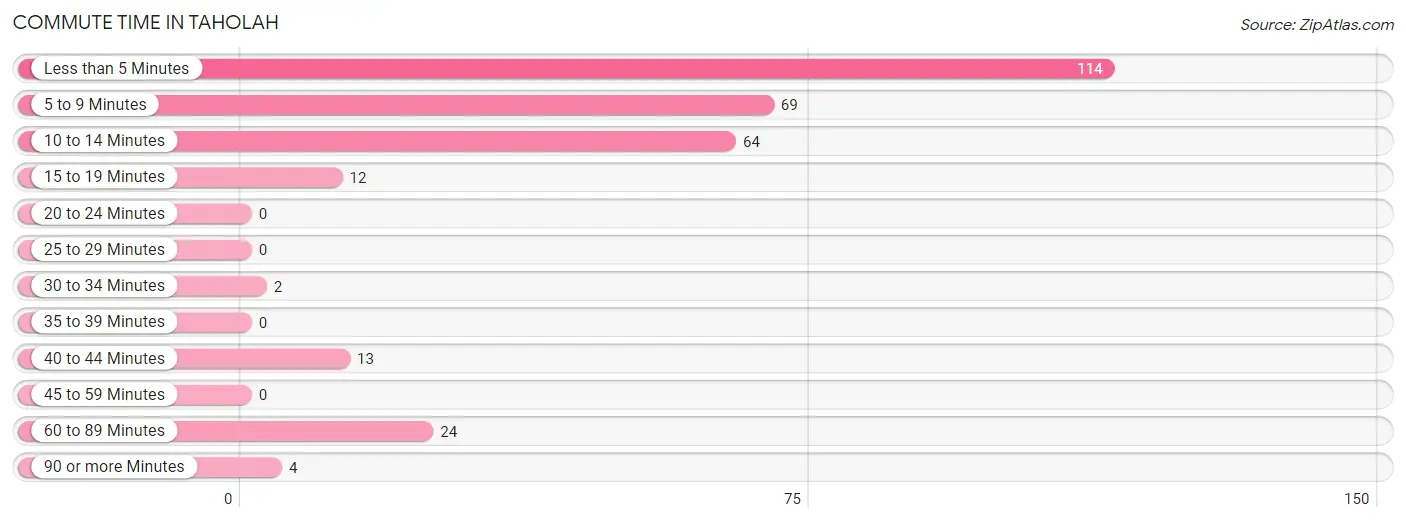
| Commute Time | # Commuters | % Commuters |
| Less than 5 Minutes | 114 | 37.8% |
| 5 to 9 Minutes | 69 | 22.9% |
| 10 to 14 Minutes | 64 | 21.2% |
| 15 to 19 Minutes | 12 | 4.0% |
| 20 to 24 Minutes | 0 | 0.0% |
| 25 to 29 Minutes | 0 | 0.0% |
| 30 to 34 Minutes | 2 | 0.7% |
| 35 to 39 Minutes | 0 | 0.0% |
| 40 to 44 Minutes | 13 | 4.3% |
| 45 to 59 Minutes | 0 | 0.0% |
| 60 to 89 Minutes | 24 | 8.0% |
| 90 or more Minutes | 4 | 1.3% |
Commute Time by Sex in Taholah
The most common commute times in Taholah are 10 to 14 minutes (59 commuters, 34.9%) for males and less than 5 minutes (56 commuters, 42.1%) for females.
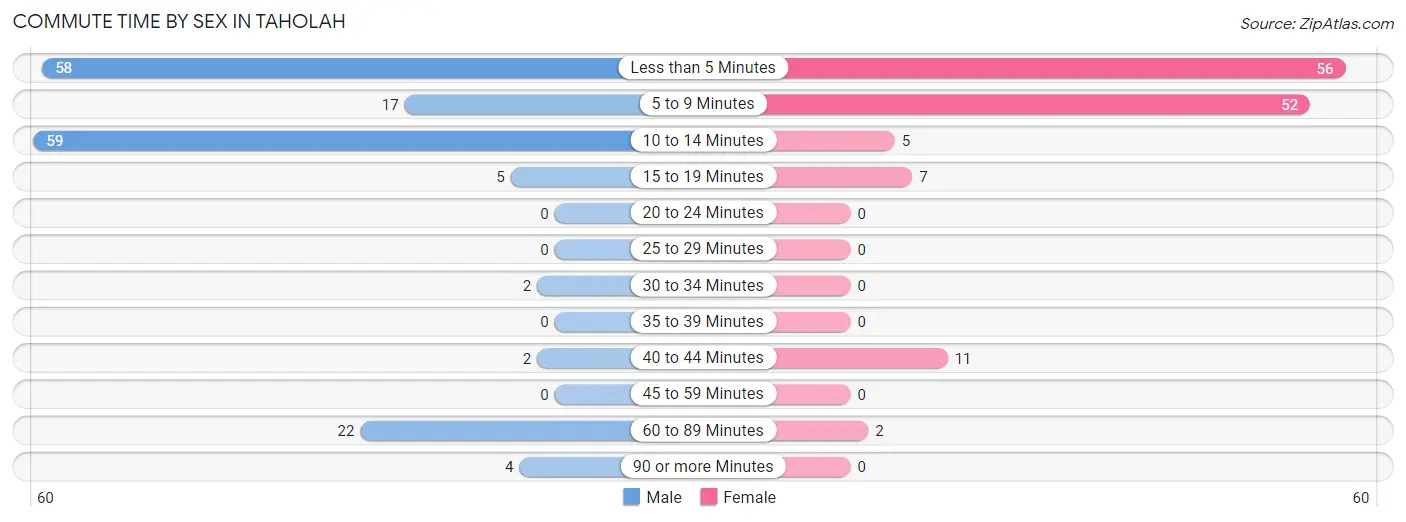
| Commute Time | Male | Female |
| Less than 5 Minutes | 58 (34.3%) | 56 (42.1%) |
| 5 to 9 Minutes | 17 (10.1%) | 52 (39.1%) |
| 10 to 14 Minutes | 59 (34.9%) | 5 (3.8%) |
| 15 to 19 Minutes | 5 (3.0%) | 7 (5.3%) |
| 20 to 24 Minutes | 0 (0.0%) | 0 (0.0%) |
| 25 to 29 Minutes | 0 (0.0%) | 0 (0.0%) |
| 30 to 34 Minutes | 2 (1.2%) | 0 (0.0%) |
| 35 to 39 Minutes | 0 (0.0%) | 0 (0.0%) |
| 40 to 44 Minutes | 2 (1.2%) | 11 (8.3%) |
| 45 to 59 Minutes | 0 (0.0%) | 0 (0.0%) |
| 60 to 89 Minutes | 22 (13.0%) | 2 (1.5%) |
| 90 or more Minutes | 4 (2.4%) | 0 (0.0%) |
Time of Departure to Work by Sex in Taholah
The most frequent times of departure to work in Taholah are 7:30 AM to 7:59 AM (104, 61.5%) for males and 7:30 AM to 7:59 AM (51, 38.4%) for females.
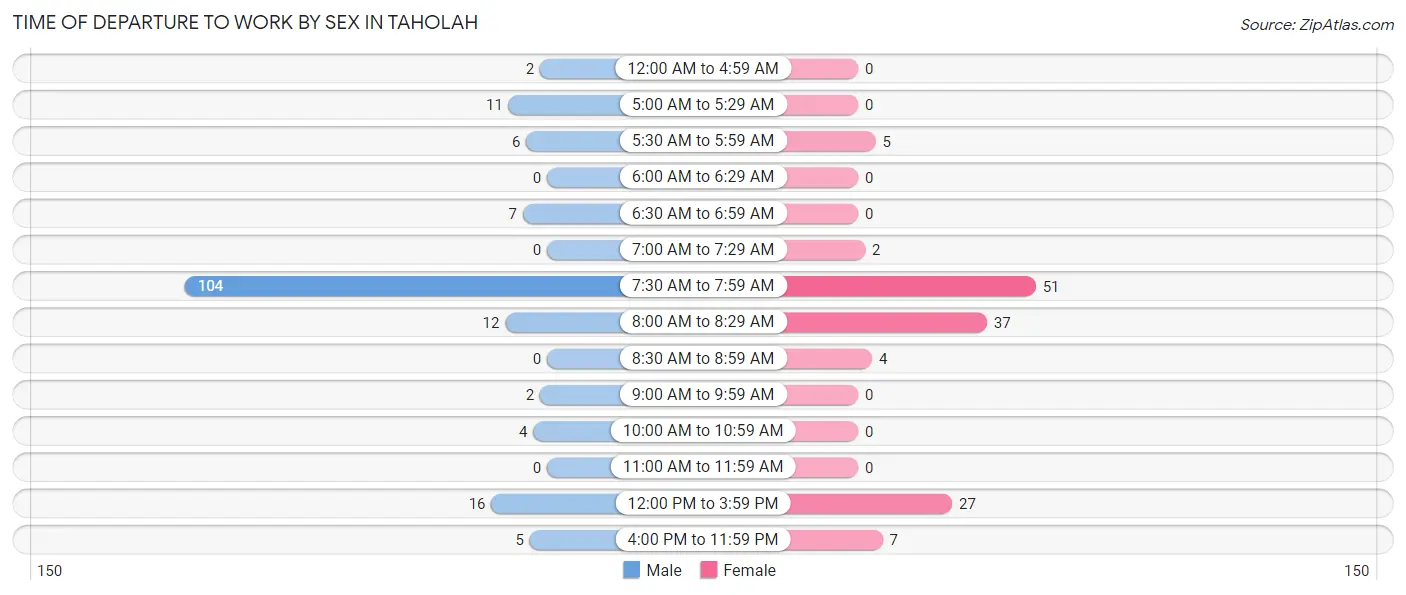
| Time of Departure | Male | Female |
| 12:00 AM to 4:59 AM | 2 (1.2%) | 0 (0.0%) |
| 5:00 AM to 5:29 AM | 11 (6.5%) | 0 (0.0%) |
| 5:30 AM to 5:59 AM | 6 (3.5%) | 5 (3.8%) |
| 6:00 AM to 6:29 AM | 0 (0.0%) | 0 (0.0%) |
| 6:30 AM to 6:59 AM | 7 (4.1%) | 0 (0.0%) |
| 7:00 AM to 7:29 AM | 0 (0.0%) | 2 (1.5%) |
| 7:30 AM to 7:59 AM | 104 (61.5%) | 51 (38.4%) |
| 8:00 AM to 8:29 AM | 12 (7.1%) | 37 (27.8%) |
| 8:30 AM to 8:59 AM | 0 (0.0%) | 4 (3.0%) |
| 9:00 AM to 9:59 AM | 2 (1.2%) | 0 (0.0%) |
| 10:00 AM to 10:59 AM | 4 (2.4%) | 0 (0.0%) |
| 11:00 AM to 11:59 AM | 0 (0.0%) | 0 (0.0%) |
| 12:00 PM to 3:59 PM | 16 (9.5%) | 27 (20.3%) |
| 4:00 PM to 11:59 PM | 5 (3.0%) | 7 (5.3%) |
| Total | 169 (100.0%) | 133 (100.0%) |
Housing Occupancy in Taholah
Occupancy by Ownership in Taholah
Of the total 257 dwellings in Taholah, owner-occupied units account for 202 (78.6%), while renter-occupied units make up 55 (21.4%).
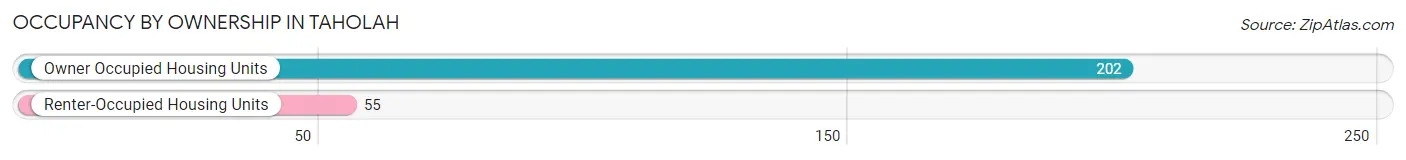
| Occupancy | # Housing Units | % Housing Units |
| Owner Occupied Housing Units | 202 | 78.6% |
| Renter-Occupied Housing Units | 55 | 21.4% |
| Total Occupied Housing Units | 257 | 100.0% |
Occupancy by Household Size in Taholah
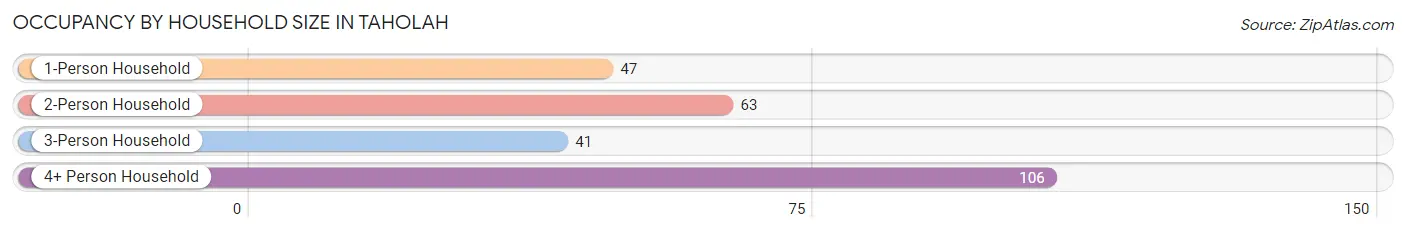
| Household Size | # Housing Units | % Housing Units |
| 1-Person Household | 47 | 18.3% |
| 2-Person Household | 63 | 24.5% |
| 3-Person Household | 41 | 16.0% |
| 4+ Person Household | 106 | 41.2% |
| Total Housing Units | 257 | 100.0% |
Occupancy by Ownership by Household Size in Taholah
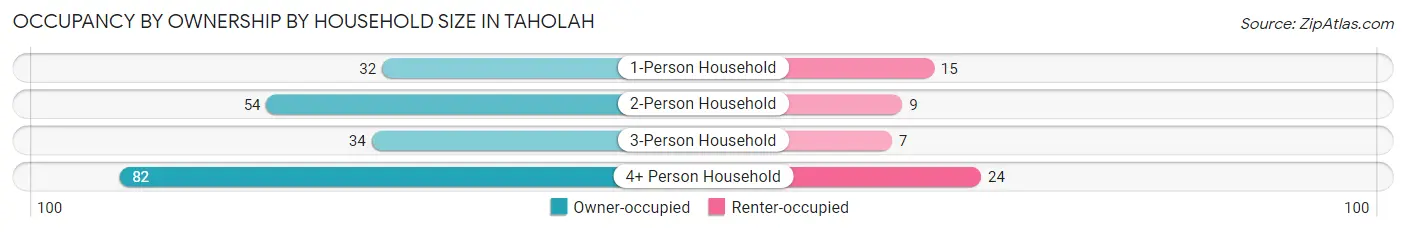
| Household Size | Owner-occupied | Renter-occupied |
| 1-Person Household | 32 (68.1%) | 15 (31.9%) |
| 2-Person Household | 54 (85.7%) | 9 (14.3%) |
| 3-Person Household | 34 (82.9%) | 7 (17.1%) |
| 4+ Person Household | 82 (77.4%) | 24 (22.6%) |
| Total Housing Units | 202 (78.6%) | 55 (21.4%) |
Occupancy by Educational Attainment in Taholah
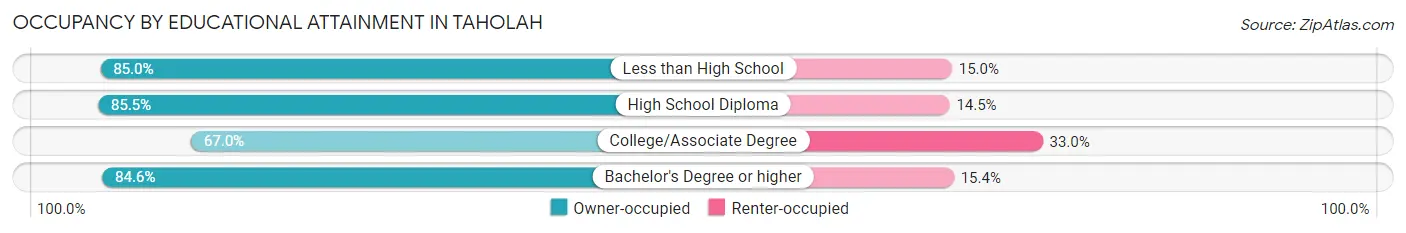
| Household Size | Owner-occupied | Renter-occupied |
| Less than High School | 17 (85.0%) | 3 (15.0%) |
| High School Diploma | 100 (85.5%) | 17 (14.5%) |
| College/Associate Degree | 63 (67.0%) | 31 (33.0%) |
| Bachelor's Degree or higher | 22 (84.6%) | 4 (15.4%) |
Occupancy by Age of Householder in Taholah
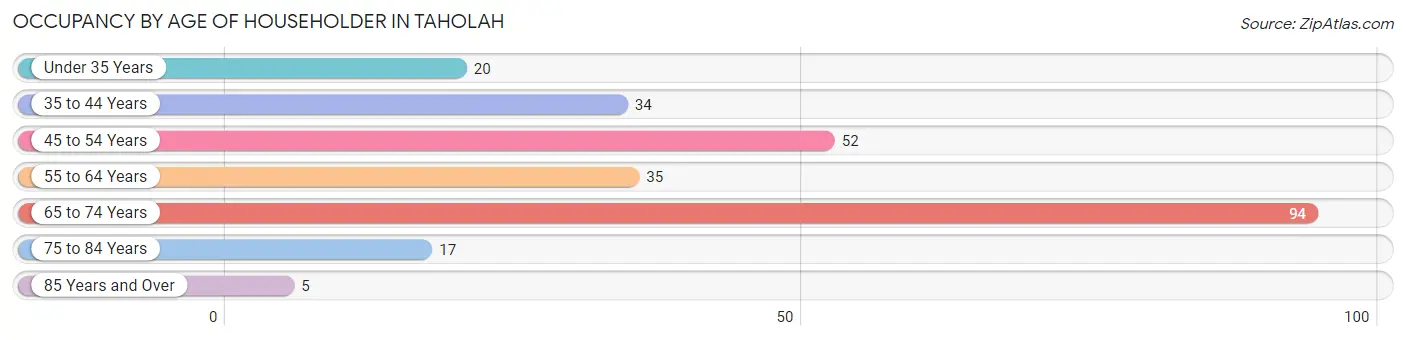
| Age Bracket | # Households | % Households |
| Under 35 Years | 20 | 7.8% |
| 35 to 44 Years | 34 | 13.2% |
| 45 to 54 Years | 52 | 20.2% |
| 55 to 64 Years | 35 | 13.6% |
| 65 to 74 Years | 94 | 36.6% |
| 75 to 84 Years | 17 | 6.6% |
| 85 Years and Over | 5 | 1.9% |
| Total | 257 | 100.0% |
Housing Finances in Taholah
Median Income by Occupancy in Taholah
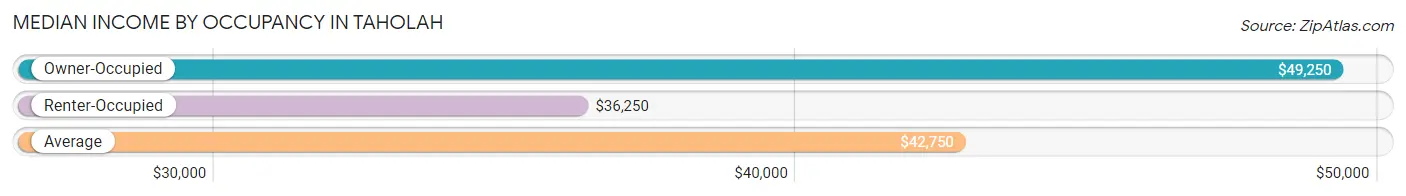
| Occupancy Type | # Households | Median Income |
| Owner-Occupied | 202 (78.6%) | $49,250 |
| Renter-Occupied | 55 (21.4%) | $36,250 |
| Average | 257 (100.0%) | $42,750 |
Occupancy by Householder Income Bracket in Taholah
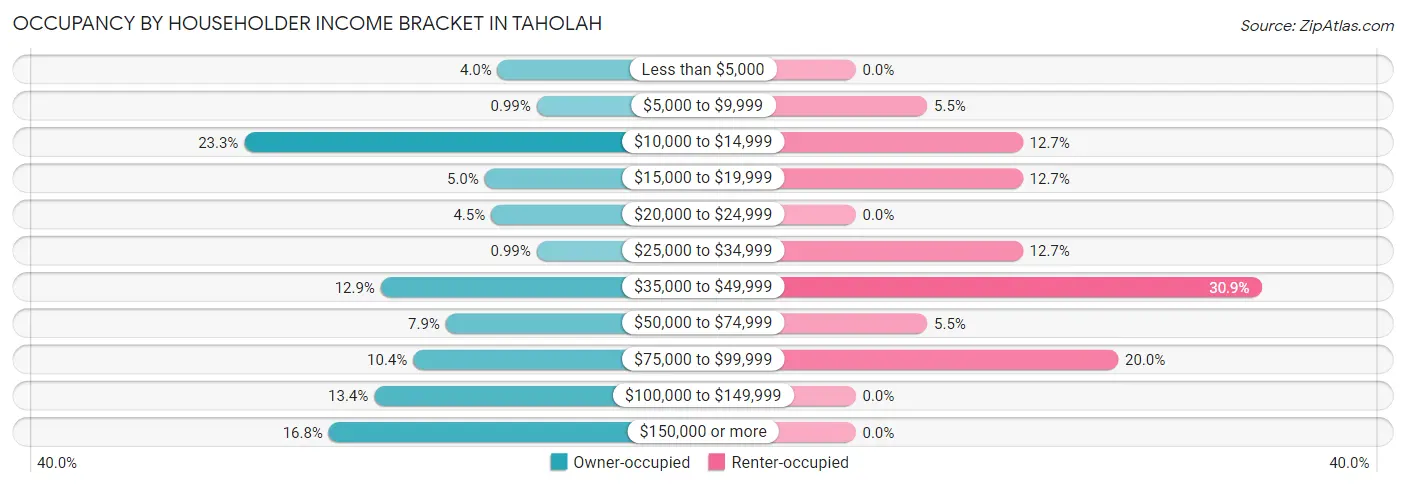
| Income Bracket | Owner-occupied | Renter-occupied |
| Less than $5,000 | 8 (4.0%) | 0 (0.0%) |
| $5,000 to $9,999 | 2 (1.0%) | 3 (5.4%) |
| $10,000 to $14,999 | 47 (23.3%) | 7 (12.7%) |
| $15,000 to $19,999 | 10 (5.0%) | 7 (12.7%) |
| $20,000 to $24,999 | 9 (4.5%) | 0 (0.0%) |
| $25,000 to $34,999 | 2 (1.0%) | 7 (12.7%) |
| $35,000 to $49,999 | 26 (12.9%) | 17 (30.9%) |
| $50,000 to $74,999 | 16 (7.9%) | 3 (5.4%) |
| $75,000 to $99,999 | 21 (10.4%) | 11 (20.0%) |
| $100,000 to $149,999 | 27 (13.4%) | 0 (0.0%) |
| $150,000 or more | 34 (16.8%) | 0 (0.0%) |
| Total | 202 (100.0%) | 55 (100.0%) |
Monthly Housing Cost Tiers in Taholah
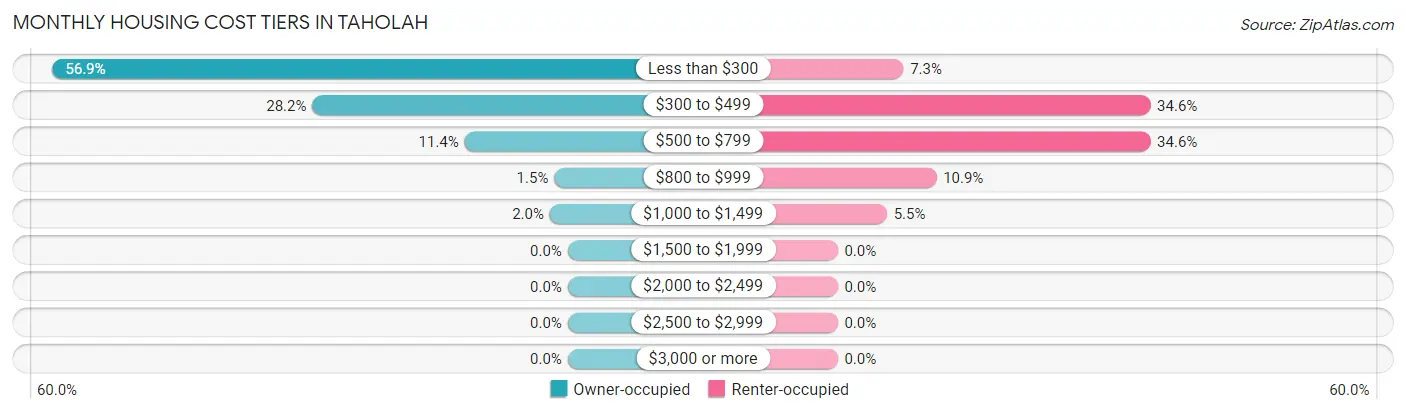
| Monthly Cost | Owner-occupied | Renter-occupied |
| Less than $300 | 115 (56.9%) | 4 (7.3%) |
| $300 to $499 | 57 (28.2%) | 19 (34.5%) |
| $500 to $799 | 23 (11.4%) | 19 (34.5%) |
| $800 to $999 | 3 (1.5%) | 6 (10.9%) |
| $1,000 to $1,499 | 4 (2.0%) | 3 (5.4%) |
| $1,500 to $1,999 | 0 (0.0%) | 0 (0.0%) |
| $2,000 to $2,499 | 0 (0.0%) | 0 (0.0%) |
| $2,500 to $2,999 | 0 (0.0%) | 0 (0.0%) |
| $3,000 or more | 0 (0.0%) | 0 (0.0%) |
| Total | 202 (100.0%) | 55 (100.0%) |
Physical Housing Characteristics in Taholah
Housing Structures in Taholah
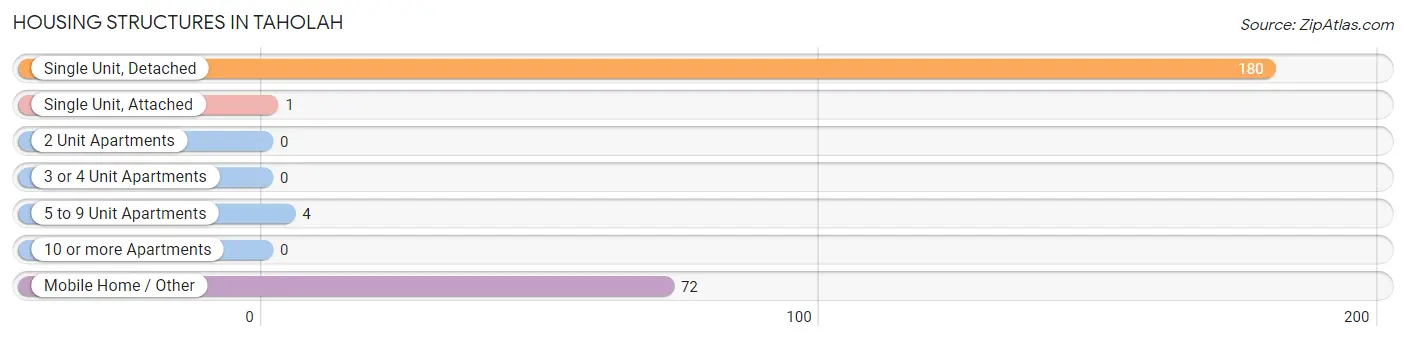
| Structure Type | # Housing Units | % Housing Units |
| Single Unit, Detached | 180 | 70.0% |
| Single Unit, Attached | 1 | 0.4% |
| 2 Unit Apartments | 0 | 0.0% |
| 3 or 4 Unit Apartments | 0 | 0.0% |
| 5 to 9 Unit Apartments | 4 | 1.6% |
| 10 or more Apartments | 0 | 0.0% |
| Mobile Home / Other | 72 | 28.0% |
| Total | 257 | 100.0% |
Housing Structures by Occupancy in Taholah
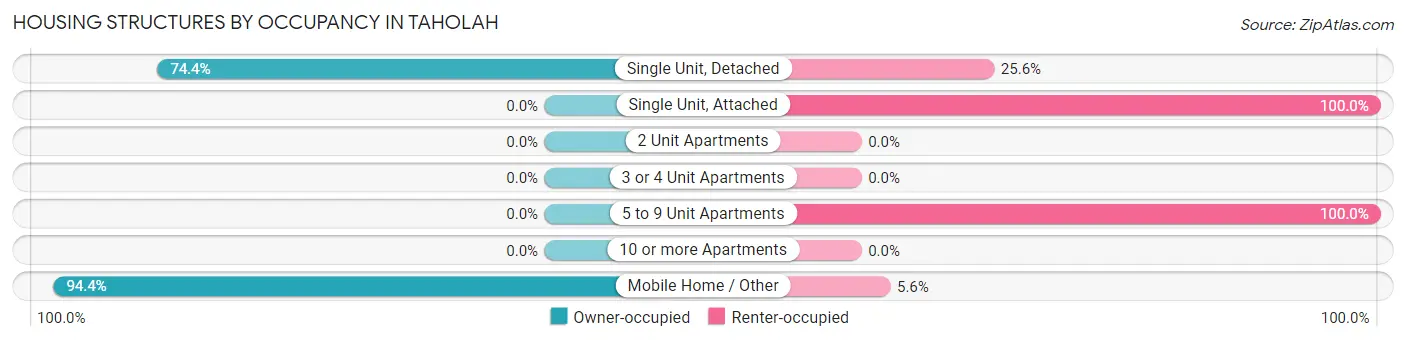
| Structure Type | Owner-occupied | Renter-occupied |
| Single Unit, Detached | 134 (74.4%) | 46 (25.6%) |
| Single Unit, Attached | 0 (0.0%) | 1 (100.0%) |
| 2 Unit Apartments | 0 (0.0%) | 0 (0.0%) |
| 3 or 4 Unit Apartments | 0 (0.0%) | 0 (0.0%) |
| 5 to 9 Unit Apartments | 0 (0.0%) | 4 (100.0%) |
| 10 or more Apartments | 0 (0.0%) | 0 (0.0%) |
| Mobile Home / Other | 68 (94.4%) | 4 (5.6%) |
| Total | 202 (78.6%) | 55 (21.4%) |
Housing Structures by Number of Rooms in Taholah
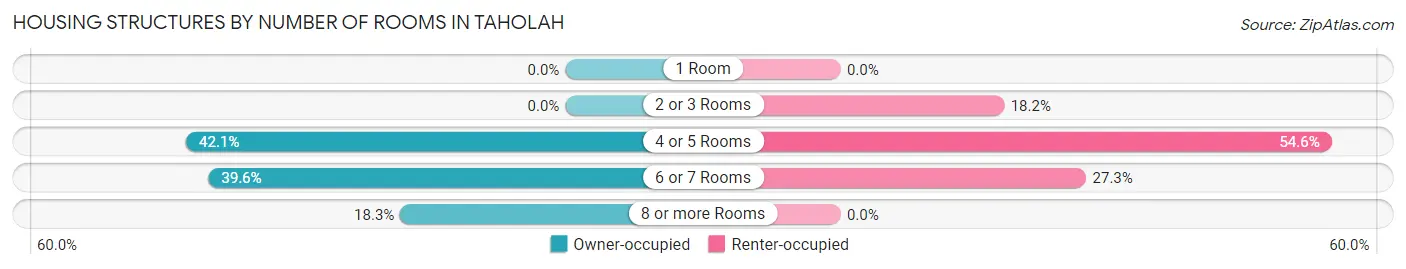
| Number of Rooms | Owner-occupied | Renter-occupied |
| 1 Room | 0 (0.0%) | 0 (0.0%) |
| 2 or 3 Rooms | 0 (0.0%) | 10 (18.2%) |
| 4 or 5 Rooms | 85 (42.1%) | 30 (54.5%) |
| 6 or 7 Rooms | 80 (39.6%) | 15 (27.3%) |
| 8 or more Rooms | 37 (18.3%) | 0 (0.0%) |
| Total | 202 (100.0%) | 55 (100.0%) |
Housing Structure by Heating Type in Taholah
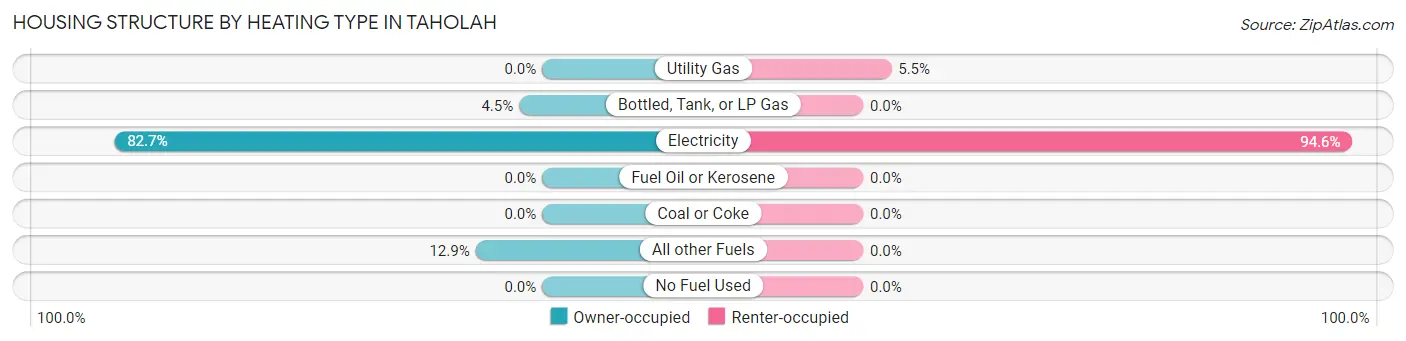
| Heating Type | Owner-occupied | Renter-occupied |
| Utility Gas | 0 (0.0%) | 3 (5.4%) |
| Bottled, Tank, or LP Gas | 9 (4.5%) | 0 (0.0%) |
| Electricity | 167 (82.7%) | 52 (94.6%) |
| Fuel Oil or Kerosene | 0 (0.0%) | 0 (0.0%) |
| Coal or Coke | 0 (0.0%) | 0 (0.0%) |
| All other Fuels | 26 (12.9%) | 0 (0.0%) |
| No Fuel Used | 0 (0.0%) | 0 (0.0%) |
| Total | 202 (100.0%) | 55 (100.0%) |
Household Vehicle Usage in Taholah
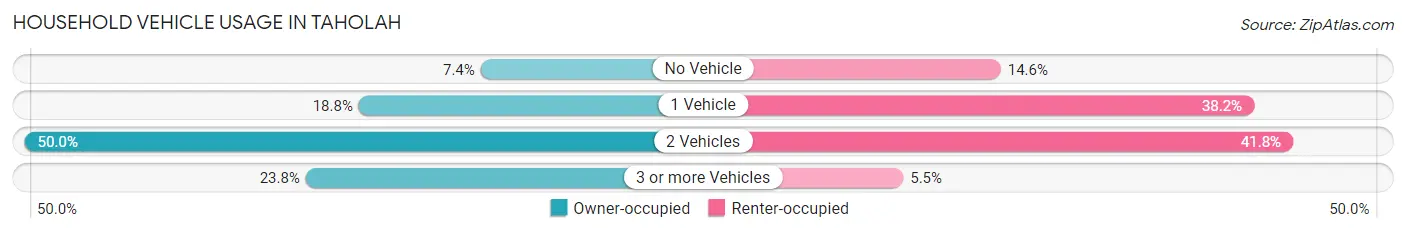
| Vehicles per Household | Owner-occupied | Renter-occupied |
| No Vehicle | 15 (7.4%) | 8 (14.5%) |
| 1 Vehicle | 38 (18.8%) | 21 (38.2%) |
| 2 Vehicles | 101 (50.0%) | 23 (41.8%) |
| 3 or more Vehicles | 48 (23.8%) | 3 (5.4%) |
| Total | 202 (100.0%) | 55 (100.0%) |
Real Estate & Mortgages in Taholah
Real Estate and Mortgage Overview in Taholah
| Characteristic | Without Mortgage | With Mortgage |
| Housing Units | 174 | 28 |
| Median Property Value | - | - |
| Median Household Income | $55,417 | $3 |
| Monthly Housing Costs | $234 | $0 |
| Real Estate Taxes | - | - |
Property Value by Mortgage Status in Taholah
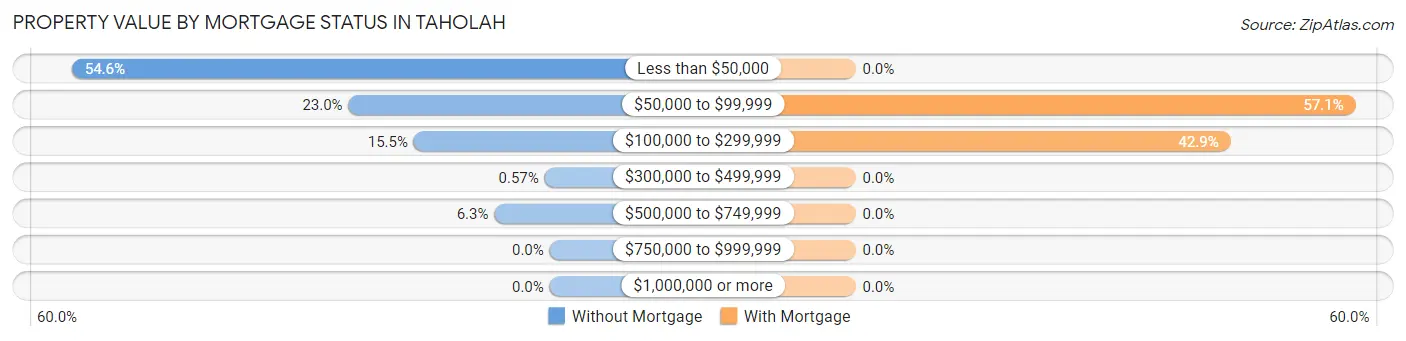
| Property Value | Without Mortgage | With Mortgage |
| Less than $50,000 | 95 (54.6%) | 0 (0.0%) |
| $50,000 to $99,999 | 40 (23.0%) | 16 (57.1%) |
| $100,000 to $299,999 | 27 (15.5%) | 12 (42.9%) |
| $300,000 to $499,999 | 1 (0.6%) | 0 (0.0%) |
| $500,000 to $749,999 | 11 (6.3%) | 0 (0.0%) |
| $750,000 to $999,999 | 0 (0.0%) | 0 (0.0%) |
| $1,000,000 or more | 0 (0.0%) | 0 (0.0%) |
| Total | 174 (100.0%) | 28 (100.0%) |
Household Income by Mortgage Status in Taholah
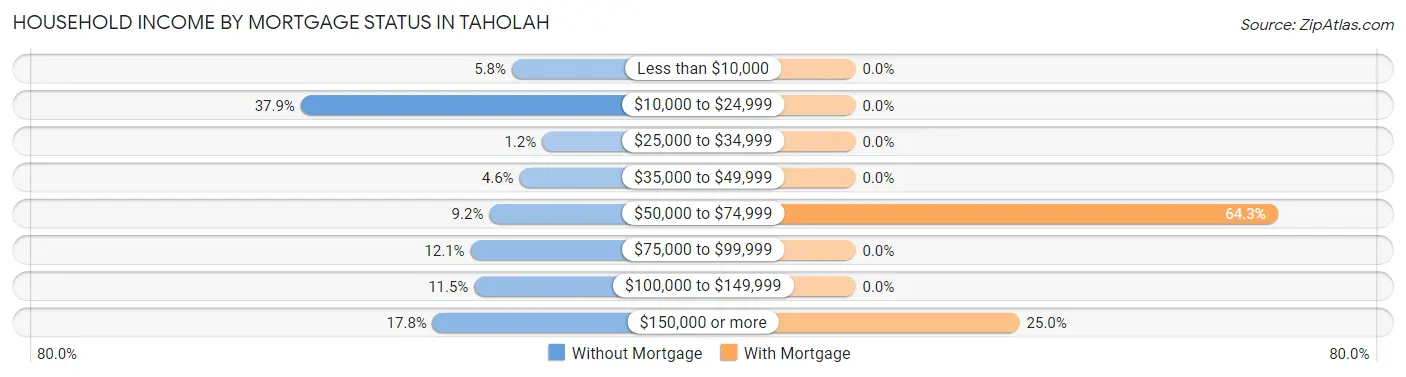
| Household Income | Without Mortgage | With Mortgage |
| Less than $10,000 | 10 (5.8%) | 0 (0.0%) |
| $10,000 to $24,999 | 66 (37.9%) | 0 (0.0%) |
| $25,000 to $34,999 | 2 (1.1%) | 0 (0.0%) |
| $35,000 to $49,999 | 8 (4.6%) | 0 (0.0%) |
| $50,000 to $74,999 | 16 (9.2%) | 18 (64.3%) |
| $75,000 to $99,999 | 21 (12.1%) | 0 (0.0%) |
| $100,000 to $149,999 | 20 (11.5%) | 0 (0.0%) |
| $150,000 or more | 31 (17.8%) | 7 (25.0%) |
| Total | 174 (100.0%) | 28 (100.0%) |
Property Value to Household Income Ratio in Taholah
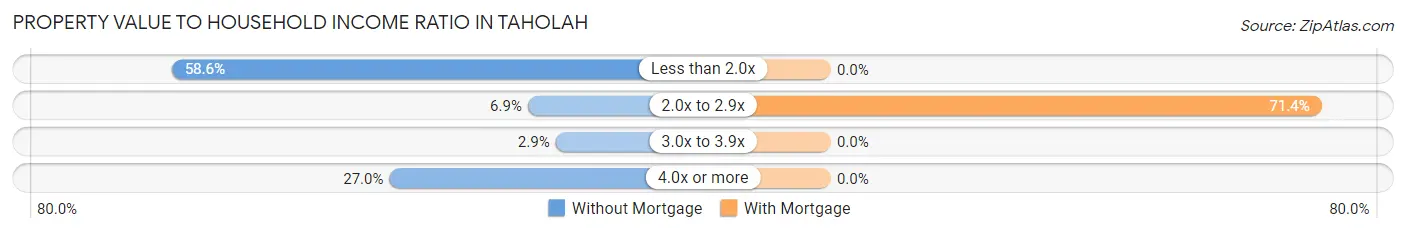
| Value-to-Income Ratio | Without Mortgage | With Mortgage |
| Less than 2.0x | 102 (58.6%) | 0 (0.0%) |
| 2.0x to 2.9x | 12 (6.9%) | 20 (71.4%) |
| 3.0x to 3.9x | 5 (2.9%) | 0 (0.0%) |
| 4.0x or more | 47 (27.0%) | 0 (0.0%) |
| Total | 174 (100.0%) | 28 (100.0%) |
Real Estate Taxes by Mortgage Status in Taholah
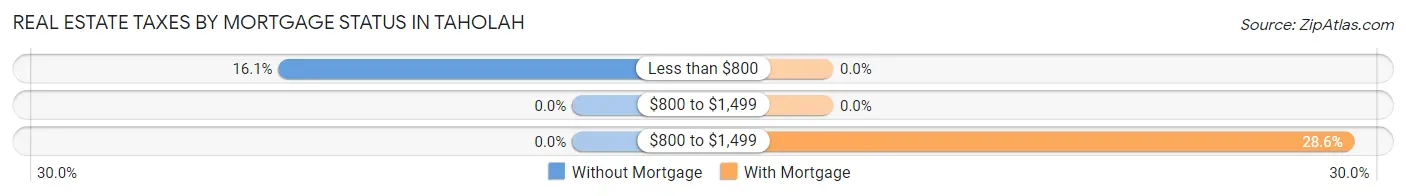
| Property Taxes | Without Mortgage | With Mortgage |
| Less than $800 | 28 (16.1%) | 0 (0.0%) |
| $800 to $1,499 | 0 (0.0%) | 0 (0.0%) |
| $800 to $1,499 | 0 (0.0%) | 8 (28.6%) |
| Total | 174 (100.0%) | 28 (100.0%) |
Health & Disability in Taholah
Health Insurance Coverage by Age in Taholah
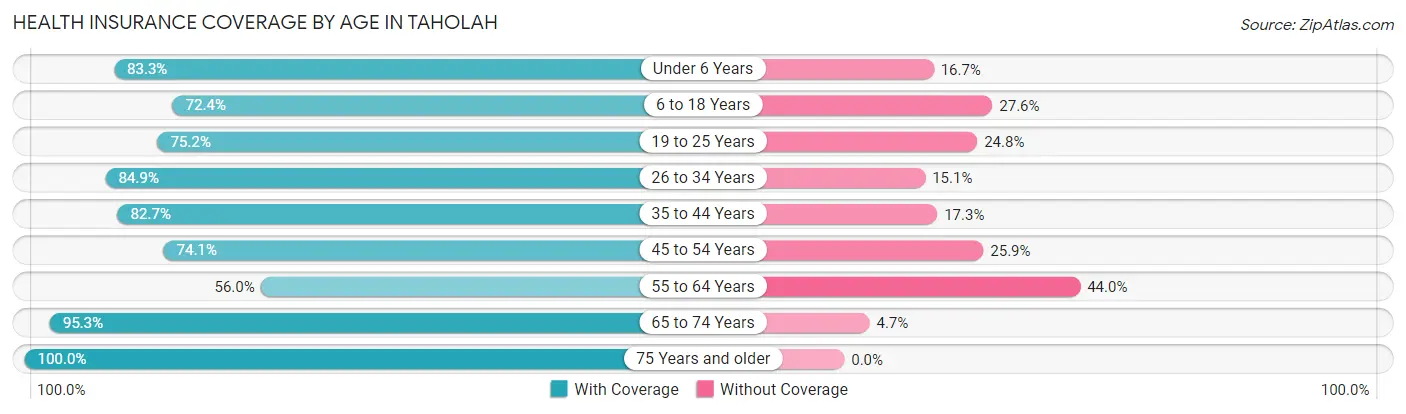
| Age Bracket | With Coverage | Without Coverage |
| Under 6 Years | 45 (83.3%) | 9 (16.7%) |
| 6 to 18 Years | 118 (72.4%) | 45 (27.6%) |
| 19 to 25 Years | 91 (75.2%) | 30 (24.8%) |
| 26 to 34 Years | 45 (84.9%) | 8 (15.1%) |
| 35 to 44 Years | 62 (82.7%) | 13 (17.3%) |
| 45 to 54 Years | 60 (74.1%) | 21 (25.9%) |
| 55 to 64 Years | 42 (56.0%) | 33 (44.0%) |
| 65 to 74 Years | 162 (95.3%) | 8 (4.7%) |
| 75 Years and older | 26 (100.0%) | 0 (0.0%) |
| Total | 651 (79.6%) | 167 (20.4%) |
Health Insurance Coverage by Citizenship Status in Taholah
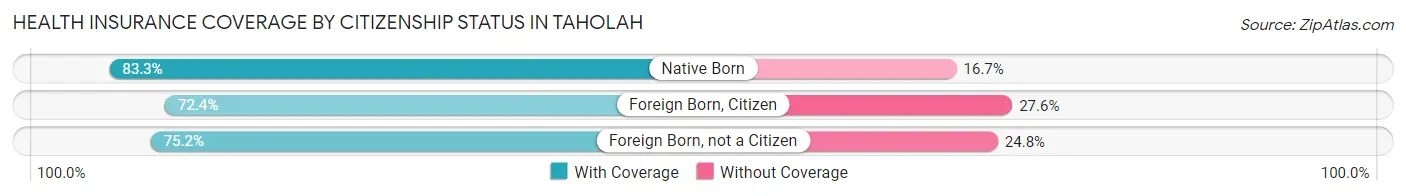
| Citizenship Status | With Coverage | Without Coverage |
| Native Born | 45 (83.3%) | 9 (16.7%) |
| Foreign Born, Citizen | 118 (72.4%) | 45 (27.6%) |
| Foreign Born, not a Citizen | 91 (75.2%) | 30 (24.8%) |
Health Insurance Coverage by Household Income in Taholah
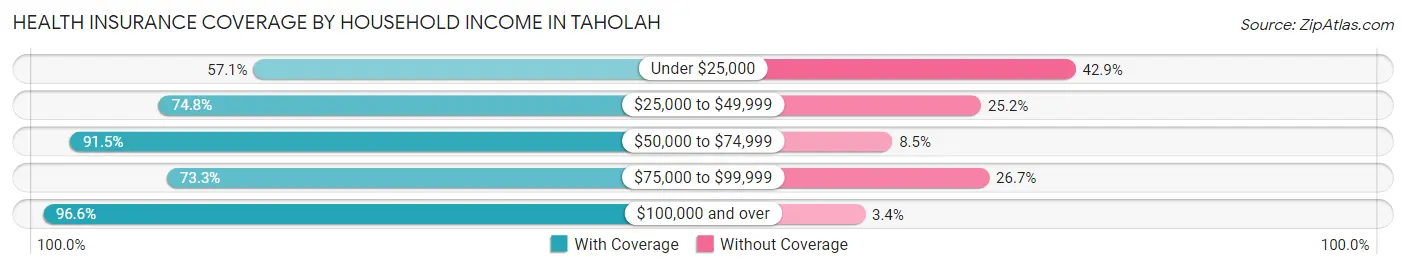
| Household Income | With Coverage | Without Coverage |
| Under $25,000 | 104 (57.1%) | 78 (42.9%) |
| $25,000 to $49,999 | 119 (74.8%) | 40 (25.2%) |
| $50,000 to $74,999 | 86 (91.5%) | 8 (8.5%) |
| $75,000 to $99,999 | 88 (73.3%) | 32 (26.7%) |
| $100,000 and over | 254 (96.6%) | 9 (3.4%) |
Public vs Private Health Insurance Coverage by Age in Taholah
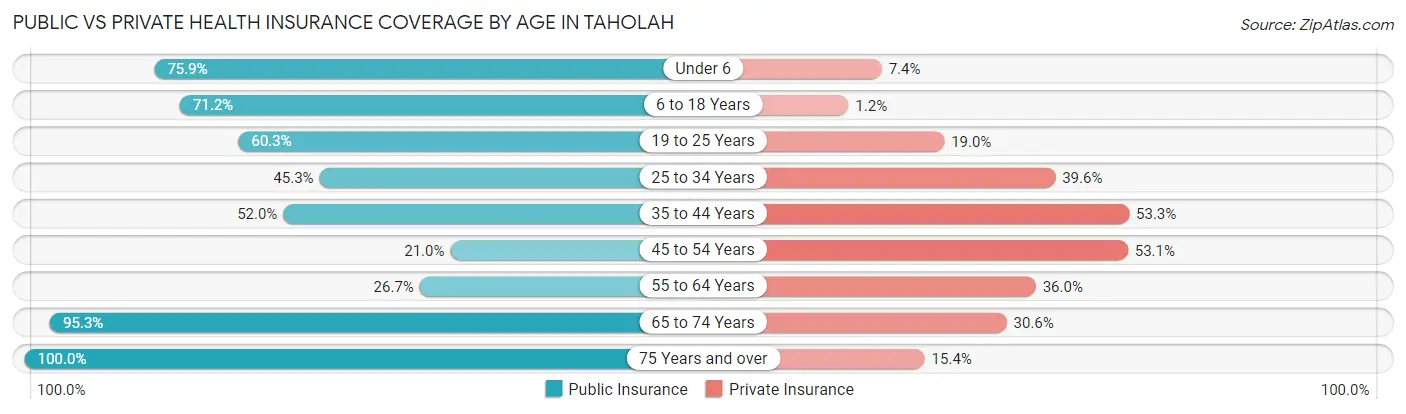
| Age Bracket | Public Insurance | Private Insurance |
| Under 6 | 41 (75.9%) | 4 (7.4%) |
| 6 to 18 Years | 116 (71.2%) | 2 (1.2%) |
| 19 to 25 Years | 73 (60.3%) | 23 (19.0%) |
| 25 to 34 Years | 24 (45.3%) | 21 (39.6%) |
| 35 to 44 Years | 39 (52.0%) | 40 (53.3%) |
| 45 to 54 Years | 17 (21.0%) | 43 (53.1%) |
| 55 to 64 Years | 20 (26.7%) | 27 (36.0%) |
| 65 to 74 Years | 162 (95.3%) | 52 (30.6%) |
| 75 Years and over | 26 (100.0%) | 4 (15.4%) |
| Total | 518 (63.3%) | 216 (26.4%) |
Disability Status by Sex by Age in Taholah
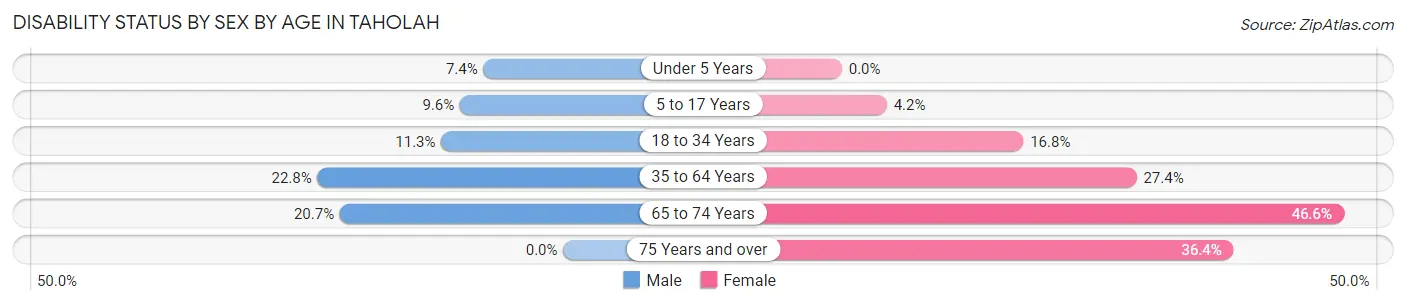
| Age Bracket | Male | Female |
| Under 5 Years | 2 (7.4%) | 0 (0.0%) |
| 5 to 17 Years | 7 (9.6%) | 3 (4.2%) |
| 18 to 34 Years | 12 (11.3%) | 16 (16.8%) |
| 35 to 64 Years | 26 (22.8%) | 32 (27.4%) |
| 65 to 74 Years | 17 (20.7%) | 41 (46.6%) |
| 75 Years and over | 0 (0.0%) | 8 (36.4%) |
Disability Class by Sex by Age in Taholah
Disability Class: Hearing Difficulty
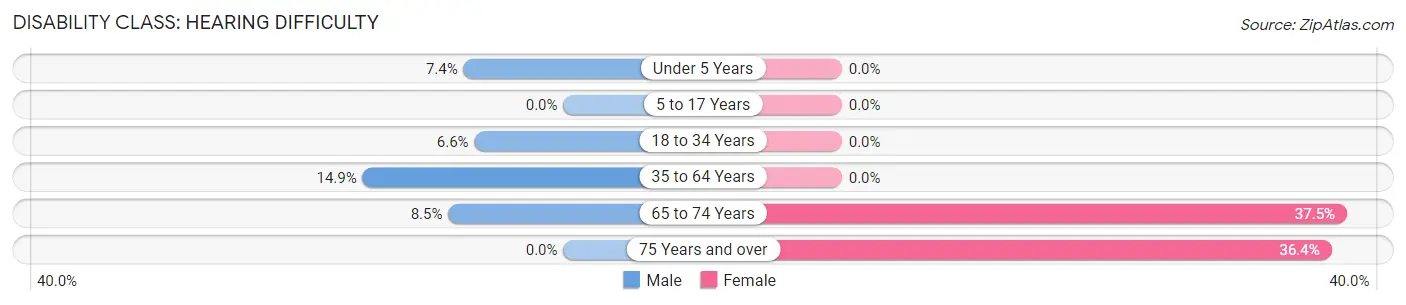
| Age Bracket | Male | Female |
| Under 5 Years | 2 (7.4%) | 0 (0.0%) |
| 5 to 17 Years | 0 (0.0%) | 0 (0.0%) |
| 18 to 34 Years | 7 (6.6%) | 0 (0.0%) |
| 35 to 64 Years | 17 (14.9%) | 0 (0.0%) |
| 65 to 74 Years | 7 (8.5%) | 33 (37.5%) |
| 75 Years and over | 0 (0.0%) | 8 (36.4%) |
Disability Class: Vision Difficulty
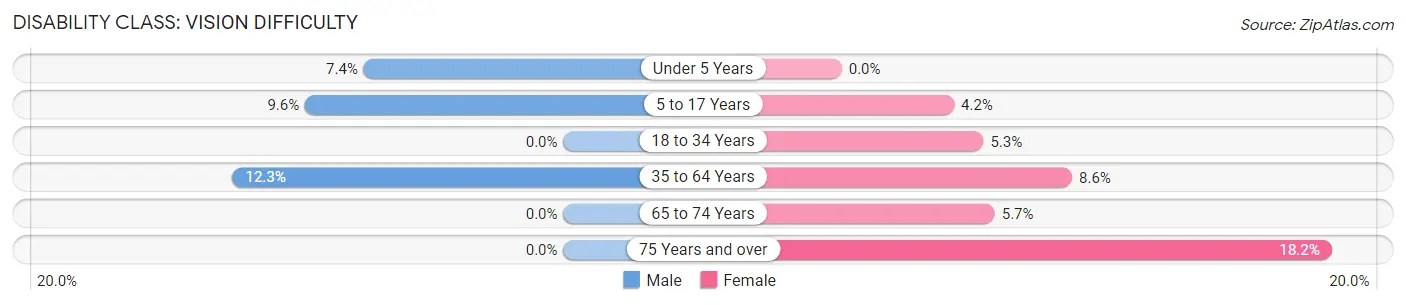
| Age Bracket | Male | Female |
| Under 5 Years | 2 (7.4%) | 0 (0.0%) |
| 5 to 17 Years | 7 (9.6%) | 3 (4.2%) |
| 18 to 34 Years | 0 (0.0%) | 5 (5.3%) |
| 35 to 64 Years | 14 (12.3%) | 10 (8.6%) |
| 65 to 74 Years | 0 (0.0%) | 5 (5.7%) |
| 75 Years and over | 0 (0.0%) | 4 (18.2%) |
Disability Class: Cognitive Difficulty
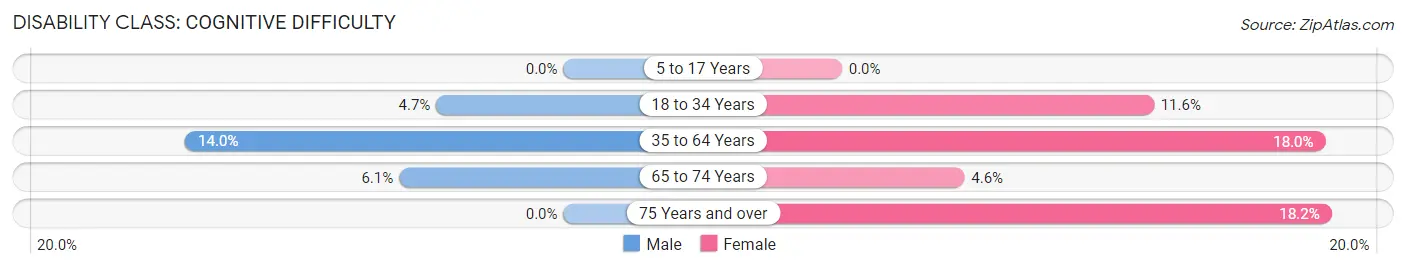
| Age Bracket | Male | Female |
| 5 to 17 Years | 0 (0.0%) | 0 (0.0%) |
| 18 to 34 Years | 5 (4.7%) | 11 (11.6%) |
| 35 to 64 Years | 16 (14.0%) | 21 (17.9%) |
| 65 to 74 Years | 5 (6.1%) | 4 (4.5%) |
| 75 Years and over | 0 (0.0%) | 4 (18.2%) |
Disability Class: Ambulatory Difficulty
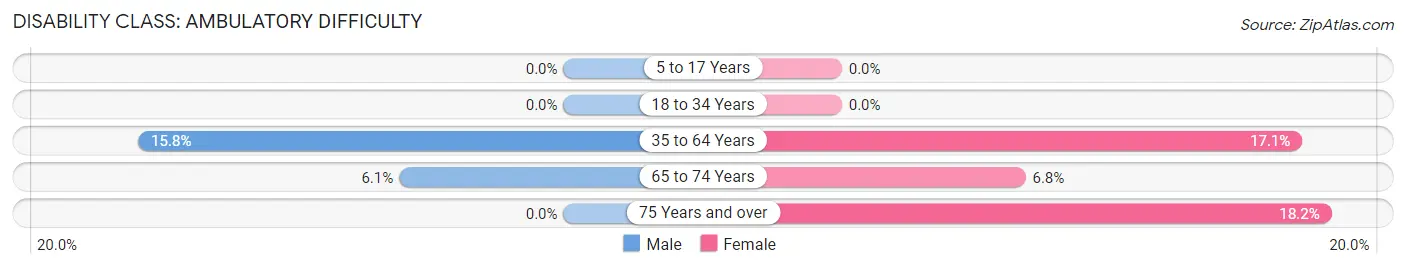
| Age Bracket | Male | Female |
| 5 to 17 Years | 0 (0.0%) | 0 (0.0%) |
| 18 to 34 Years | 0 (0.0%) | 0 (0.0%) |
| 35 to 64 Years | 18 (15.8%) | 20 (17.1%) |
| 65 to 74 Years | 5 (6.1%) | 6 (6.8%) |
| 75 Years and over | 0 (0.0%) | 4 (18.2%) |
Disability Class: Self-Care Difficulty
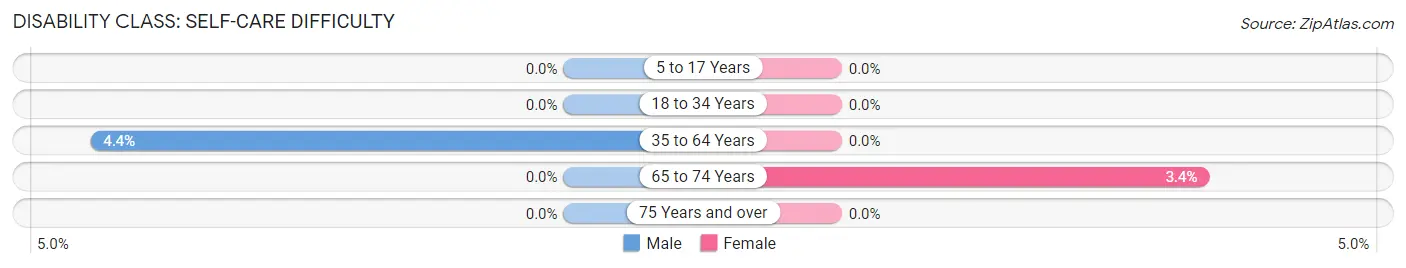
| Age Bracket | Male | Female |
| 5 to 17 Years | 0 (0.0%) | 0 (0.0%) |
| 18 to 34 Years | 0 (0.0%) | 0 (0.0%) |
| 35 to 64 Years | 5 (4.4%) | 0 (0.0%) |
| 65 to 74 Years | 0 (0.0%) | 3 (3.4%) |
| 75 Years and over | 0 (0.0%) | 0 (0.0%) |
Technology Access in Taholah
Computing Device Access in Taholah
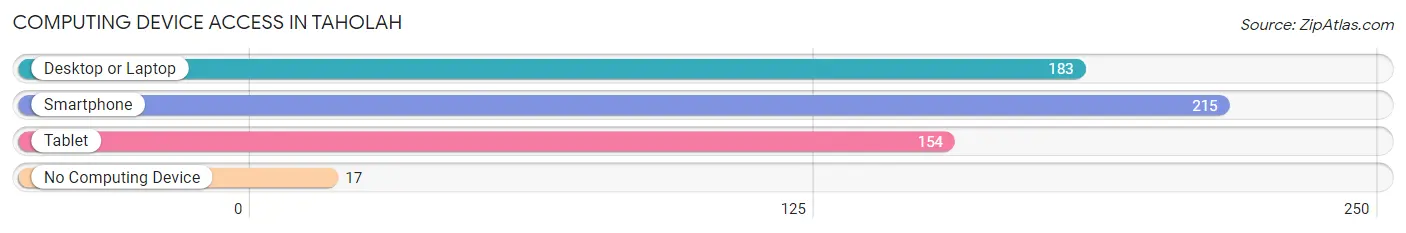
| Device Type | # Households | % Households |
| Desktop or Laptop | 183 | 71.2% |
| Smartphone | 215 | 83.7% |
| Tablet | 154 | 59.9% |
| No Computing Device | 17 | 6.6% |
| Total | 257 | 100.0% |
Internet Access in Taholah
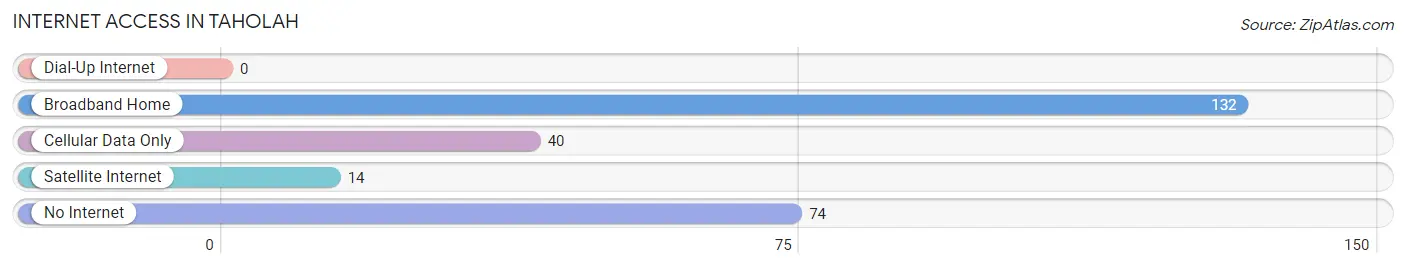
| Internet Type | # Households | % Households |
| Dial-Up Internet | 0 | 0.0% |
| Broadband Home | 132 | 51.4% |
| Cellular Data Only | 40 | 15.6% |
| Satellite Internet | 14 | 5.4% |
| No Internet | 74 | 28.8% |
| Total | 257 | 100.0% |
Taholah Summary
Taholah is a small unincorporated community located in Grays Harbor County, Washington, United States. It is situated on the Quinault Indian Reservation, which is home to the Quinault Indian Nation. The population of Taholah was 590 as of the 2010 census.
History
The Quinault Indian Nation has inhabited the area around Taholah for thousands of years. The Quinault people have a rich cultural history and have been living in the area since time immemorial. The Quinault Indian Reservation was established in 1855 by the Treaty of Olympia. The reservation was originally much larger than it is today, but it was reduced in size in the late 19th century.
Taholah was established in the late 19th century as a trading post for the Quinault people. The town was named after Chief Taholah, a leader of the Quinault people. The town grew slowly over the years and by the early 20th century it had become a small but thriving community.
Geography
Taholah is located in Grays Harbor County, Washington, United States. It is situated on the Quinault Indian Reservation, which is home to the Quinault Indian Nation. The town is located on the Pacific Coast, about 25 miles south of the city of Aberdeen. The town is situated on the Quinault River, which flows into the Pacific Ocean.
The climate in Taholah is mild and temperate. The average temperature in the summer is around 70 degrees Fahrenheit, and the average temperature in the winter is around 40 degrees Fahrenheit. The area receives an average of 40 inches of rain per year.
Economy
The economy of Taholah is largely based on fishing and forestry. The Quinault Indian Nation operates a fish hatchery in the town, which provides jobs for many of the local residents. The Quinault Indian Nation also operates a sawmill and a lumber mill in the town.
The Quinault Indian Nation also operates a casino in the town, which provides jobs and revenue for the local economy. The casino is a popular tourist destination and attracts visitors from all over the region.
Demographics
As of the 2010 census, the population of Taholah was 590. The population is predominantly Native American, with the Quinault Indian Nation making up the majority of the population. The median age of the population is 37.5 years. The median household income is $25,000.
Conclusion
Taholah is a small unincorporated community located in Grays Harbor County, Washington, United States. It is situated on the Quinault Indian Reservation, which is home to the Quinault Indian Nation. The population of Taholah is predominantly Native American, with the Quinault Indian Nation making up the majority of the population. The economy of Taholah is largely based on fishing and forestry. The Quinault Indian Nation operates a fish hatchery, a sawmill, a lumber mill, and a casino in the town. The town is a popular tourist destination and attracts visitors from all over the region.
Common Questions
What is Per Capita Income in Taholah?
Per Capita income in Taholah is $18,781.
What is the Median Family Income in Taholah?
Median Family Income in Taholah is $49,750.
What is the Median Household income in Taholah?
Median Household Income in Taholah is $42,750.
What is Income or Wage Gap in Taholah?
Income or Wage Gap in Taholah is 36.8%.
Women in Taholah earn 63.2 cents for every dollar earned by a man.
What is Inequality or Gini Index in Taholah?
Inequality or Gini Index in Taholah is 0.47.
What is the Total Population of Taholah?
Total Population of Taholah is 823.
What is the Total Male Population of Taholah?
Total Male Population of Taholah is 411.
What is the Total Female Population of Taholah?
Total Female Population of Taholah is 412.
What is the Ratio of Males per 100 Females in Taholah?
There are 99.76 Males per 100 Females in Taholah.
What is the Ratio of Females per 100 Males in Taholah?
There are 100.24 Females per 100 Males in Taholah.
What is the Median Population Age in Taholah?
Median Population Age in Taholah is 36.8 Years.
What is the Average Family Size in Taholah
Average Family Size in Taholah is 3.5 People.
What is the Average Household Size in Taholah
Average Household Size in Taholah is 3.2 People.
How Large is the Labor Force in Taholah?
There are 351 People in the Labor Forcein in Taholah.
What is the Percentage of People in the Labor Force in Taholah?
52.4% of People are in the Labor Force in Taholah.
What is the Unemployment Rate in Taholah?
Unemployment Rate in Taholah is 9.4%.