East Cathlamet, WA Map & Demographics
East Cathlamet Map
East Cathlamet Overview
$31,049
PER CAPITA INCOME
$76,806
AVG FAMILY INCOME
$71,806
AVG HOUSEHOLD INCOME
0.36
INEQUALITY / GINI INDEX
620
TOTAL POPULATION
321
MALE POPULATION
299
FEMALE POPULATION
107.36
MALES / 100 FEMALES
93.15
FEMALES / 100 MALES
54.3
MEDIAN AGE
2.6
AVG FAMILY SIZE
2.1
AVG HOUSEHOLD SIZE
149
LABOR FORCE [ PEOPLE ]
28.5%
PERCENT IN LABOR FORCE
2.7%
UNEMPLOYMENT RATE
Income in East Cathlamet
Income Overview in East Cathlamet
Per Capita Income in East Cathlamet is $31,049, while median incomes of families and households are $76,806 and $71,806 respectively.
| Characteristic | Number | Measure |
| Per Capita Income | 620 | $31,049 |
| Median Family Income | 205 | $76,806 |
| Mean Family Income | 205 | $81,401 |
| Median Household Income | 289 | $71,806 |
| Mean Household Income | 289 | $76,917 |
| Income Deficit | 205 | $0 |
| Wage / Income Gap (%) | 620 | 0.00% |
| Wage / Income Gap ($) | 620 | 100.00¢ per $1 |
| Gini / Inequality Index | 620 | 0.36 |
Earnings by Sex in East Cathlamet
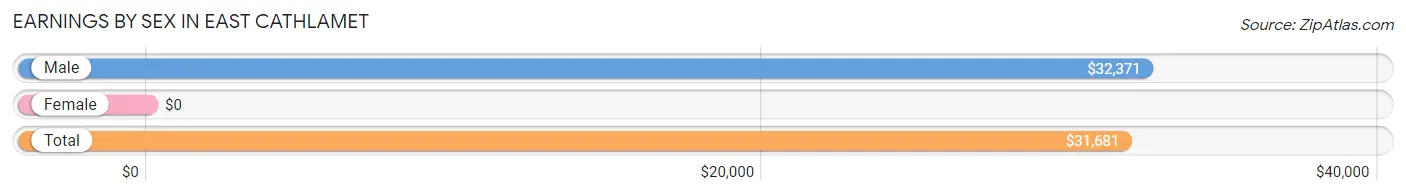
| Sex | Number | Average Earnings |
| Male | 107 (61.9%) | $32,371 |
| Female | 66 (38.2%) | $0 |
| Total | 173 (100.0%) | $31,681 |
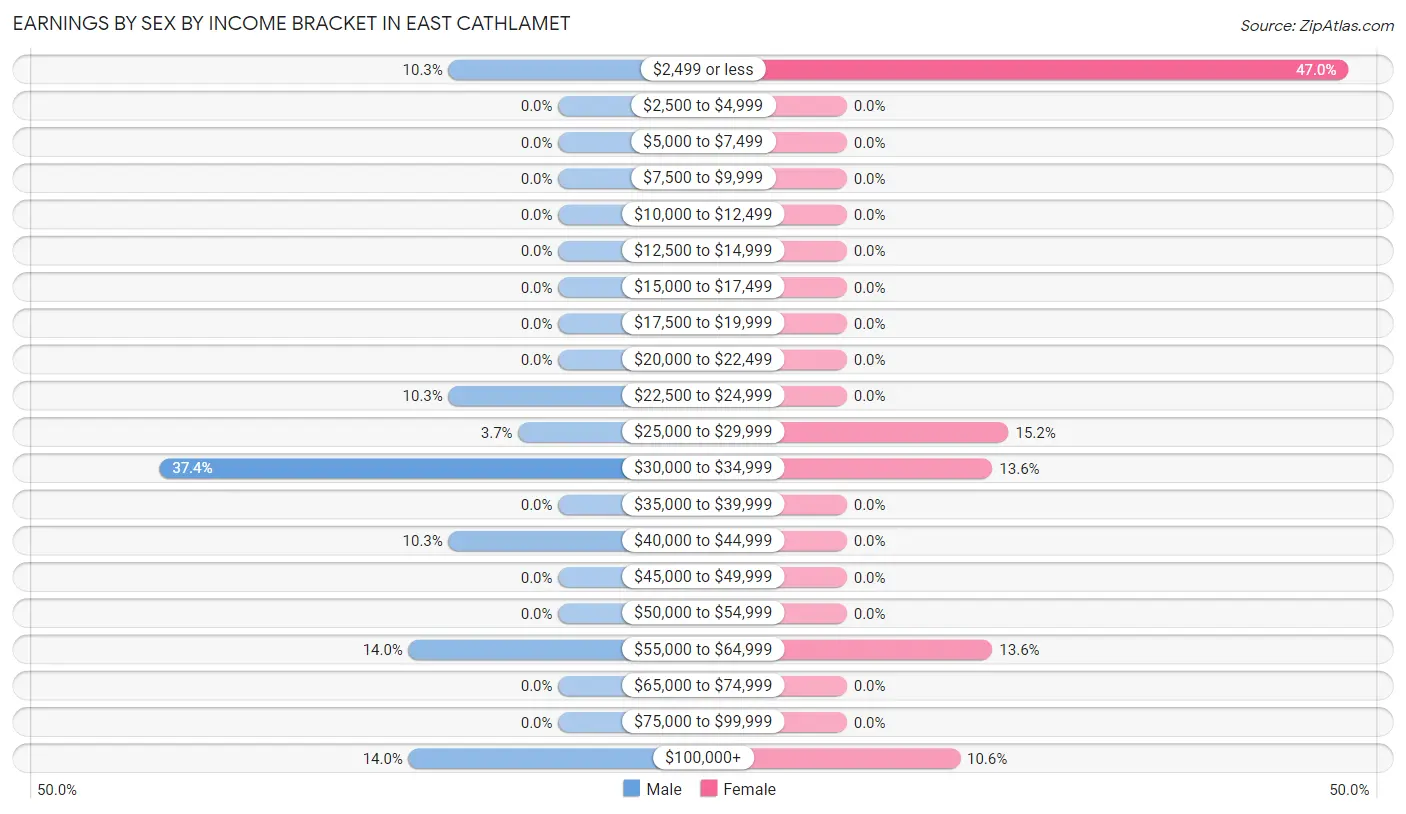
Earnings by Sex by Income Bracket in East Cathlamet
The most common earnings brackets in East Cathlamet are $30,000 to $34,999 for men (40 | 37.4%) and $2,499 or less for women (31 | 47.0%).
| Income | Male | Female |
| $2,499 or less | 11 (10.3%) | 31 (47.0%) |
| $2,500 to $4,999 | 0 (0.0%) | 0 (0.0%) |
| $5,000 to $7,499 | 0 (0.0%) | 0 (0.0%) |
| $7,500 to $9,999 | 0 (0.0%) | 0 (0.0%) |
| $10,000 to $12,499 | 0 (0.0%) | 0 (0.0%) |
| $12,500 to $14,999 | 0 (0.0%) | 0 (0.0%) |
| $15,000 to $17,499 | 0 (0.0%) | 0 (0.0%) |
| $17,500 to $19,999 | 0 (0.0%) | 0 (0.0%) |
| $20,000 to $22,499 | 0 (0.0%) | 0 (0.0%) |
| $22,500 to $24,999 | 11 (10.3%) | 0 (0.0%) |
| $25,000 to $29,999 | 4 (3.7%) | 10 (15.1%) |
| $30,000 to $34,999 | 40 (37.4%) | 9 (13.6%) |
| $35,000 to $39,999 | 0 (0.0%) | 0 (0.0%) |
| $40,000 to $44,999 | 11 (10.3%) | 0 (0.0%) |
| $45,000 to $49,999 | 0 (0.0%) | 0 (0.0%) |
| $50,000 to $54,999 | 0 (0.0%) | 0 (0.0%) |
| $55,000 to $64,999 | 15 (14.0%) | 9 (13.6%) |
| $65,000 to $74,999 | 0 (0.0%) | 0 (0.0%) |
| $75,000 to $99,999 | 0 (0.0%) | 0 (0.0%) |
| $100,000+ | 15 (14.0%) | 7 (10.6%) |
| Total | 107 (100.0%) | 66 (100.0%) |
Earnings by Sex by Educational Attainment in East Cathlamet
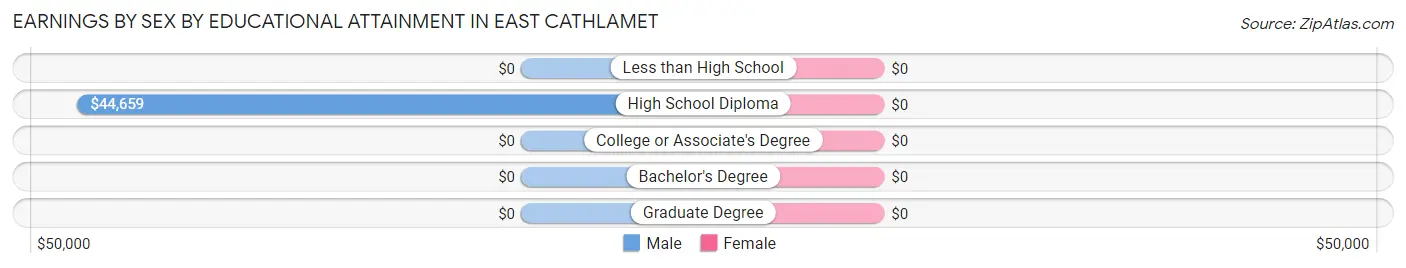
| Educational Attainment | Male Income | Female Income |
| Less than High School | - | - |
| High School Diploma | $44,659 | $0 |
| College or Associate's Degree | - | - |
| Bachelor's Degree | - | - |
| Graduate Degree | - | - |
| Total | $33,409 | $32,639 |
Family Income in East Cathlamet
Family Income Brackets in East Cathlamet
According to the East Cathlamet family income data, there are 62 families falling into the $100,000 to $149,999 income range, which is the most common income bracket and makes up 30.2% of all families.
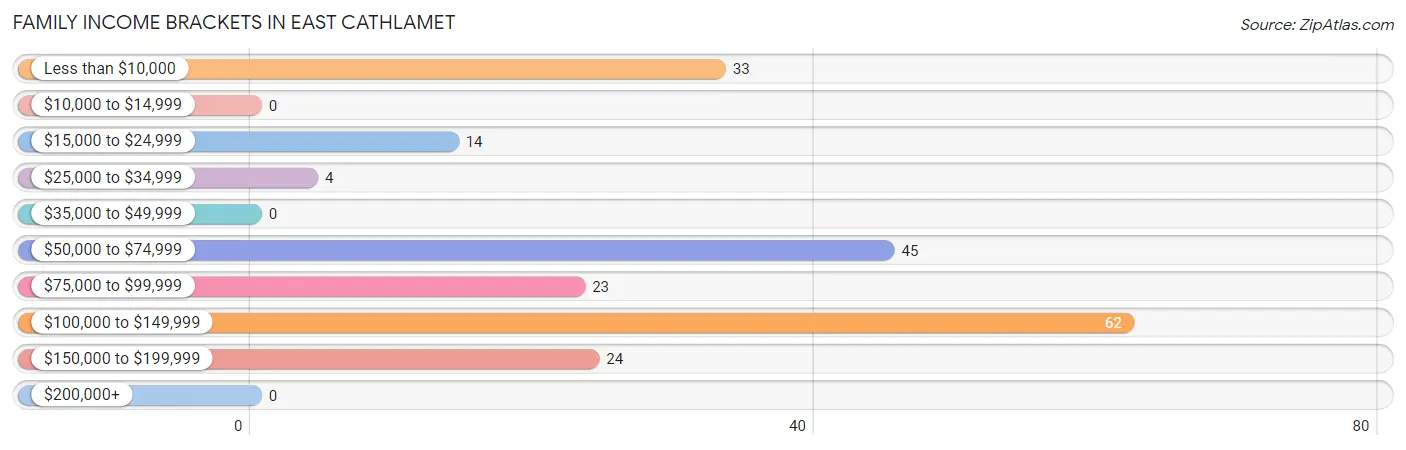
| Income Bracket | # Families | % Families |
| Less than $10,000 | 33 | 16.1% |
| $10,000 to $14,999 | 0 | 0.0% |
| $15,000 to $24,999 | 14 | 6.8% |
| $25,000 to $34,999 | 4 | 2.0% |
| $35,000 to $49,999 | 0 | 0.0% |
| $50,000 to $74,999 | 45 | 22.0% |
| $75,000 to $99,999 | 23 | 11.2% |
| $100,000 to $149,999 | 62 | 30.2% |
| $150,000 to $199,999 | 24 | 11.7% |
| $200,000+ | 0 | 0.0% |
Family Income by Famaliy Size in East Cathlamet
2-person families (96 | 46.8%) account for the highest median family income in East Cathlamet with $72,222 per family, while 2-person families (96 | 46.8%) have the highest median income of $36,111 per family member.
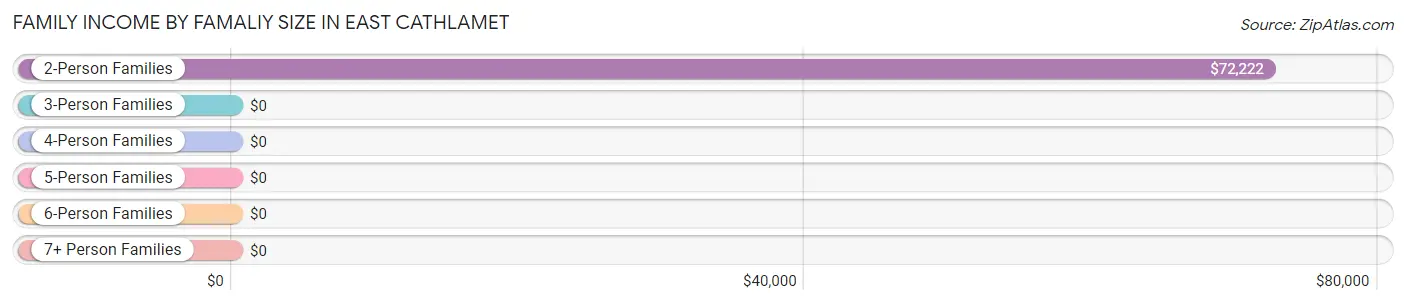
| Income Bracket | # Families | Median Income |
| 2-Person Families | 96 (46.8%) | $72,222 |
| 3-Person Families | 105 (51.2%) | $0 |
| 4-Person Families | 4 (1.9%) | $0 |
| 5-Person Families | 0 (0.0%) | $0 |
| 6-Person Families | 0 (0.0%) | $0 |
| 7+ Person Families | 0 (0.0%) | $0 |
| Total | 205 (100.0%) | $76,806 |
Family Income by Number of Earners in East Cathlamet
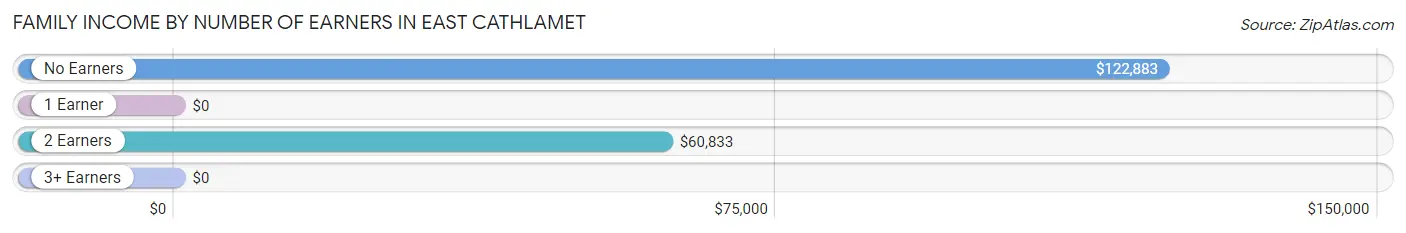
| Number of Earners | # Families | Median Income |
| No Earners | 153 (74.6%) | $122,883 |
| 1 Earner | 14 (6.8%) | $0 |
| 2 Earners | 38 (18.5%) | $60,833 |
| 3+ Earners | 0 (0.0%) | $0 |
| Total | 205 (100.0%) | $76,806 |
Household Income in East Cathlamet
Household Income Brackets in East Cathlamet
With 84 households falling in the category, the $100,000 to $149,999 income range is the most frequent in East Cathlamet, accounting for 29.1% of all households.
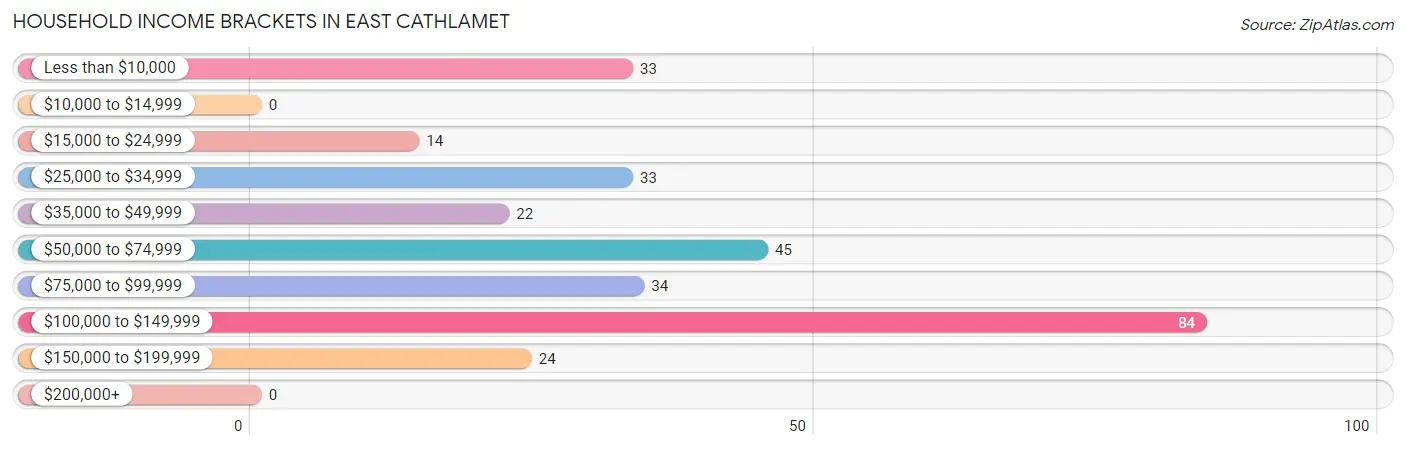
| Income Bracket | # Households | % Households |
| Less than $10,000 | 33 | 11.4% |
| $10,000 to $14,999 | 0 | 0.0% |
| $15,000 to $24,999 | 14 | 4.8% |
| $25,000 to $34,999 | 33 | 11.4% |
| $35,000 to $49,999 | 22 | 7.6% |
| $50,000 to $74,999 | 45 | 15.6% |
| $75,000 to $99,999 | 34 | 11.8% |
| $100,000 to $149,999 | 84 | 29.1% |
| $150,000 to $199,999 | 24 | 8.3% |
| $200,000+ | 0 | 0.0% |
Household Income by Householder Age in East Cathlamet
The median household income in East Cathlamet is $71,806, with the highest median household income of $92,411 found in the 65+ years age bracket for the primary householder. A total of 67 households (23.2%) fall into this category.
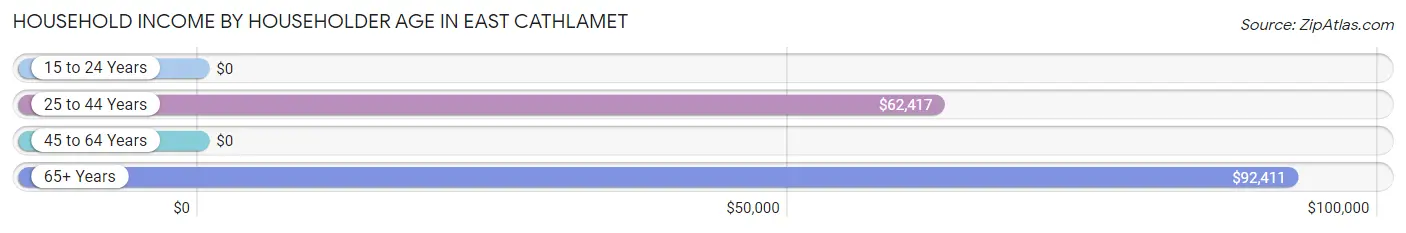
| Income Bracket | # Households | Median Income |
| 15 to 24 Years | 0 (0.0%) | $0 |
| 25 to 44 Years | 49 (17.0%) | $62,417 |
| 45 to 64 Years | 173 (59.9%) | $0 |
| 65+ Years | 67 (23.2%) | $92,411 |
| Total | 289 (100.0%) | $71,806 |
Poverty in East Cathlamet
Income Below Poverty by Sex and Age in East Cathlamet
With 36.4% poverty level for males and 25.1% for females among the residents of East Cathlamet, 6 to 11 year old males and 16 and 17 year old females are the most vulnerable to poverty, with 52 males (100.0%) and 8 females (100.0%) in their respective age groups living below the poverty level.
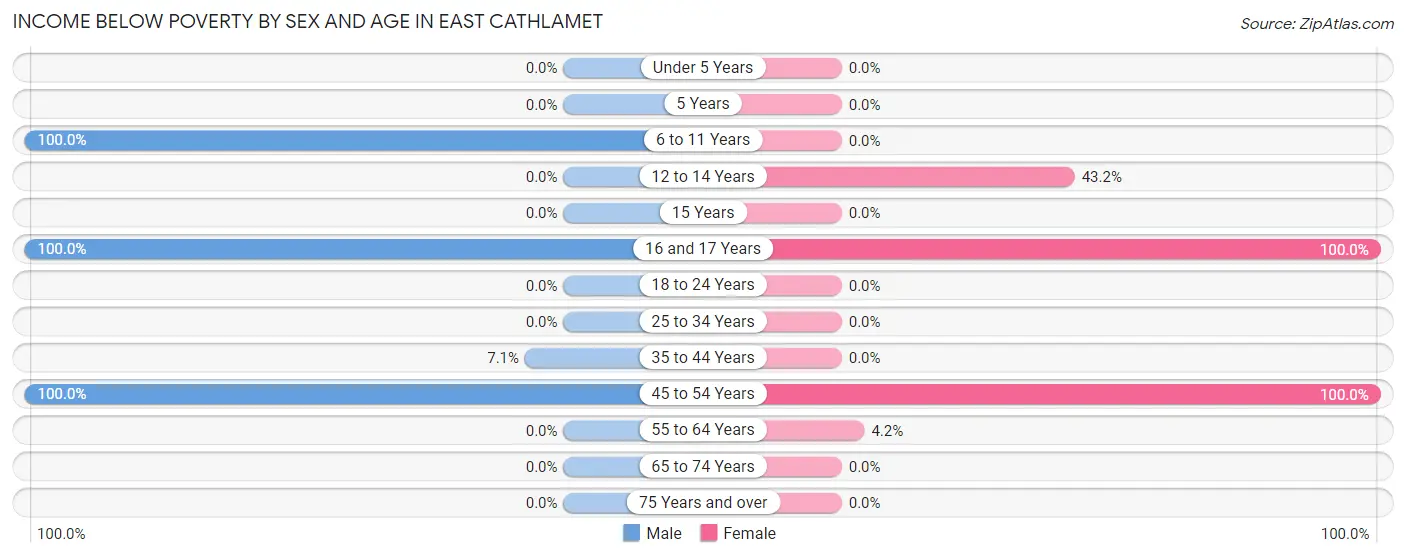
| Age Bracket | Male | Female |
| Under 5 Years | 0 (0.0%) | 0 (0.0%) |
| 5 Years | 0 (0.0%) | 0 (0.0%) |
| 6 to 11 Years | 52 (100.0%) | 0 (0.0%) |
| 12 to 14 Years | 0 (0.0%) | 16 (43.2%) |
| 15 Years | 0 (0.0%) | 0 (0.0%) |
| 16 and 17 Years | 11 (100.0%) | 8 (100.0%) |
| 18 to 24 Years | 0 (0.0%) | 0 (0.0%) |
| 25 to 34 Years | 0 (0.0%) | 0 (0.0%) |
| 35 to 44 Years | 4 (7.1%) | 0 (0.0%) |
| 45 to 54 Years | 50 (100.0%) | 47 (100.0%) |
| 55 to 64 Years | 0 (0.0%) | 4 (4.2%) |
| 65 to 74 Years | 0 (0.0%) | 0 (0.0%) |
| 75 Years and over | 0 (0.0%) | 0 (0.0%) |
| Total | 117 (36.4%) | 75 (25.1%) |
Income Above Poverty by Sex and Age in East Cathlamet
According to the poverty statistics in East Cathlamet, males aged under 5 years and females aged 18 to 24 years are the age groups that are most secure financially, with 100.0% of males and 100.0% of females in these age groups living above the poverty line.
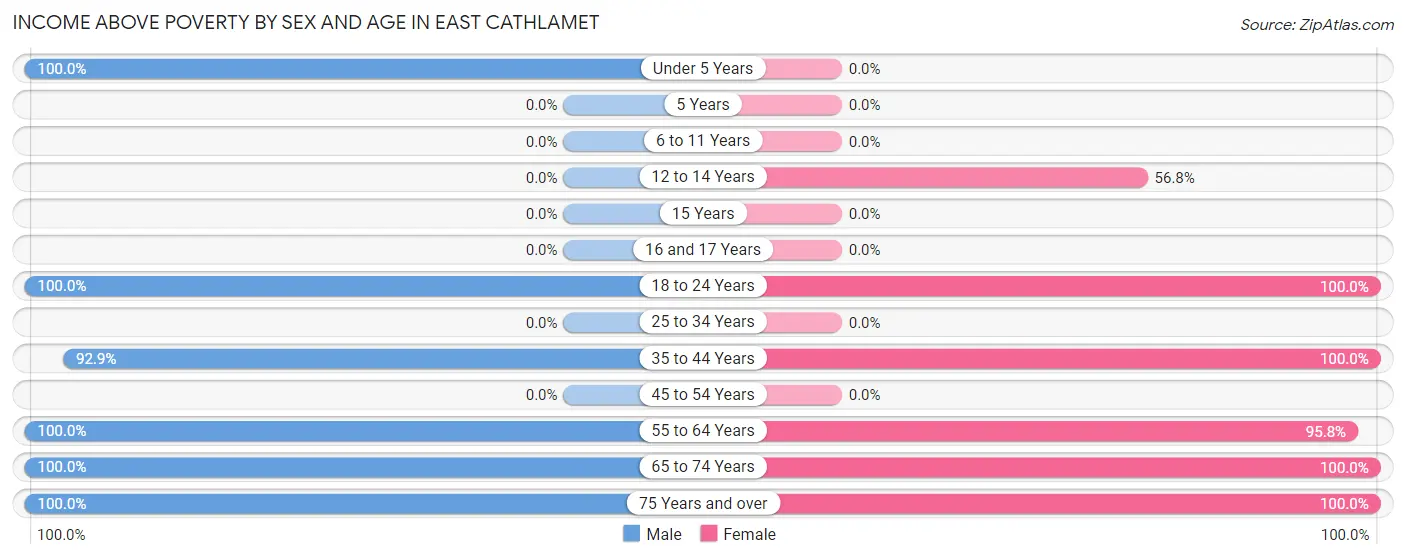
| Age Bracket | Male | Female |
| Under 5 Years | 9 (100.0%) | 0 (0.0%) |
| 5 Years | 0 (0.0%) | 0 (0.0%) |
| 6 to 11 Years | 0 (0.0%) | 0 (0.0%) |
| 12 to 14 Years | 0 (0.0%) | 21 (56.8%) |
| 15 Years | 0 (0.0%) | 0 (0.0%) |
| 16 and 17 Years | 0 (0.0%) | 0 (0.0%) |
| 18 to 24 Years | 14 (100.0%) | 17 (100.0%) |
| 25 to 34 Years | 0 (0.0%) | 0 (0.0%) |
| 35 to 44 Years | 52 (92.9%) | 19 (100.0%) |
| 45 to 54 Years | 0 (0.0%) | 0 (0.0%) |
| 55 to 64 Years | 40 (100.0%) | 91 (95.8%) |
| 65 to 74 Years | 51 (100.0%) | 43 (100.0%) |
| 75 Years and over | 38 (100.0%) | 33 (100.0%) |
| Total | 204 (63.5%) | 224 (74.9%) |
Income Below Poverty Among Married-Couple Families in East Cathlamet
The poverty statistics for married-couple families in East Cathlamet show that 19.2% or 33 of the total 172 families live below the poverty line. Families with 1 or 2 children have the highest poverty rate of 34.7%, comprising of 33 families. On the other hand, families with no children have the lowest poverty rate of 0.0%, which includes 0 families.
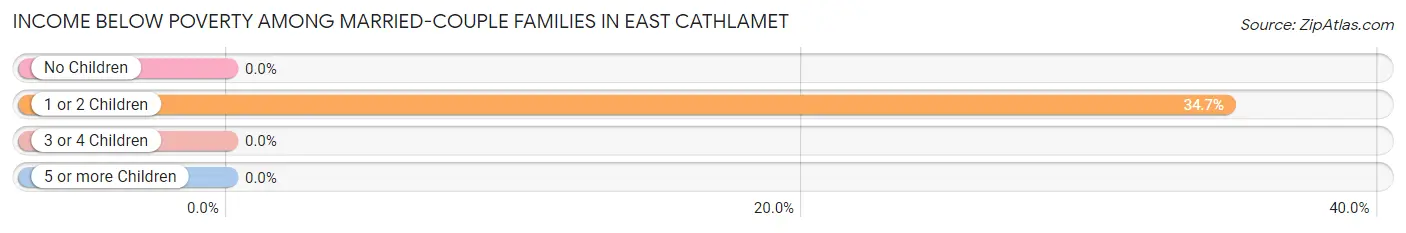
| Children | Above Poverty | Below Poverty |
| No Children | 77 (100.0%) | 0 (0.0%) |
| 1 or 2 Children | 62 (65.3%) | 33 (34.7%) |
| 3 or 4 Children | 0 (0.0%) | 0 (0.0%) |
| 5 or more Children | 0 (0.0%) | 0 (0.0%) |
| Total | 139 (80.8%) | 33 (19.2%) |
Income Below Poverty Among Single-Parent Households in East Cathlamet
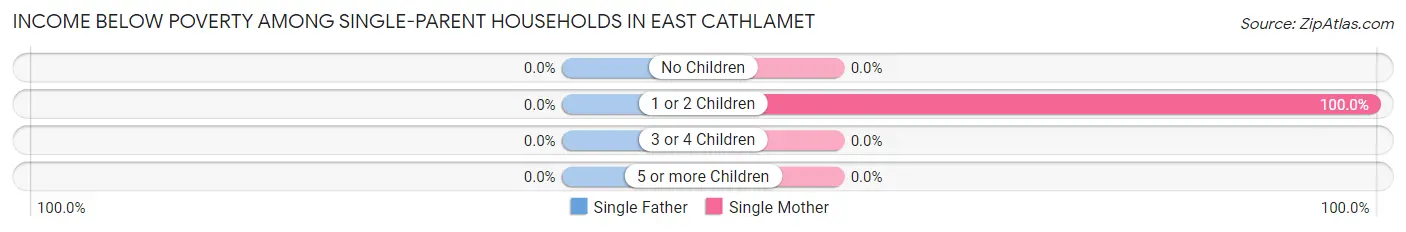
| Children | Single Father | Single Mother |
| No Children | 0 (0.0%) | 0 (0.0%) |
| 1 or 2 Children | 0 (0.0%) | 18 (100.0%) |
| 3 or 4 Children | 0 (0.0%) | 0 (0.0%) |
| 5 or more Children | 0 (0.0%) | 0 (0.0%) |
| Total | 0 (0.0%) | 18 (100.0%) |
Income Below Poverty Among Married-Couple vs Single-Parent Households in East Cathlamet
The poverty data for East Cathlamet shows that 33 of the married-couple family households (19.2%) and 18 of the single-parent households (54.5%) are living below the poverty level. Within the married-couple family households, those with 1 or 2 children have the highest poverty rate, with 33 households (34.7%) falling below the poverty line. Among the single-parent households, those with 1 or 2 children have the highest poverty rate, with 18 household (100.0%) living below poverty.
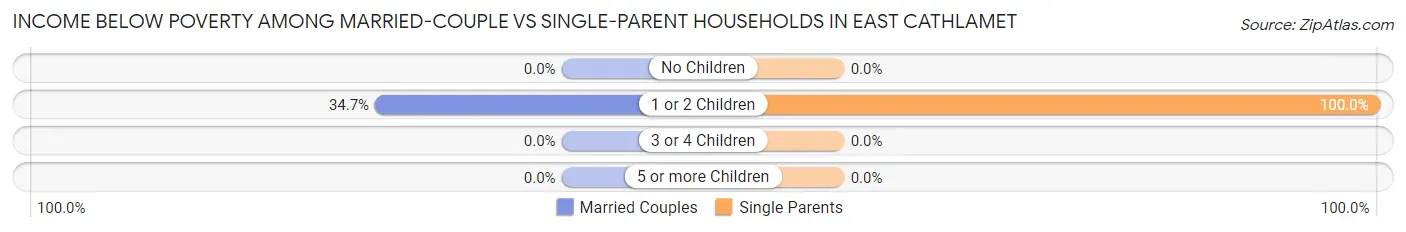
| Children | Married-Couple Families | Single-Parent Households |
| No Children | 0 (0.0%) | 0 (0.0%) |
| 1 or 2 Children | 33 (34.7%) | 18 (100.0%) |
| 3 or 4 Children | 0 (0.0%) | 0 (0.0%) |
| 5 or more Children | 0 (0.0%) | 0 (0.0%) |
| Total | 33 (19.2%) | 18 (54.5%) |
Race in East Cathlamet
The most populous races in East Cathlamet are White / Caucasian (560 | 90.3%), Two or more Races (44 | 7.1%), and Hispanic or Latino (32 | 5.2%).
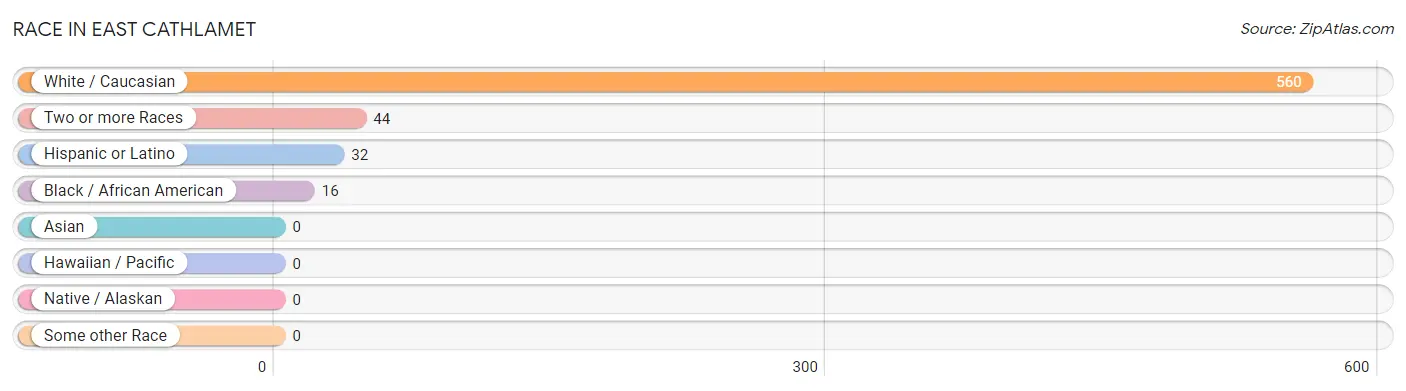
| Race | # Population | % Population |
| Asian | 0 | 0.0% |
| Black / African American | 16 | 2.6% |
| Hawaiian / Pacific | 0 | 0.0% |
| Hispanic or Latino | 32 | 5.2% |
| Native / Alaskan | 0 | 0.0% |
| White / Caucasian | 560 | 90.3% |
| Two or more Races | 44 | 7.1% |
| Some other Race | 0 | 0.0% |
| Total | 620 | 100.0% |
Ancestry in East Cathlamet
The most populous ancestries reported in East Cathlamet are English (158 | 25.5%), German (80 | 12.9%), Swedish (38 | 6.1%), Mexican (32 | 5.2%), and Norwegian (22 | 3.5%), together accounting for 53.2% of all East Cathlamet residents.
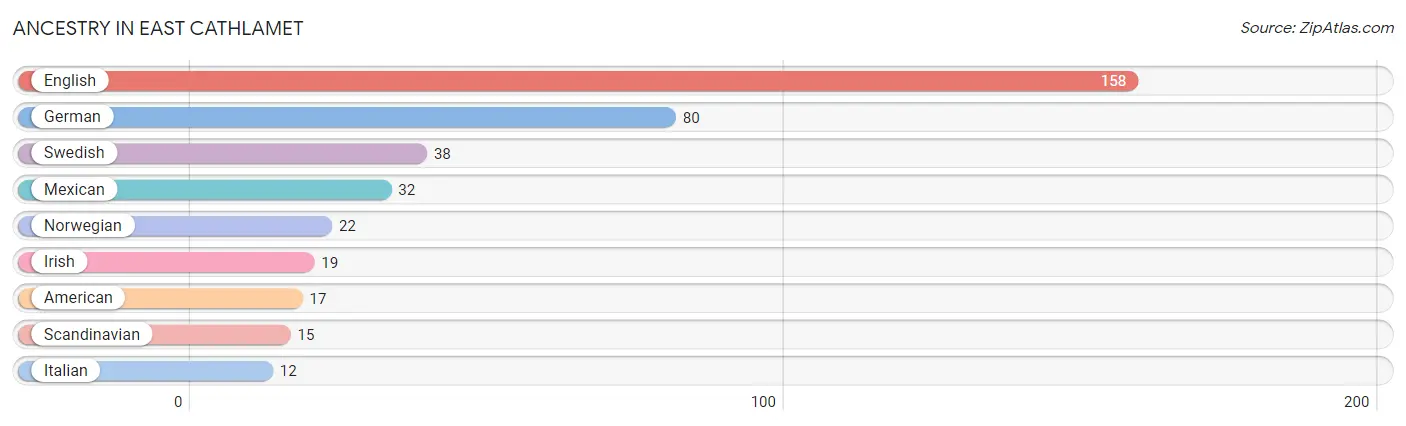
| Ancestry | # Population | % Population |
| American | 17 | 2.7% |
| English | 158 | 25.5% |
| German | 80 | 12.9% |
| Irish | 19 | 3.1% |
| Italian | 12 | 1.9% |
| Mexican | 32 | 5.2% |
| Norwegian | 22 | 3.5% |
| Scandinavian | 15 | 2.4% |
| Swedish | 38 | 6.1% | View All 9 Rows |
Immigrants in East Cathlamet

| Immigration Origin | # Population | % Population | View All 0 Rows |
Sex and Age in East Cathlamet
Sex and Age in East Cathlamet
The most populous age groups in East Cathlamet are 10 to 14 Years (52 | 16.2%) for men and 60 to 64 Years (82 | 27.4%) for women.
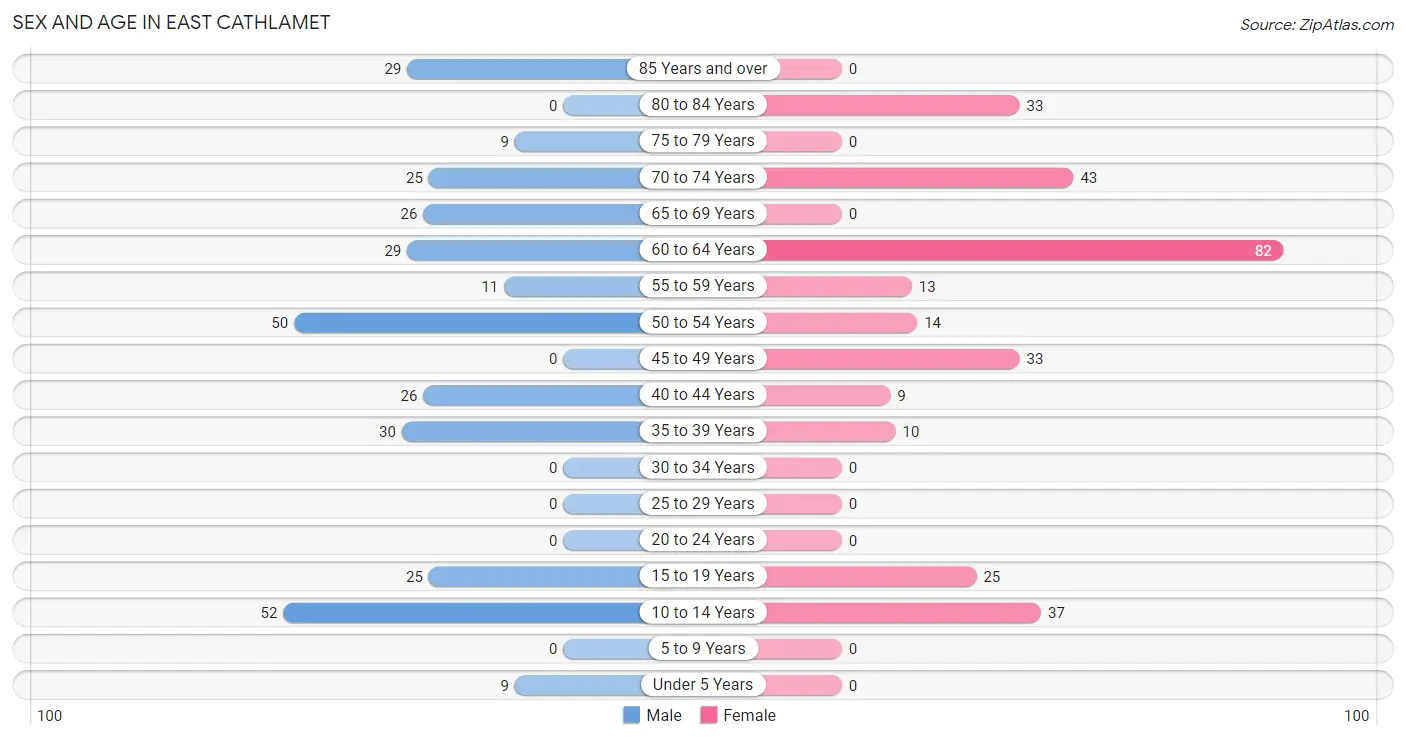
| Age Bracket | Male | Female |
| Under 5 Years | 9 (2.8%) | 0 (0.0%) |
| 5 to 9 Years | 0 (0.0%) | 0 (0.0%) |
| 10 to 14 Years | 52 (16.2%) | 37 (12.4%) |
| 15 to 19 Years | 25 (7.8%) | 25 (8.4%) |
| 20 to 24 Years | 0 (0.0%) | 0 (0.0%) |
| 25 to 29 Years | 0 (0.0%) | 0 (0.0%) |
| 30 to 34 Years | 0 (0.0%) | 0 (0.0%) |
| 35 to 39 Years | 30 (9.3%) | 10 (3.3%) |
| 40 to 44 Years | 26 (8.1%) | 9 (3.0%) |
| 45 to 49 Years | 0 (0.0%) | 33 (11.0%) |
| 50 to 54 Years | 50 (15.6%) | 14 (4.7%) |
| 55 to 59 Years | 11 (3.4%) | 13 (4.3%) |
| 60 to 64 Years | 29 (9.0%) | 82 (27.4%) |
| 65 to 69 Years | 26 (8.1%) | 0 (0.0%) |
| 70 to 74 Years | 25 (7.8%) | 43 (14.4%) |
| 75 to 79 Years | 9 (2.8%) | 0 (0.0%) |
| 80 to 84 Years | 0 (0.0%) | 33 (11.0%) |
| 85 Years and over | 29 (9.0%) | 0 (0.0%) |
| Total | 321 (100.0%) | 299 (100.0%) |
Families and Households in East Cathlamet
Median Family Size in East Cathlamet
The median family size in East Cathlamet is 2.57 persons per family, with single female/mother families (18 | 8.8%) accounting for the largest median family size of 3.17 persons per family. On the other hand, single male/father families (15 | 7.3%) represent the smallest median family size with 2.13 persons per family.
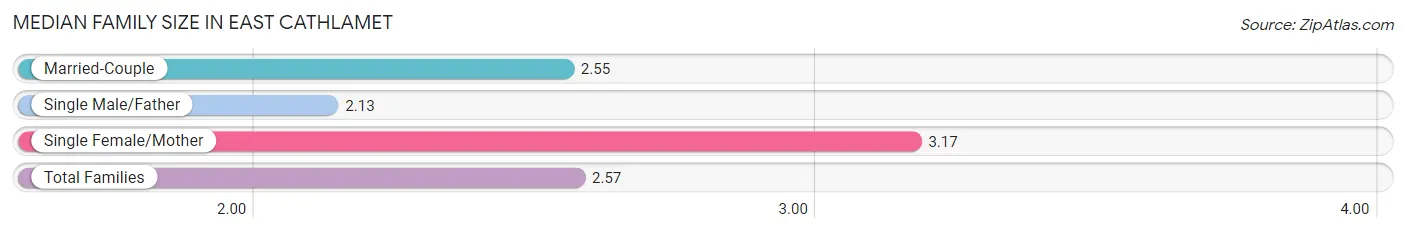
| Family Type | # Families | Family Size |
| Married-Couple | 172 (83.9%) | 2.55 |
| Single Male/Father | 15 (7.3%) | 2.13 |
| Single Female/Mother | 18 (8.8%) | 3.17 |
| Total Families | 205 (100.0%) | 2.57 |
Median Household Size in East Cathlamet
The median household size in East Cathlamet is 2.15 persons per household, with single female/mother households (18 | 6.2%) accounting for the largest median household size of 3.17 persons per household. non-family households (84 | 29.1%) represent the smallest median household size with 1.11 persons per household.
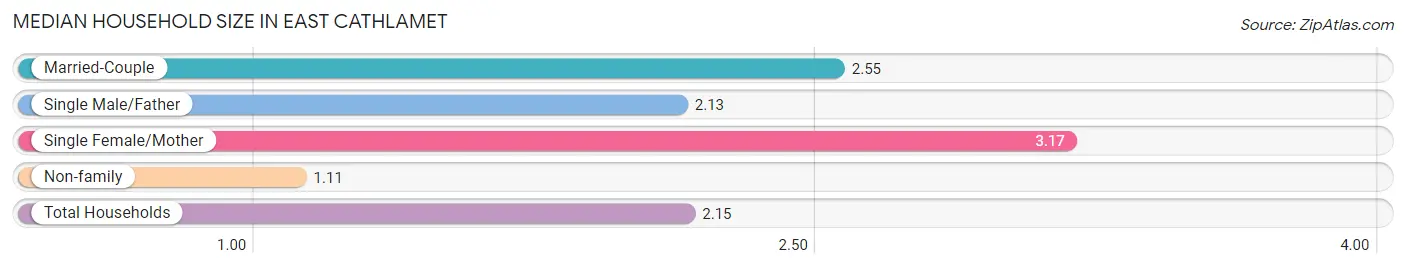
| Household Type | # Households | Household Size |
| Married-Couple | 172 (59.5%) | 2.55 |
| Single Male/Father | 15 (5.2%) | 2.13 |
| Single Female/Mother | 18 (6.2%) | 3.17 |
| Non-family | 84 (29.1%) | 1.11 |
| Total Households | 289 (100.0%) | 2.15 |
Household Size by Marriage Status in East Cathlamet
Out of a total of 289 households in East Cathlamet, 205 (70.9%) are family households, while 84 (29.1%) are nonfamily households. The most numerous type of family households are 3-person households, comprising 105, and the most common type of nonfamily households are 1-person households, comprising 73.
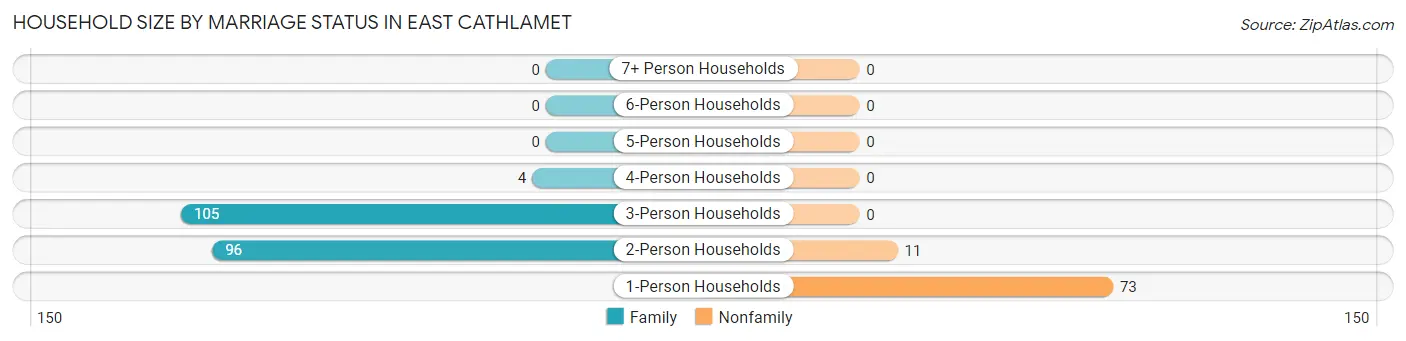
| Household Size | Family Households | Nonfamily Households |
| 1-Person Households | - | 73 (25.3%) |
| 2-Person Households | 96 (33.2%) | 11 (3.8%) |
| 3-Person Households | 105 (36.3%) | 0 (0.0%) |
| 4-Person Households | 4 (1.4%) | 0 (0.0%) |
| 5-Person Households | 0 (0.0%) | 0 (0.0%) |
| 6-Person Households | 0 (0.0%) | 0 (0.0%) |
| 7+ Person Households | 0 (0.0%) | 0 (0.0%) |
| Total | 205 (70.9%) | 84 (29.1%) |
Female Fertility in East Cathlamet
Fertility by Age in East Cathlamet
| Age Bracket | Women with Births | Births / 1,000 Women |
| 15 to 19 years | 0 (0.0%) | 0.0 |
| 20 to 34 years | 0 (0.0%) | 0.0 |
| 35 to 50 years | 0 (0.0%) | 0.0 |
| Total | 0 (0.0%) | 0.0 |
Fertility by Age by Marriage Status in East Cathlamet
| Age Bracket | Married | Unmarried |
| 15 to 19 years | 0 (0.0%) | 0 (0.0%) |
| 20 to 34 years | 0 (0.0%) | 0 (0.0%) |
| 35 to 50 years | 0 (0.0%) | 0 (0.0%) |
| Total | 0 (0.0%) | 0 (0.0%) |
Fertility by Education in East Cathlamet
| Educational Attainment | Women with Births | Births / 1,000 Women |
| Less than High School | 0 (0.0%) | 0.0 |
| High School Diploma | 0 (0.0%) | 0.0 |
| College or Associate's Degree | 0 (0.0%) | 0.0 |
| Bachelor's Degree | 0 (0.0%) | 0.0 |
| Graduate Degree | 0 (0.0%) | 0.0 |
| Total | 0 (0.0%) | 0.0 |
Fertility by Education by Marriage Status in East Cathlamet
| Educational Attainment | Married | Unmarried |
| Less than High School | 0 (0.0%) | 0 (0.0%) |
| High School Diploma | 0 (0.0%) | 0 (0.0%) |
| College or Associate's Degree | 0 (0.0%) | 0 (0.0%) |
| Bachelor's Degree | 0 (0.0%) | 0 (0.0%) |
| Graduate Degree | 0 (0.0%) | 0 (0.0%) |
| Total | 0 (0.0%) | 0 (0.0%) |
Employment Characteristics in East Cathlamet
Employment by Class of Employer in East Cathlamet
Among the 145 employed individuals in East Cathlamet, private company employees (105 | 72.4%), not-for-profit organizations (29 | 20.0%), and self-employed (incorporated) (11 | 7.6%) make up the most common classes of employment.
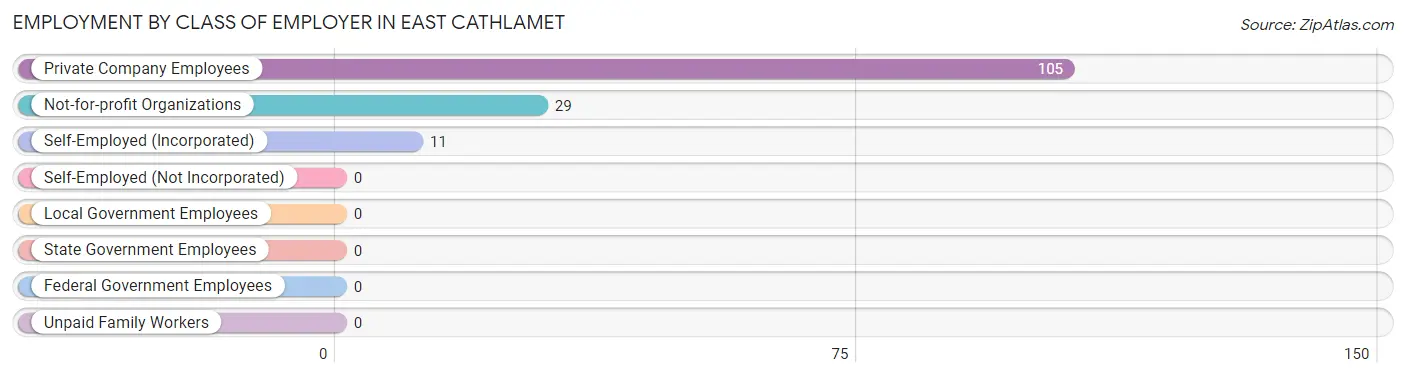
| Employer Class | # Employees | % Employees |
| Private Company Employees | 105 | 72.4% |
| Self-Employed (Incorporated) | 11 | 7.6% |
| Self-Employed (Not Incorporated) | 0 | 0.0% |
| Not-for-profit Organizations | 29 | 20.0% |
| Local Government Employees | 0 | 0.0% |
| State Government Employees | 0 | 0.0% |
| Federal Government Employees | 0 | 0.0% |
| Unpaid Family Workers | 0 | 0.0% |
| Total | 145 | 100.0% |
Employment Status by Age in East Cathlamet
According to the labor force statistics for East Cathlamet, out of the total population over 16 years of age (522), 28.5% or 149 individuals are in the labor force, with 2.7% or 4 of them unemployed. The age group with the highest labor force participation rate is 35 to 44 years, with 100.0% or 75 individuals in the labor force. Within the labor force, the 55 to 59 years age range has the highest percentage of unemployed individuals, with 16.7% or 4 of them being unemployed.
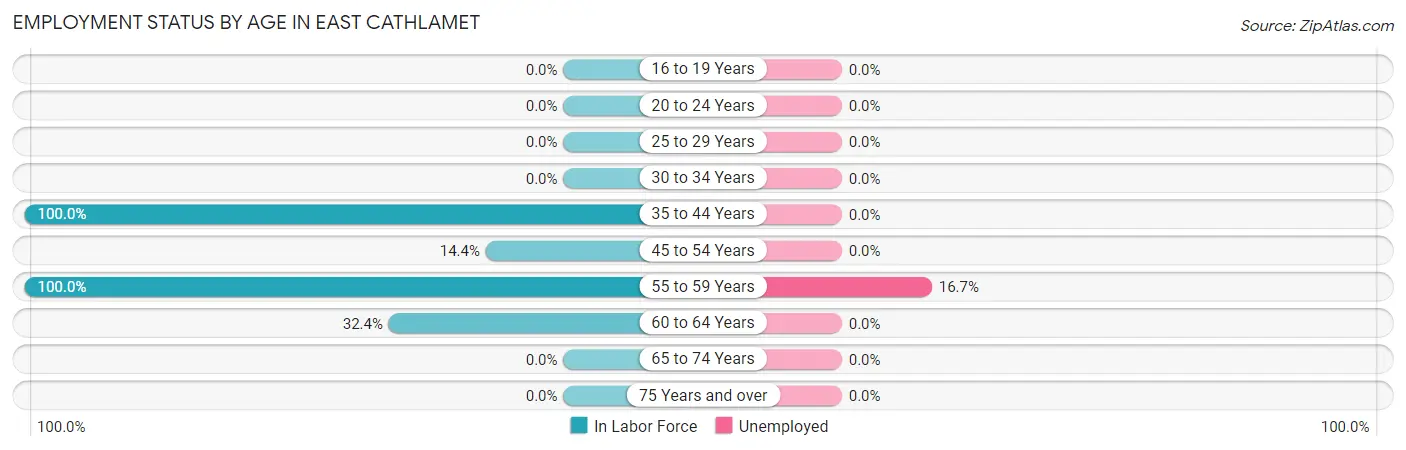
| Age Bracket | In Labor Force | Unemployed |
| 16 to 19 Years | 0 (0.0%) | 0 (0.0%) |
| 20 to 24 Years | 0 (0.0%) | 0 (0.0%) |
| 25 to 29 Years | 0 (0.0%) | 0 (0.0%) |
| 30 to 34 Years | 0 (0.0%) | 0 (0.0%) |
| 35 to 44 Years | 75 (100.0%) | 0 (0.0%) |
| 45 to 54 Years | 14 (14.4%) | 0 (0.0%) |
| 55 to 59 Years | 24 (100.0%) | 4 (16.7%) |
| 60 to 64 Years | 36 (32.4%) | 0 (0.0%) |
| 65 to 74 Years | 0 (0.0%) | 0 (0.0%) |
| 75 Years and over | 0 (0.0%) | 0 (0.0%) |
| Total | 149 (28.5%) | 4 (2.7%) |
Employment Status by Educational Attainment in East Cathlamet
According to labor force statistics for East Cathlamet, 48.5% of individuals (149) out of the total population between 25 and 64 years of age (307) are in the labor force, with 2.7% or 4 of them being unemployed. The group with the highest labor force participation rate are those with the educational attainment of high school diploma, with 52.8% or 93 individuals in the labor force. Within the labor force, individuals with high school diploma education have the highest percentage of unemployment, with 4.3% or 4 of them being unemployed.
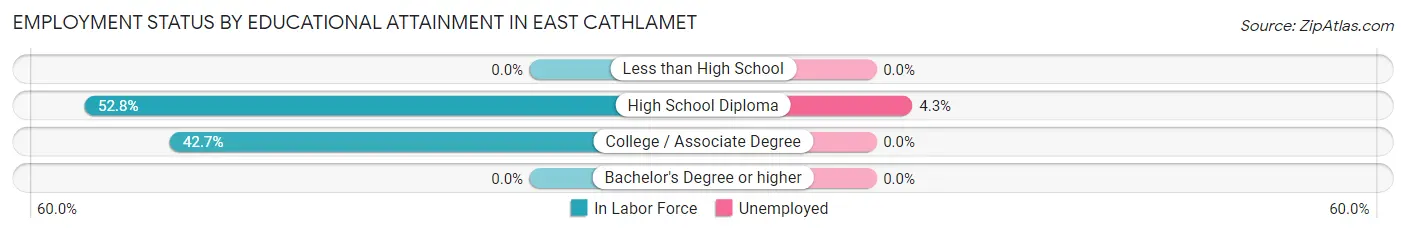
| Educational Attainment | In Labor Force | Unemployed |
| Less than High School | 0 (0.0%) | 0 (0.0%) |
| High School Diploma | 93 (52.8%) | 8 (4.3%) |
| College / Associate Degree | 56 (42.7%) | 0 (0.0%) |
| Bachelor's Degree or higher | 0 (0.0%) | 0 (0.0%) |
| Total | 149 (48.5%) | 8 (2.7%) |
Employment Occupations by Sex in East Cathlamet
Management, Business, Science and Arts Occupations
The most common Management, Business, Science and Arts occupations in East Cathlamet are , and Management (20 | 13.8%).
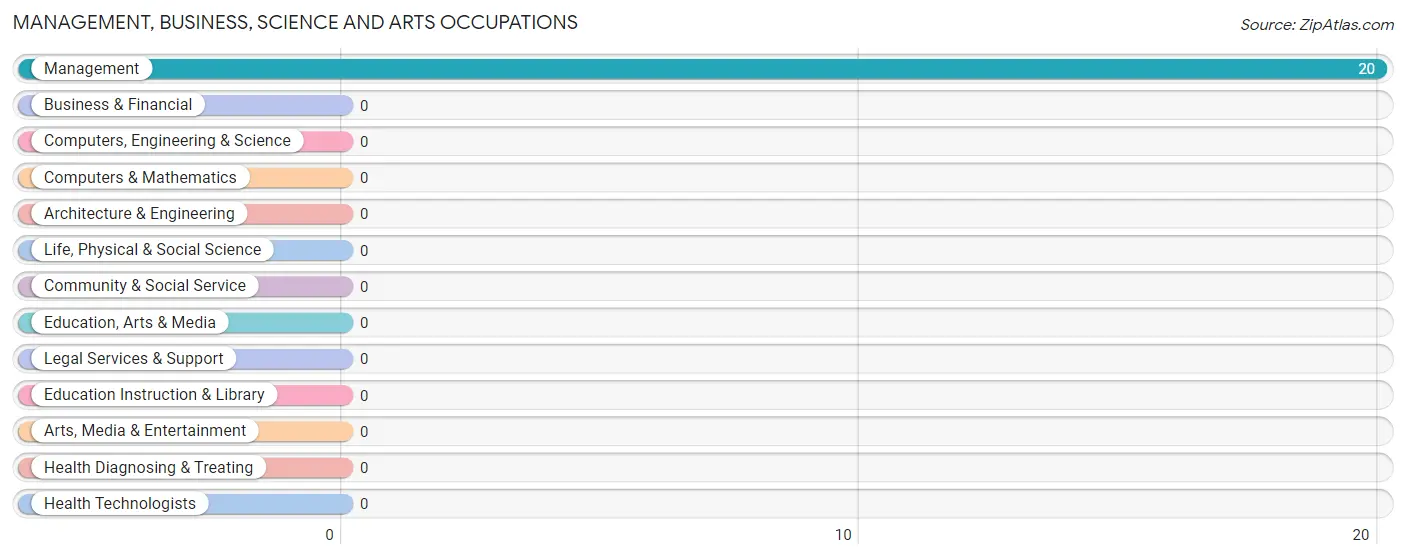
Management, Business, Science and Arts Occupations by Sex
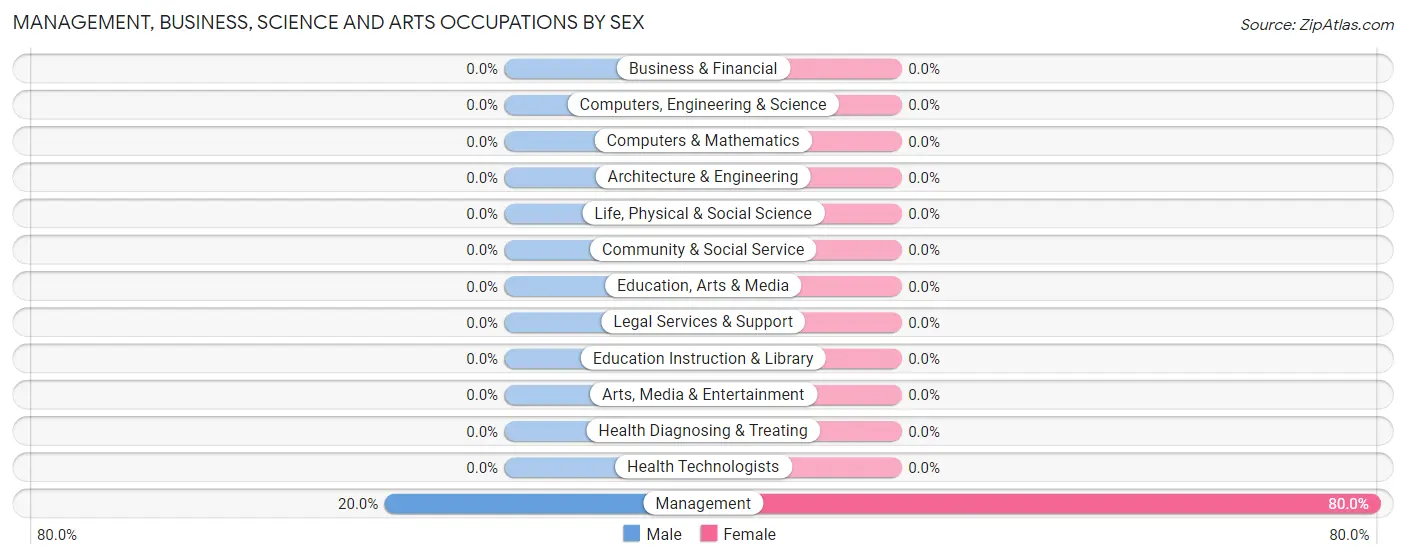
| Occupation | Male | Female |
| Management | 4 (20.0%) | 16 (80.0%) |
| Business & Financial | 0 (0.0%) | 0 (0.0%) |
| Computers, Engineering & Science | 0 (0.0%) | 0 (0.0%) |
| Computers & Mathematics | 0 (0.0%) | 0 (0.0%) |
| Architecture & Engineering | 0 (0.0%) | 0 (0.0%) |
| Life, Physical & Social Science | 0 (0.0%) | 0 (0.0%) |
| Community & Social Service | 0 (0.0%) | 0 (0.0%) |
| Education, Arts & Media | 0 (0.0%) | 0 (0.0%) |
| Legal Services & Support | 0 (0.0%) | 0 (0.0%) |
| Education Instruction & Library | 0 (0.0%) | 0 (0.0%) |
| Arts, Media & Entertainment | 0 (0.0%) | 0 (0.0%) |
| Health Diagnosing & Treating | 0 (0.0%) | 0 (0.0%) |
| Health Technologists | 0 (0.0%) | 0 (0.0%) |
| Total (Category) | 4 (20.0%) | 16 (80.0%) |
| Total (Overall) | 96 (66.2%) | 49 (33.8%) |
Services Occupations
The most common Services occupations in East Cathlamet are Healthcare Support (44 | 30.3%), and Cleaning & Maintenance (9 | 6.2%).
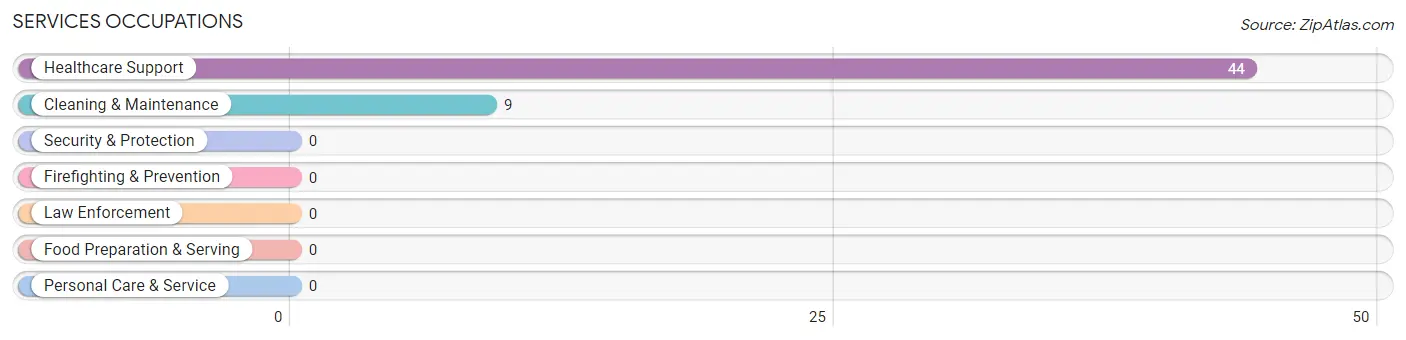
Services Occupations by Sex
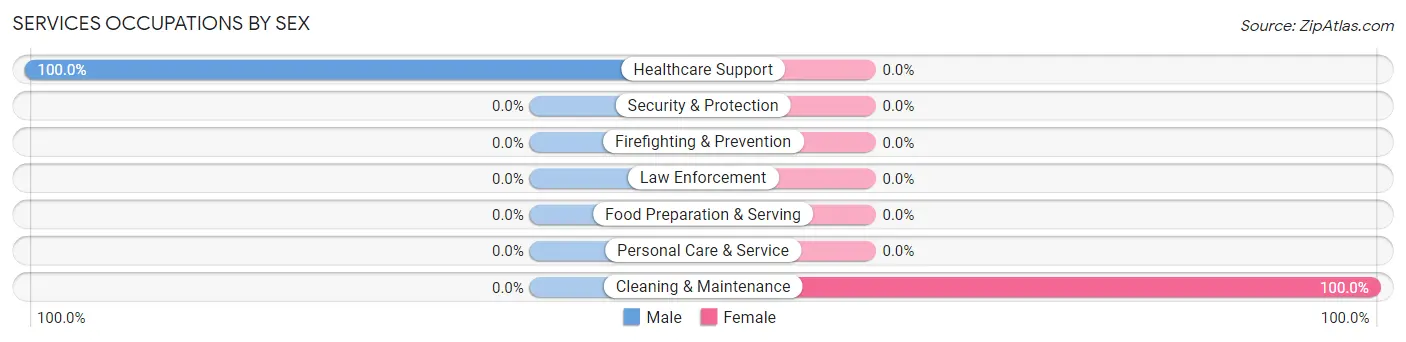
| Occupation | Male | Female |
| Healthcare Support | 44 (100.0%) | 0 (0.0%) |
| Security & Protection | 0 (0.0%) | 0 (0.0%) |
| Firefighting & Prevention | 0 (0.0%) | 0 (0.0%) |
| Law Enforcement | 0 (0.0%) | 0 (0.0%) |
| Food Preparation & Serving | 0 (0.0%) | 0 (0.0%) |
| Cleaning & Maintenance | 0 (0.0%) | 9 (100.0%) |
| Personal Care & Service | 0 (0.0%) | 0 (0.0%) |
| Total (Category) | 44 (83.0%) | 9 (17.0%) |
| Total (Overall) | 96 (66.2%) | 49 (33.8%) |
Sales and Office Occupations
The most common Sales and Office occupations in East Cathlamet are , and Sales & Related (24 | 16.6%).
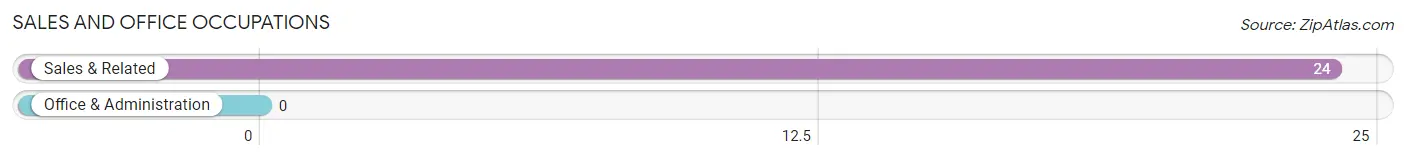
Sales and Office Occupations by Sex
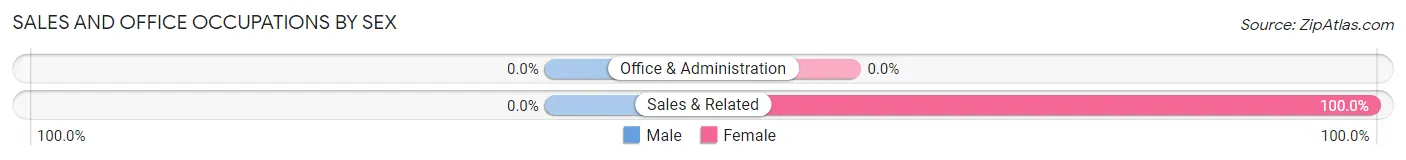
| Occupation | Male | Female |
| Sales & Related | 0 (0.0%) | 24 (100.0%) |
| Office & Administration | 0 (0.0%) | 0 (0.0%) |
| Total (Category) | 0 (0.0%) | 24 (100.0%) |
| Total (Overall) | 96 (66.2%) | 49 (33.8%) |
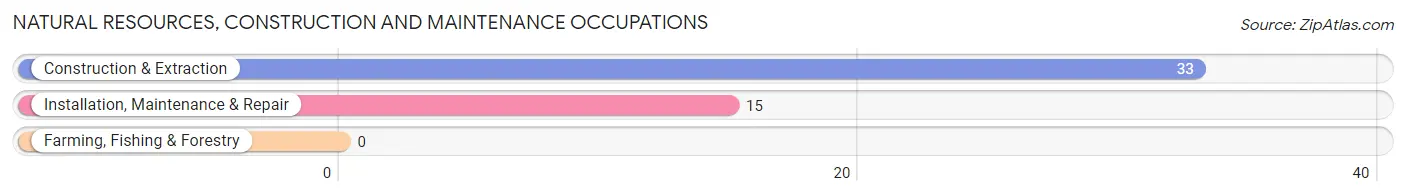
Natural Resources, Construction and Maintenance Occupations
The most common Natural Resources, Construction and Maintenance occupations in East Cathlamet are Construction & Extraction (33 | 22.8%), and Installation, Maintenance & Repair (15 | 10.3%).
Natural Resources, Construction and Maintenance Occupations by Sex
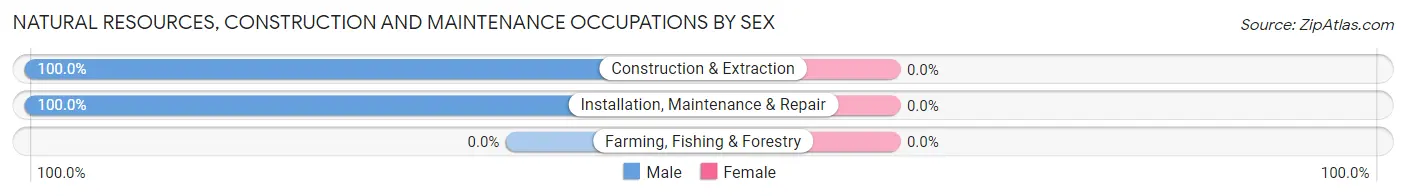
| Occupation | Male | Female |
| Farming, Fishing & Forestry | 0 (0.0%) | 0 (0.0%) |
| Construction & Extraction | 33 (100.0%) | 0 (0.0%) |
| Installation, Maintenance & Repair | 15 (100.0%) | 0 (0.0%) |
| Total (Category) | 48 (100.0%) | 0 (0.0%) |
| Total (Overall) | 96 (66.2%) | 49 (33.8%) |
Production, Transportation and Moving Occupations
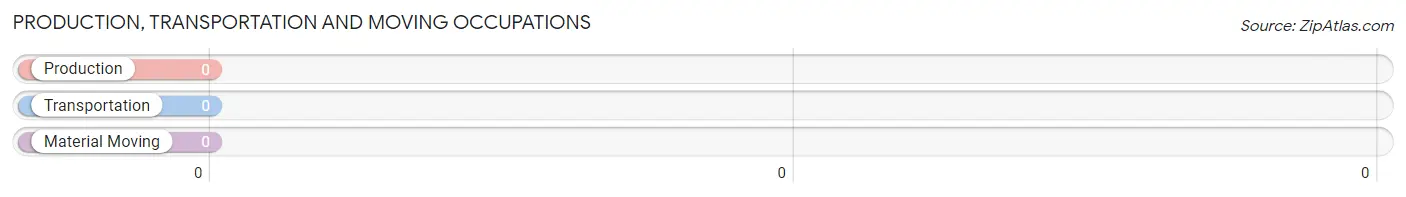
Production, Transportation and Moving Occupations by Sex
| Occupation | Male | Female |
| Production | 0 (0.0%) | 0 (0.0%) |
| Transportation | 0 (0.0%) | 0 (0.0%) |
| Material Moving | 0 (0.0%) | 0 (0.0%) |
| Total (Category) | 0 (0.0%) | 0 (0.0%) |
| Total (Overall) | 96 (66.2%) | 49 (33.8%) |
Employment Industries by Sex in East Cathlamet
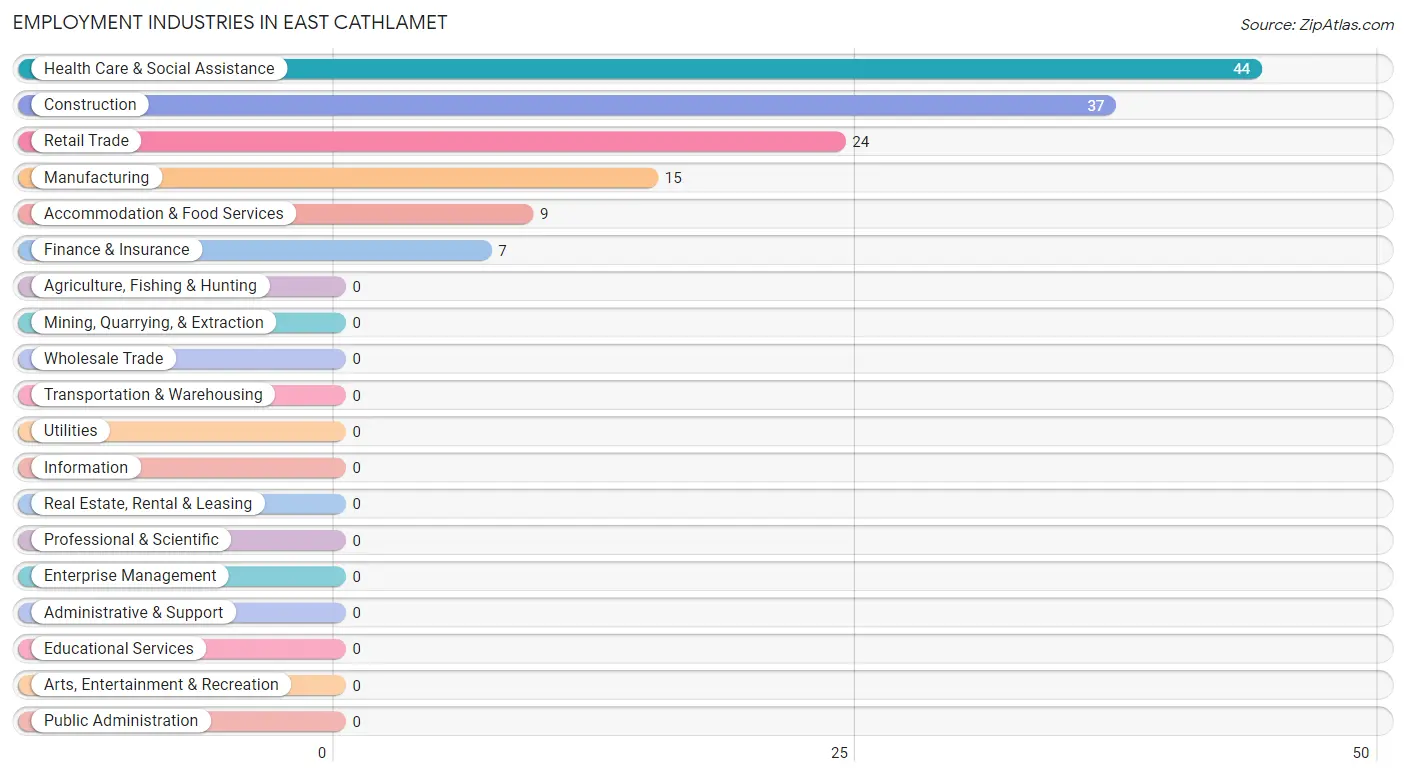
Employment Industries in East Cathlamet
The major employment industries in East Cathlamet include Health Care & Social Assistance (44 | 30.3%), Construction (37 | 25.5%), Retail Trade (24 | 16.6%), Manufacturing (15 | 10.3%), and Accommodation & Food Services (9 | 6.2%).
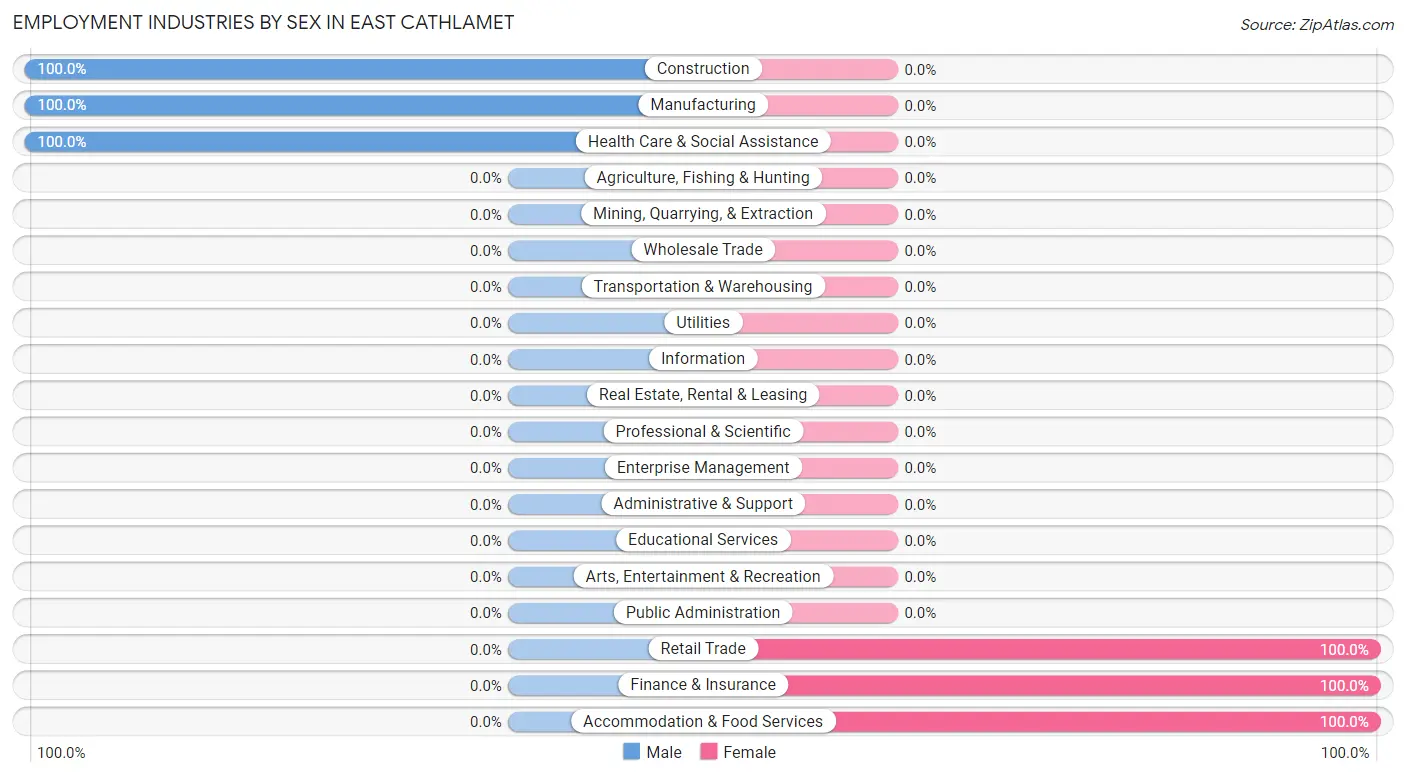
Employment Industries by Sex in East Cathlamet
The East Cathlamet industries that see more men than women are Construction (100.0%), Manufacturing (100.0%), and Health Care & Social Assistance (100.0%), whereas the industries that tend to have a higher number of women are Retail Trade (100.0%), Finance & Insurance (100.0%), and Accommodation & Food Services (100.0%).
| Industry | Male | Female |
| Agriculture, Fishing & Hunting | 0 (0.0%) | 0 (0.0%) |
| Mining, Quarrying, & Extraction | 0 (0.0%) | 0 (0.0%) |
| Construction | 37 (100.0%) | 0 (0.0%) |
| Manufacturing | 15 (100.0%) | 0 (0.0%) |
| Wholesale Trade | 0 (0.0%) | 0 (0.0%) |
| Retail Trade | 0 (0.0%) | 24 (100.0%) |
| Transportation & Warehousing | 0 (0.0%) | 0 (0.0%) |
| Utilities | 0 (0.0%) | 0 (0.0%) |
| Information | 0 (0.0%) | 0 (0.0%) |
| Finance & Insurance | 0 (0.0%) | 7 (100.0%) |
| Real Estate, Rental & Leasing | 0 (0.0%) | 0 (0.0%) |
| Professional & Scientific | 0 (0.0%) | 0 (0.0%) |
| Enterprise Management | 0 (0.0%) | 0 (0.0%) |
| Administrative & Support | 0 (0.0%) | 0 (0.0%) |
| Educational Services | 0 (0.0%) | 0 (0.0%) |
| Health Care & Social Assistance | 44 (100.0%) | 0 (0.0%) |
| Arts, Entertainment & Recreation | 0 (0.0%) | 0 (0.0%) |
| Accommodation & Food Services | 0 (0.0%) | 9 (100.0%) |
| Public Administration | 0 (0.0%) | 0 (0.0%) |
| Total | 96 (66.2%) | 49 (33.8%) |
Education in East Cathlamet
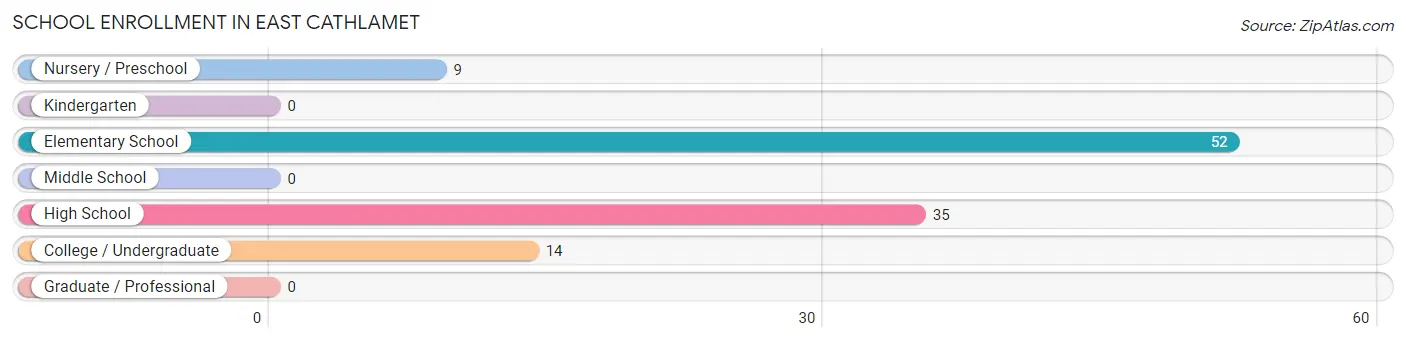
School Enrollment in East Cathlamet
The most common levels of schooling among the 110 students in East Cathlamet are elementary school (52 | 47.3%), high school (35 | 31.8%), and college / undergraduate (14 | 12.7%).
| School Level | # Students | % Students |
| Nursery / Preschool | 9 | 8.2% |
| Kindergarten | 0 | 0.0% |
| Elementary School | 52 | 47.3% |
| Middle School | 0 | 0.0% |
| High School | 35 | 31.8% |
| College / Undergraduate | 14 | 12.7% |
| Graduate / Professional | 0 | 0.0% |
| Total | 110 | 100.0% |
School Enrollment by Age by Funding Source in East Cathlamet
Out of a total of 110 students who are enrolled in schools in East Cathlamet, 31 (28.2%) attend a private institution, while the remaining 79 (71.8%) are enrolled in public schools. The age group of 3 to 4 year olds has the highest likelihood of being enrolled in private schools, with 9 (100.0% in the age bracket) enrolled. Conversely, the age group of 10 to 14 year olds has the lowest likelihood of being enrolled in a private school, with 68 (100.0% in the age bracket) attending a public institution.
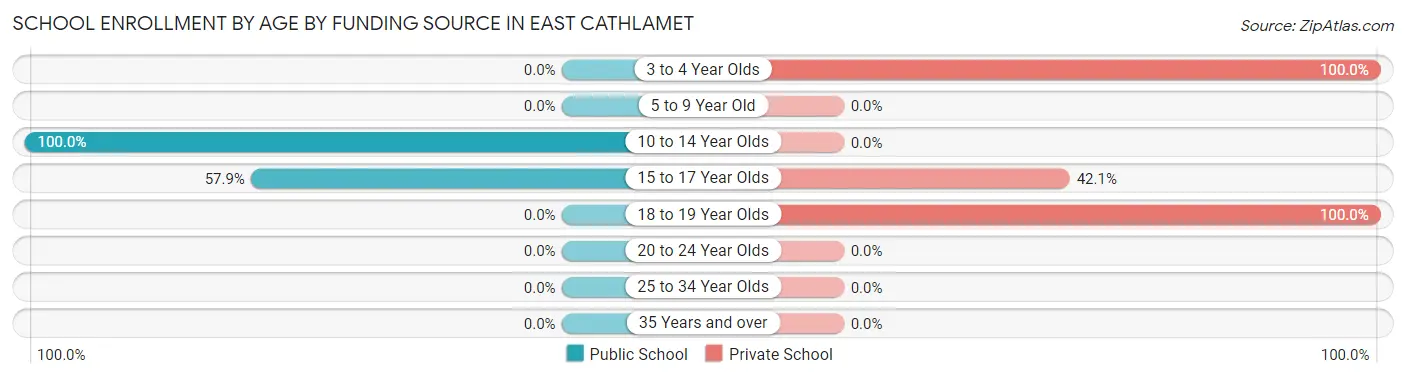
| Age Bracket | Public School | Private School |
| 3 to 4 Year Olds | 0 (0.0%) | 9 (100.0%) |
| 5 to 9 Year Old | 0 (0.0%) | 0 (0.0%) |
| 10 to 14 Year Olds | 68 (100.0%) | 0 (0.0%) |
| 15 to 17 Year Olds | 11 (57.9%) | 8 (42.1%) |
| 18 to 19 Year Olds | 0 (0.0%) | 14 (100.0%) |
| 20 to 24 Year Olds | 0 (0.0%) | 0 (0.0%) |
| 25 to 34 Year Olds | 0 (0.0%) | 0 (0.0%) |
| 35 Years and over | 0 (0.0%) | 0 (0.0%) |
| Total | 79 (71.8%) | 31 (28.2%) |
Educational Attainment by Field of Study in East Cathlamet
Science & technology (24 | 34.8%), education (20 | 29.0%), literature & languages (14 | 20.3%), and liberal arts & history (11 | 15.9%) are the most common fields of study among 69 individuals in East Cathlamet who have obtained a bachelor's degree or higher.
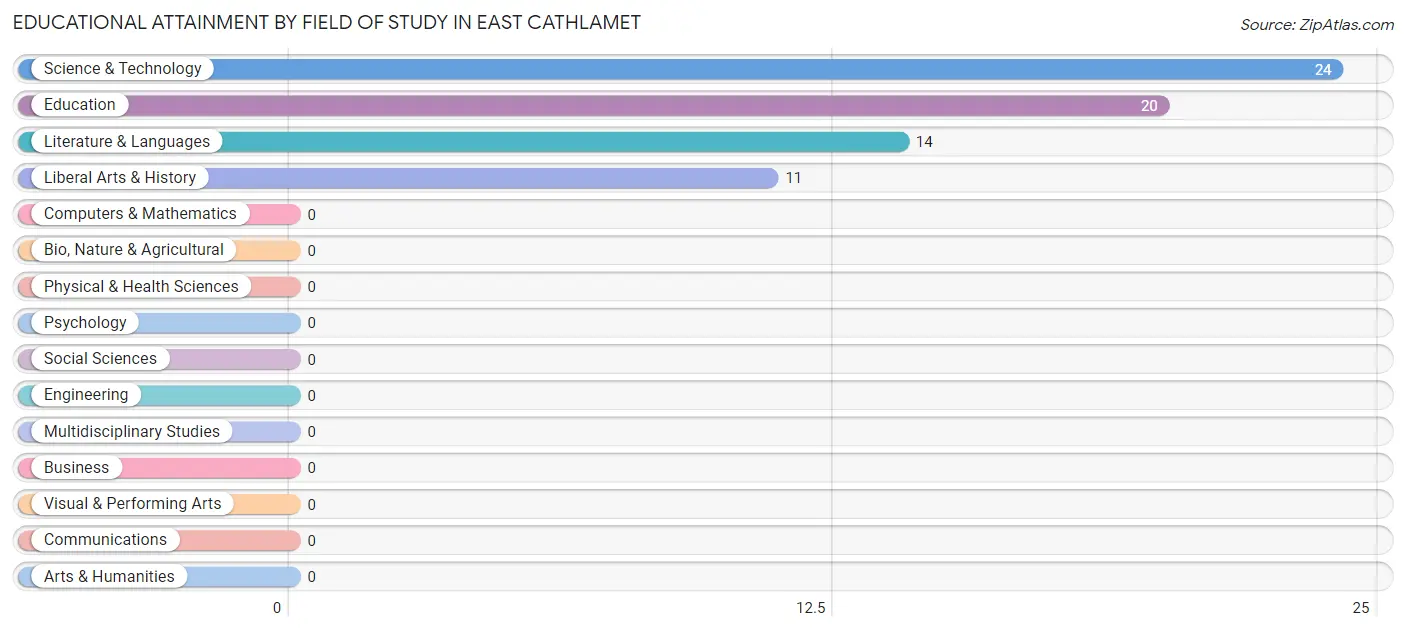
| Field of Study | # Graduates | % Graduates |
| Computers & Mathematics | 0 | 0.0% |
| Bio, Nature & Agricultural | 0 | 0.0% |
| Physical & Health Sciences | 0 | 0.0% |
| Psychology | 0 | 0.0% |
| Social Sciences | 0 | 0.0% |
| Engineering | 0 | 0.0% |
| Multidisciplinary Studies | 0 | 0.0% |
| Science & Technology | 24 | 34.8% |
| Business | 0 | 0.0% |
| Education | 20 | 29.0% |
| Literature & Languages | 14 | 20.3% |
| Liberal Arts & History | 11 | 15.9% |
| Visual & Performing Arts | 0 | 0.0% |
| Communications | 0 | 0.0% |
| Arts & Humanities | 0 | 0.0% |
| Total | 69 | 100.0% |
Transportation & Commute in East Cathlamet
Vehicle Availability by Sex in East Cathlamet
The most prevalent vehicle ownership categories in East Cathlamet are males with 3 vehicles (41, accounting for 42.7%) and females with 3 vehicles (10, making up 83.7%).
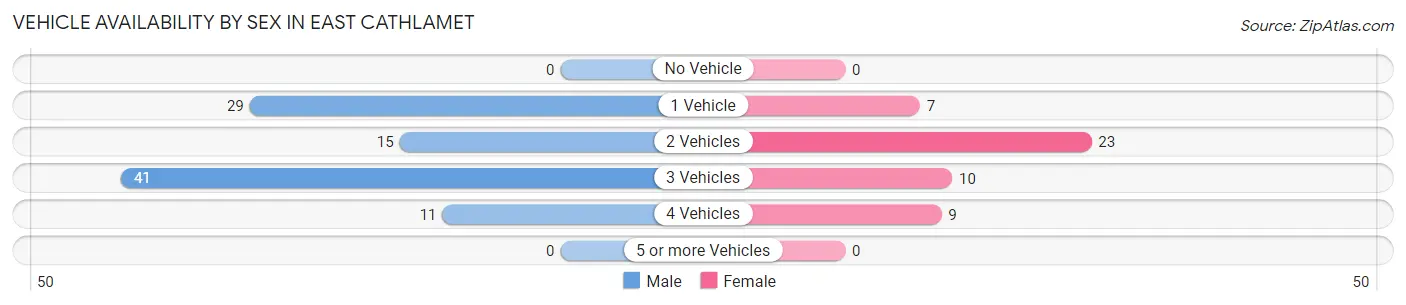
| Vehicles Available | Male | Female |
| No Vehicle | 0 (0.0%) | 0 (0.0%) |
| 1 Vehicle | 29 (30.2%) | 7 (14.3%) |
| 2 Vehicles | 15 (15.6%) | 23 (46.9%) |
| 3 Vehicles | 41 (42.7%) | 10 (20.4%) |
| 4 Vehicles | 11 (11.5%) | 9 (18.4%) |
| 5 or more Vehicles | 0 (0.0%) | 0 (0.0%) |
| Total | 96 (100.0%) | 49 (100.0%) |
Commute Time in East Cathlamet
The most frequently occuring commute durations in East Cathlamet are 5 to 9 minutes (41 commuters, 29.7%), 45 to 59 minutes (30 commuters, 21.7%), and 15 to 19 minutes (29 commuters, 21.0%).
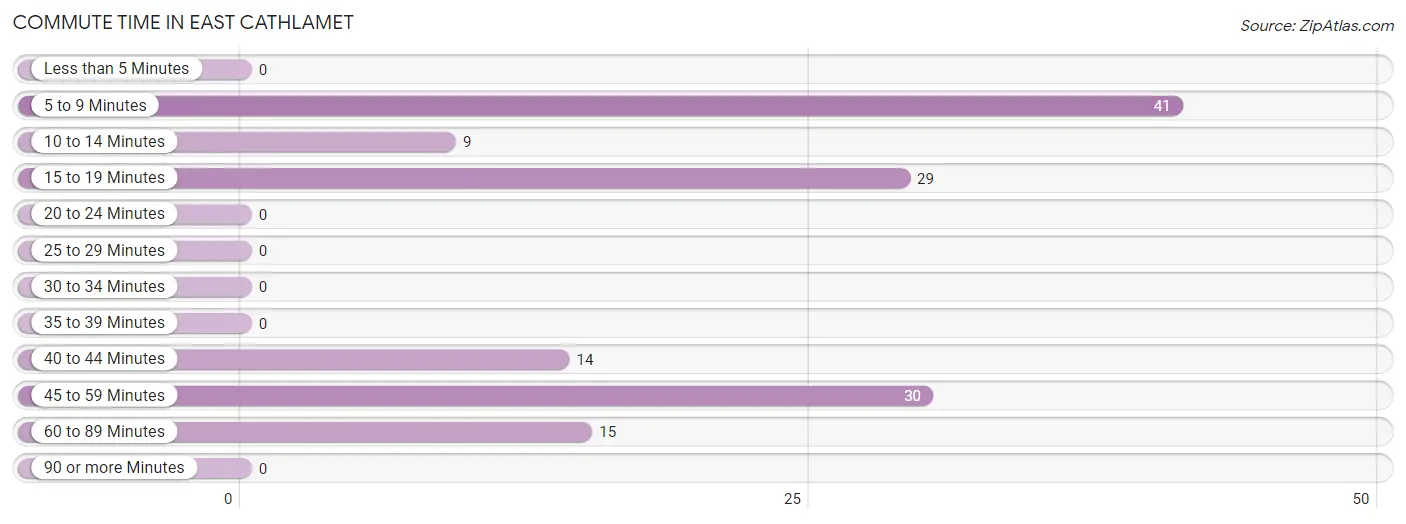
| Commute Time | # Commuters | % Commuters |
| Less than 5 Minutes | 0 | 0.0% |
| 5 to 9 Minutes | 41 | 29.7% |
| 10 to 14 Minutes | 9 | 6.5% |
| 15 to 19 Minutes | 29 | 21.0% |
| 20 to 24 Minutes | 0 | 0.0% |
| 25 to 29 Minutes | 0 | 0.0% |
| 30 to 34 Minutes | 0 | 0.0% |
| 35 to 39 Minutes | 0 | 0.0% |
| 40 to 44 Minutes | 14 | 10.1% |
| 45 to 59 Minutes | 30 | 21.7% |
| 60 to 89 Minutes | 15 | 10.9% |
| 90 or more Minutes | 0 | 0.0% |
Commute Time by Sex in East Cathlamet
The most common commute times in East Cathlamet are 45 to 59 minutes (30 commuters, 31.2%) for males and 5 to 9 minutes (19 commuters, 45.2%) for females.
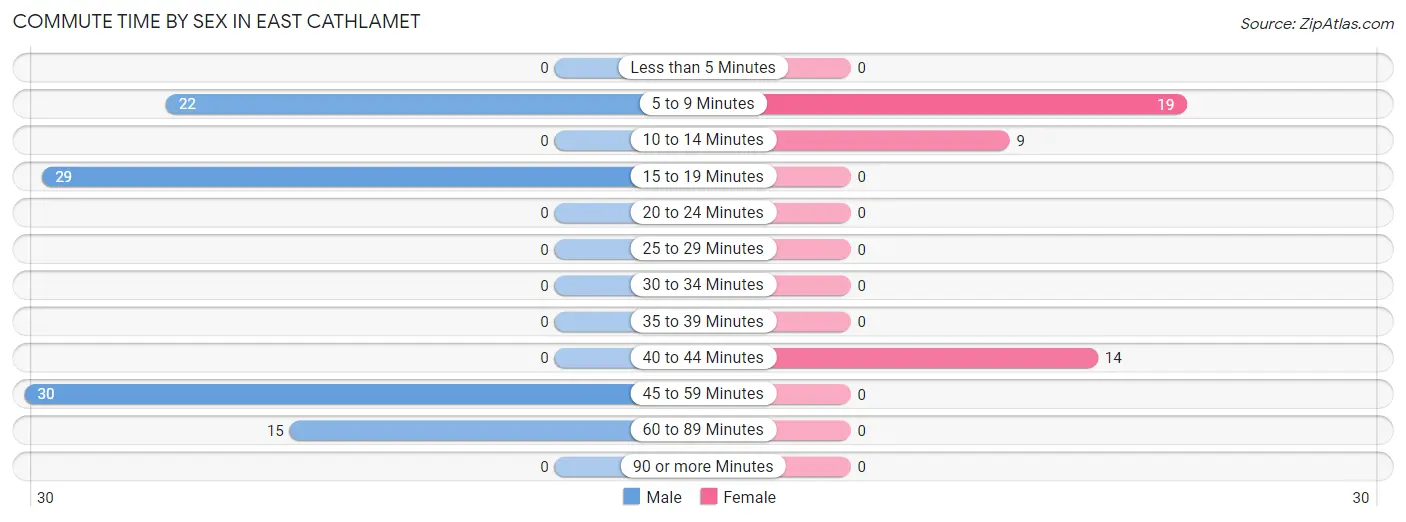
| Commute Time | Male | Female |
| Less than 5 Minutes | 0 (0.0%) | 0 (0.0%) |
| 5 to 9 Minutes | 22 (22.9%) | 19 (45.2%) |
| 10 to 14 Minutes | 0 (0.0%) | 9 (21.4%) |
| 15 to 19 Minutes | 29 (30.2%) | 0 (0.0%) |
| 20 to 24 Minutes | 0 (0.0%) | 0 (0.0%) |
| 25 to 29 Minutes | 0 (0.0%) | 0 (0.0%) |
| 30 to 34 Minutes | 0 (0.0%) | 0 (0.0%) |
| 35 to 39 Minutes | 0 (0.0%) | 0 (0.0%) |
| 40 to 44 Minutes | 0 (0.0%) | 14 (33.3%) |
| 45 to 59 Minutes | 30 (31.2%) | 0 (0.0%) |
| 60 to 89 Minutes | 15 (15.6%) | 0 (0.0%) |
| 90 or more Minutes | 0 (0.0%) | 0 (0.0%) |
Time of Departure to Work by Sex in East Cathlamet
The most frequent times of departure to work in East Cathlamet are 6:30 AM to 6:59 AM (29, 30.2%) for males and 8:30 AM to 8:59 AM (19, 45.2%) for females.
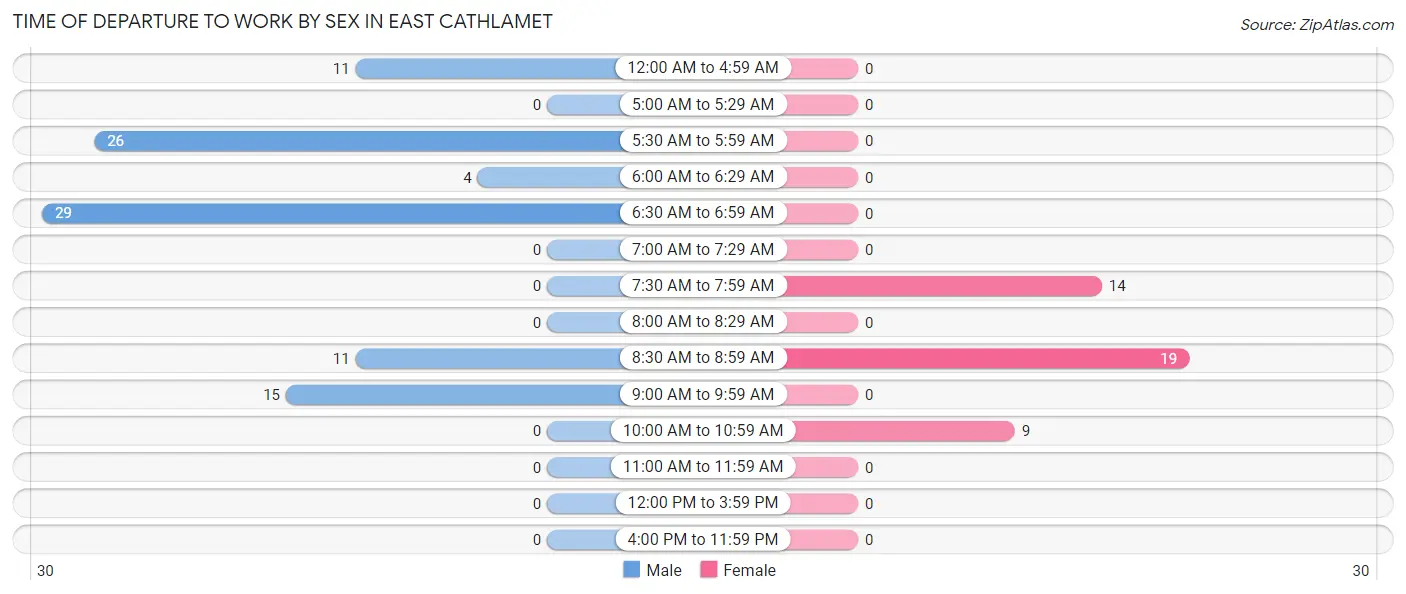
| Time of Departure | Male | Female |
| 12:00 AM to 4:59 AM | 11 (11.5%) | 0 (0.0%) |
| 5:00 AM to 5:29 AM | 0 (0.0%) | 0 (0.0%) |
| 5:30 AM to 5:59 AM | 26 (27.1%) | 0 (0.0%) |
| 6:00 AM to 6:29 AM | 4 (4.2%) | 0 (0.0%) |
| 6:30 AM to 6:59 AM | 29 (30.2%) | 0 (0.0%) |
| 7:00 AM to 7:29 AM | 0 (0.0%) | 0 (0.0%) |
| 7:30 AM to 7:59 AM | 0 (0.0%) | 14 (33.3%) |
| 8:00 AM to 8:29 AM | 0 (0.0%) | 0 (0.0%) |
| 8:30 AM to 8:59 AM | 11 (11.5%) | 19 (45.2%) |
| 9:00 AM to 9:59 AM | 15 (15.6%) | 0 (0.0%) |
| 10:00 AM to 10:59 AM | 0 (0.0%) | 9 (21.4%) |
| 11:00 AM to 11:59 AM | 0 (0.0%) | 0 (0.0%) |
| 12:00 PM to 3:59 PM | 0 (0.0%) | 0 (0.0%) |
| 4:00 PM to 11:59 PM | 0 (0.0%) | 0 (0.0%) |
| Total | 96 (100.0%) | 42 (100.0%) |
Housing Occupancy in East Cathlamet
Occupancy by Ownership in East Cathlamet
Of the total 289 dwellings in East Cathlamet, owner-occupied units account for 278 (96.2%), while renter-occupied units make up 11 (3.8%).
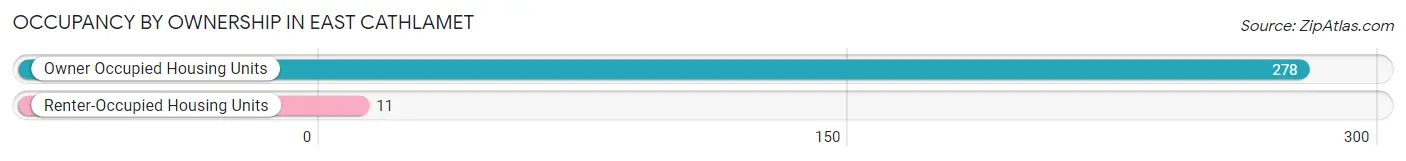
| Occupancy | # Housing Units | % Housing Units |
| Owner Occupied Housing Units | 278 | 96.2% |
| Renter-Occupied Housing Units | 11 | 3.8% |
| Total Occupied Housing Units | 289 | 100.0% |
Occupancy by Household Size in East Cathlamet
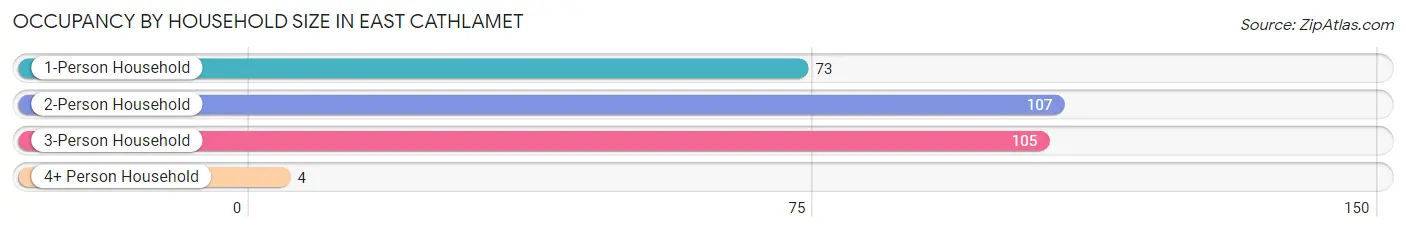
| Household Size | # Housing Units | % Housing Units |
| 1-Person Household | 73 | 25.3% |
| 2-Person Household | 107 | 37.0% |
| 3-Person Household | 105 | 36.3% |
| 4+ Person Household | 4 | 1.4% |
| Total Housing Units | 289 | 100.0% |
Occupancy by Ownership by Household Size in East Cathlamet
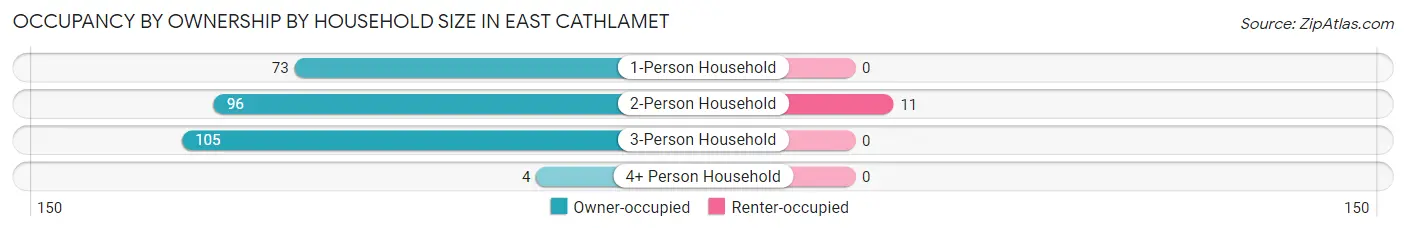
| Household Size | Owner-occupied | Renter-occupied |
| 1-Person Household | 73 (100.0%) | 0 (0.0%) |
| 2-Person Household | 96 (89.7%) | 11 (10.3%) |
| 3-Person Household | 105 (100.0%) | 0 (0.0%) |
| 4+ Person Household | 4 (100.0%) | 0 (0.0%) |
| Total Housing Units | 278 (96.2%) | 11 (3.8%) |
Occupancy by Educational Attainment in East Cathlamet
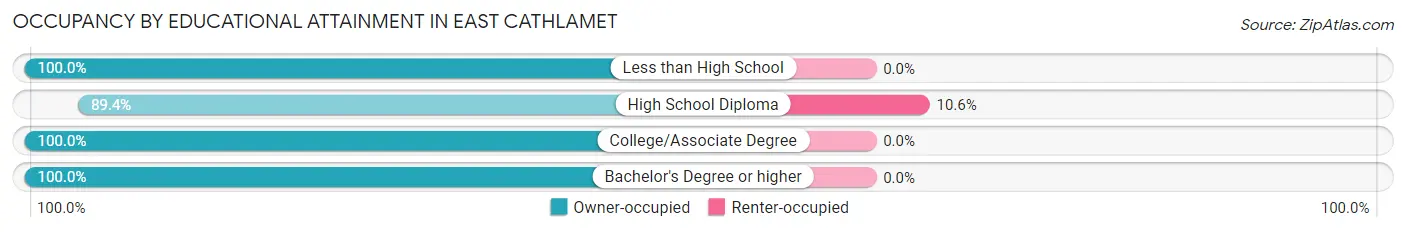
| Household Size | Owner-occupied | Renter-occupied |
| Less than High School | 14 (100.0%) | 0 (0.0%) |
| High School Diploma | 93 (89.4%) | 11 (10.6%) |
| College/Associate Degree | 136 (100.0%) | 0 (0.0%) |
| Bachelor's Degree or higher | 35 (100.0%) | 0 (0.0%) |
Occupancy by Age of Householder in East Cathlamet
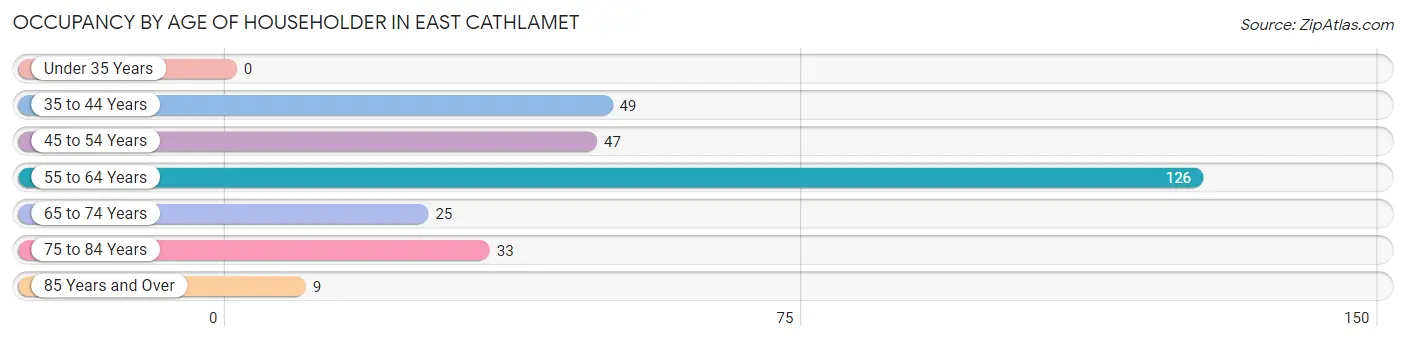
| Age Bracket | # Households | % Households |
| Under 35 Years | 0 | 0.0% |
| 35 to 44 Years | 49 | 17.0% |
| 45 to 54 Years | 47 | 16.3% |
| 55 to 64 Years | 126 | 43.6% |
| 65 to 74 Years | 25 | 8.6% |
| 75 to 84 Years | 33 | 11.4% |
| 85 Years and Over | 9 | 3.1% |
| Total | 289 | 100.0% |
Housing Finances in East Cathlamet
Median Income by Occupancy in East Cathlamet
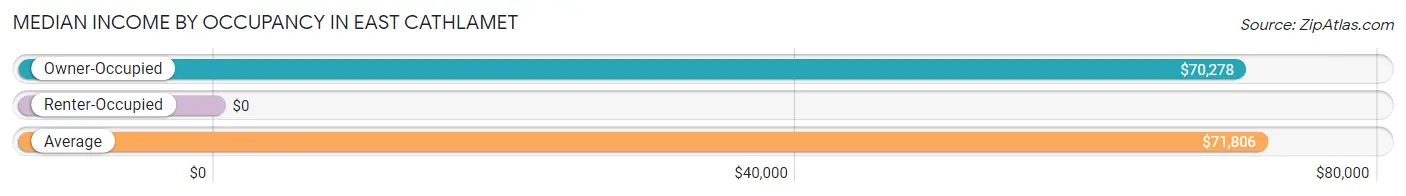
| Occupancy Type | # Households | Median Income |
| Owner-Occupied | 278 (96.2%) | $70,278 |
| Renter-Occupied | 11 (3.8%) | $0 |
| Average | 289 (100.0%) | $71,806 |
Occupancy by Householder Income Bracket in East Cathlamet
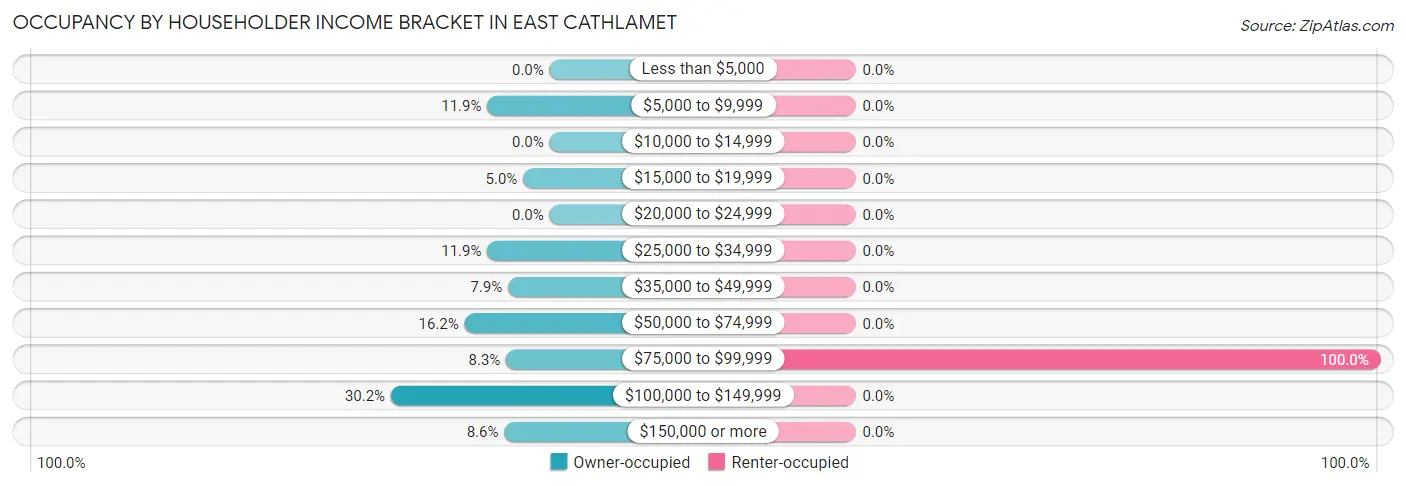
| Income Bracket | Owner-occupied | Renter-occupied |
| Less than $5,000 | 0 (0.0%) | 0 (0.0%) |
| $5,000 to $9,999 | 33 (11.9%) | 0 (0.0%) |
| $10,000 to $14,999 | 0 (0.0%) | 0 (0.0%) |
| $15,000 to $19,999 | 14 (5.0%) | 0 (0.0%) |
| $20,000 to $24,999 | 0 (0.0%) | 0 (0.0%) |
| $25,000 to $34,999 | 33 (11.9%) | 0 (0.0%) |
| $35,000 to $49,999 | 22 (7.9%) | 0 (0.0%) |
| $50,000 to $74,999 | 45 (16.2%) | 0 (0.0%) |
| $75,000 to $99,999 | 23 (8.3%) | 11 (100.0%) |
| $100,000 to $149,999 | 84 (30.2%) | 0 (0.0%) |
| $150,000 or more | 24 (8.6%) | 0 (0.0%) |
| Total | 278 (100.0%) | 11 (100.0%) |
Monthly Housing Cost Tiers in East Cathlamet
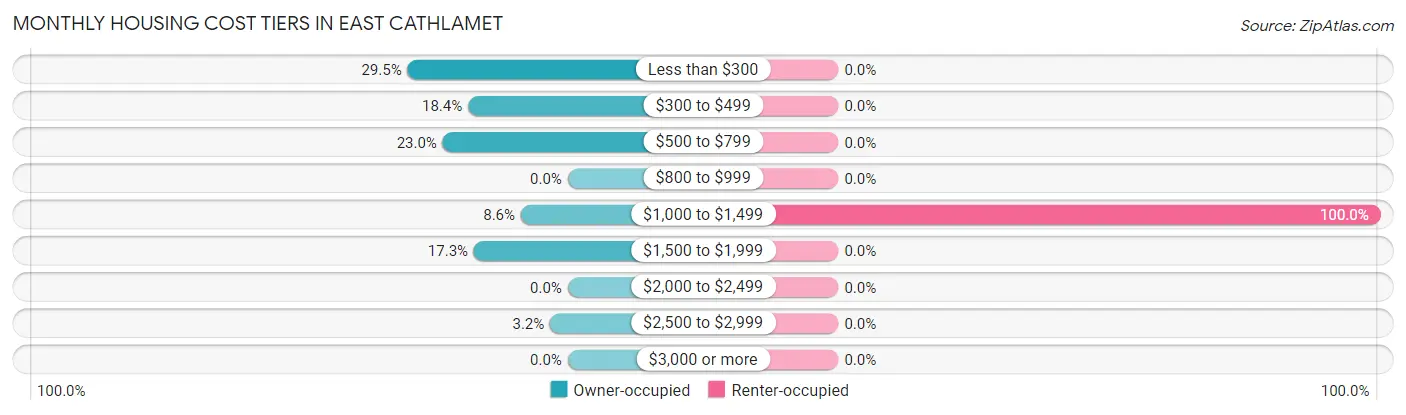
| Monthly Cost | Owner-occupied | Renter-occupied |
| Less than $300 | 82 (29.5%) | 0 (0.0%) |
| $300 to $499 | 51 (18.3%) | 0 (0.0%) |
| $500 to $799 | 64 (23.0%) | 0 (0.0%) |
| $800 to $999 | 0 (0.0%) | 0 (0.0%) |
| $1,000 to $1,499 | 24 (8.6%) | 11 (100.0%) |
| $1,500 to $1,999 | 48 (17.3%) | 0 (0.0%) |
| $2,000 to $2,499 | 0 (0.0%) | 0 (0.0%) |
| $2,500 to $2,999 | 9 (3.2%) | 0 (0.0%) |
| $3,000 or more | 0 (0.0%) | 0 (0.0%) |
| Total | 278 (100.0%) | 11 (100.0%) |
Physical Housing Characteristics in East Cathlamet
Housing Structures in East Cathlamet
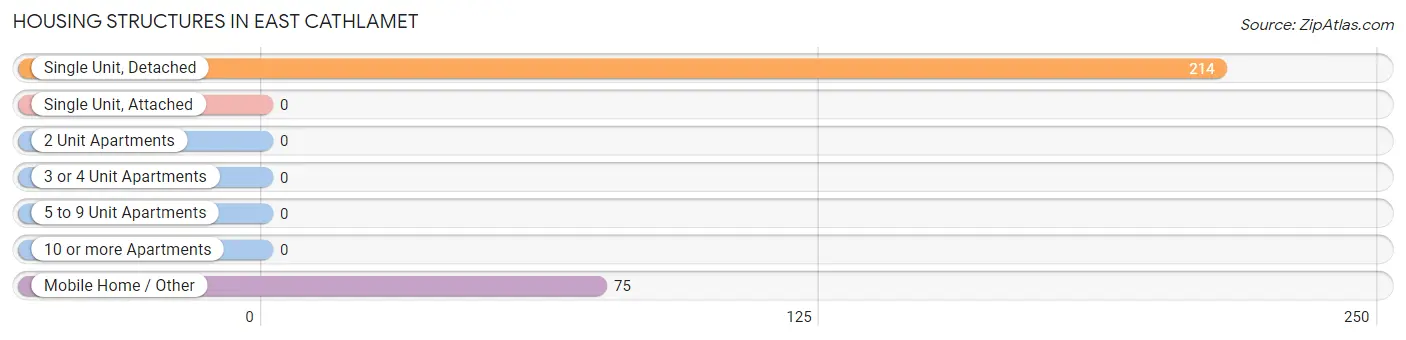
| Structure Type | # Housing Units | % Housing Units |
| Single Unit, Detached | 214 | 74.1% |
| Single Unit, Attached | 0 | 0.0% |
| 2 Unit Apartments | 0 | 0.0% |
| 3 or 4 Unit Apartments | 0 | 0.0% |
| 5 to 9 Unit Apartments | 0 | 0.0% |
| 10 or more Apartments | 0 | 0.0% |
| Mobile Home / Other | 75 | 26.0% |
| Total | 289 | 100.0% |
Housing Structures by Occupancy in East Cathlamet
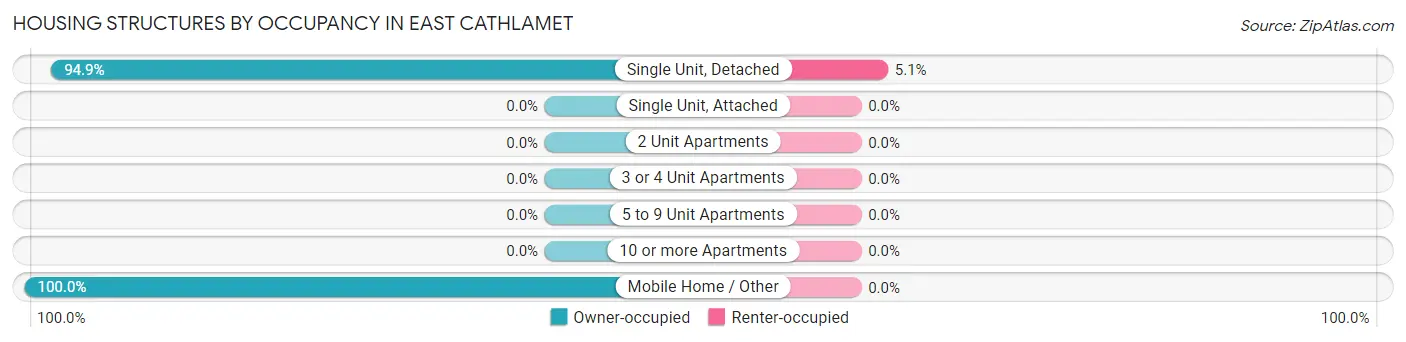
| Structure Type | Owner-occupied | Renter-occupied |
| Single Unit, Detached | 203 (94.9%) | 11 (5.1%) |
| Single Unit, Attached | 0 (0.0%) | 0 (0.0%) |
| 2 Unit Apartments | 0 (0.0%) | 0 (0.0%) |
| 3 or 4 Unit Apartments | 0 (0.0%) | 0 (0.0%) |
| 5 to 9 Unit Apartments | 0 (0.0%) | 0 (0.0%) |
| 10 or more Apartments | 0 (0.0%) | 0 (0.0%) |
| Mobile Home / Other | 75 (100.0%) | 0 (0.0%) |
| Total | 278 (96.2%) | 11 (3.8%) |
Housing Structures by Number of Rooms in East Cathlamet
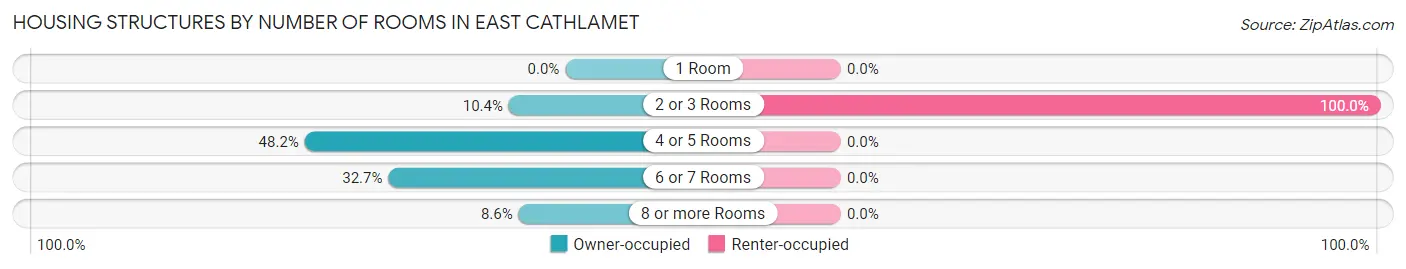
| Number of Rooms | Owner-occupied | Renter-occupied |
| 1 Room | 0 (0.0%) | 0 (0.0%) |
| 2 or 3 Rooms | 29 (10.4%) | 11 (100.0%) |
| 4 or 5 Rooms | 134 (48.2%) | 0 (0.0%) |
| 6 or 7 Rooms | 91 (32.7%) | 0 (0.0%) |
| 8 or more Rooms | 24 (8.6%) | 0 (0.0%) |
| Total | 278 (100.0%) | 11 (100.0%) |
Housing Structure by Heating Type in East Cathlamet
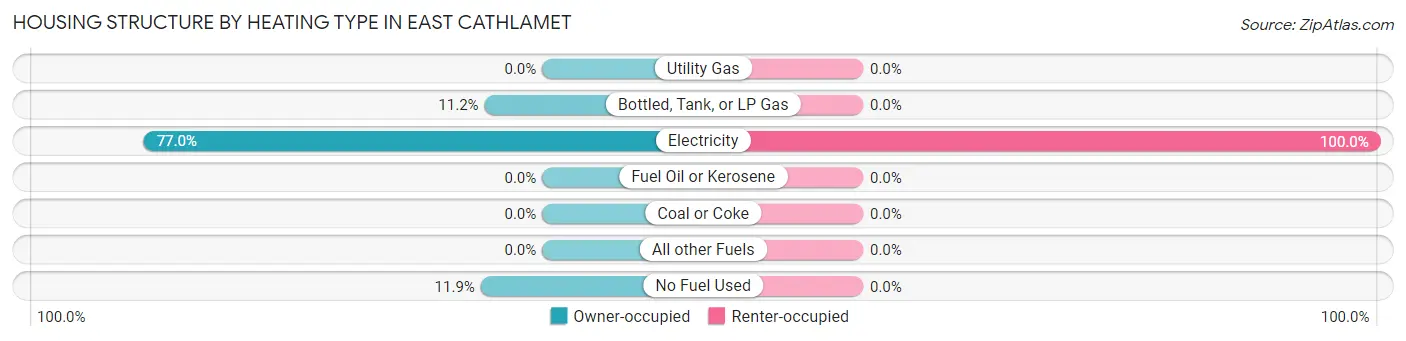
| Heating Type | Owner-occupied | Renter-occupied |
| Utility Gas | 0 (0.0%) | 0 (0.0%) |
| Bottled, Tank, or LP Gas | 31 (11.2%) | 0 (0.0%) |
| Electricity | 214 (77.0%) | 11 (100.0%) |
| Fuel Oil or Kerosene | 0 (0.0%) | 0 (0.0%) |
| Coal or Coke | 0 (0.0%) | 0 (0.0%) |
| All other Fuels | 0 (0.0%) | 0 (0.0%) |
| No Fuel Used | 33 (11.9%) | 0 (0.0%) |
| Total | 278 (100.0%) | 11 (100.0%) |
Household Vehicle Usage in East Cathlamet
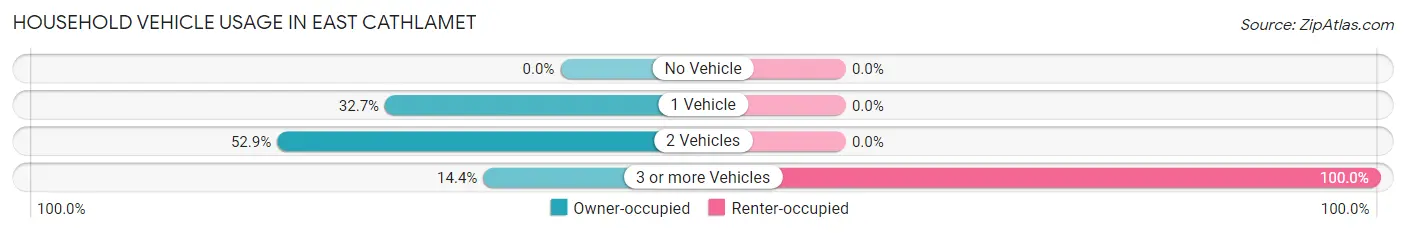
| Vehicles per Household | Owner-occupied | Renter-occupied |
| No Vehicle | 0 (0.0%) | 0 (0.0%) |
| 1 Vehicle | 91 (32.7%) | 0 (0.0%) |
| 2 Vehicles | 147 (52.9%) | 0 (0.0%) |
| 3 or more Vehicles | 40 (14.4%) | 11 (100.0%) |
| Total | 278 (100.0%) | 11 (100.0%) |
Real Estate & Mortgages in East Cathlamet
Real Estate and Mortgage Overview in East Cathlamet
| Characteristic | Without Mortgage | With Mortgage |
| Housing Units | 197 | 81 |
| Median Property Value | - | - |
| Median Household Income | $91,518 | $0 |
| Monthly Housing Costs | $432 | $0 |
| Real Estate Taxes | - | - |
Property Value by Mortgage Status in East Cathlamet
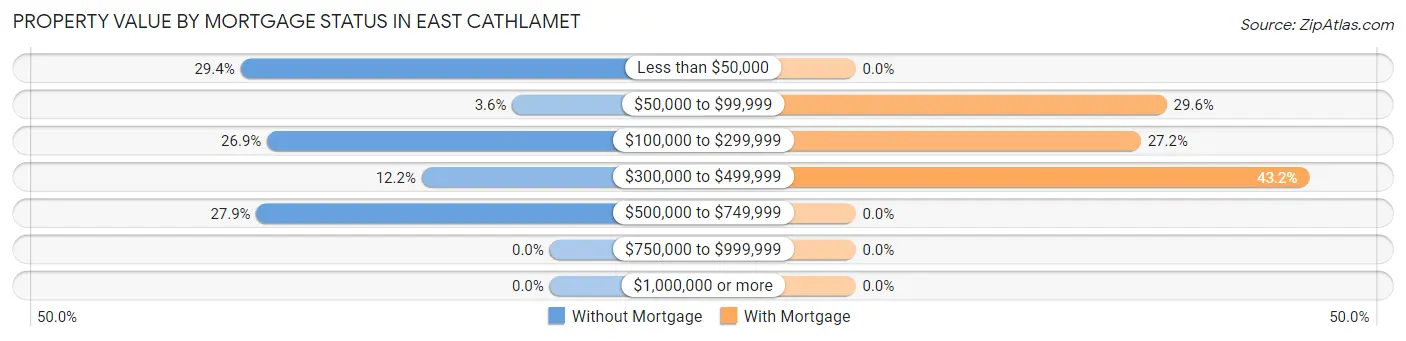
| Property Value | Without Mortgage | With Mortgage |
| Less than $50,000 | 58 (29.4%) | 0 (0.0%) |
| $50,000 to $99,999 | 7 (3.5%) | 24 (29.6%) |
| $100,000 to $299,999 | 53 (26.9%) | 22 (27.2%) |
| $300,000 to $499,999 | 24 (12.2%) | 35 (43.2%) |
| $500,000 to $749,999 | 55 (27.9%) | 0 (0.0%) |
| $750,000 to $999,999 | 0 (0.0%) | 0 (0.0%) |
| $1,000,000 or more | 0 (0.0%) | 0 (0.0%) |
| Total | 197 (100.0%) | 81 (100.0%) |
Household Income by Mortgage Status in East Cathlamet
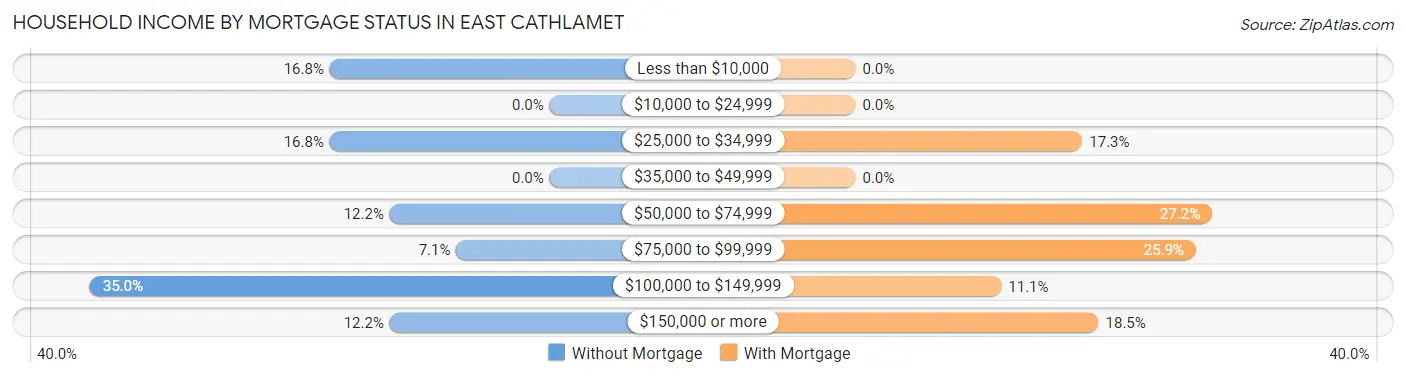
| Household Income | Without Mortgage | With Mortgage |
| Less than $10,000 | 33 (16.8%) | 0 (0.0%) |
| $10,000 to $24,999 | 0 (0.0%) | 0 (0.0%) |
| $25,000 to $34,999 | 33 (16.8%) | 14 (17.3%) |
| $35,000 to $49,999 | 0 (0.0%) | 0 (0.0%) |
| $50,000 to $74,999 | 24 (12.2%) | 22 (27.2%) |
| $75,000 to $99,999 | 14 (7.1%) | 21 (25.9%) |
| $100,000 to $149,999 | 69 (35.0%) | 9 (11.1%) |
| $150,000 or more | 24 (12.2%) | 15 (18.5%) |
| Total | 197 (100.0%) | 81 (100.0%) |
Property Value to Household Income Ratio in East Cathlamet
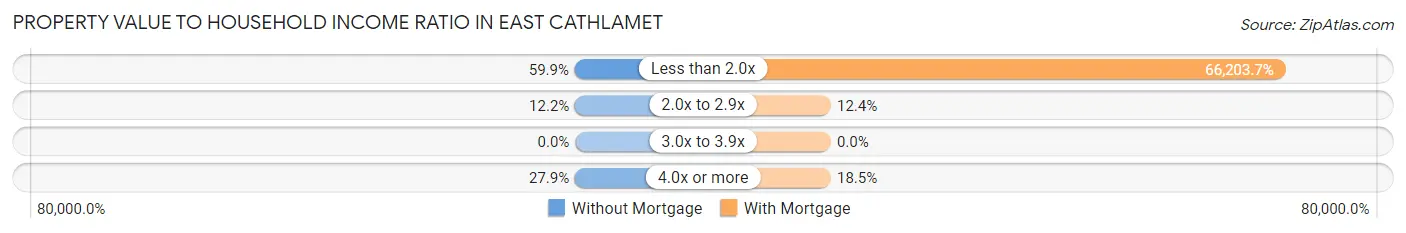
| Value-to-Income Ratio | Without Mortgage | With Mortgage |
| Less than 2.0x | 118 (59.9%) | 53,625 (66,203.7%) |
| 2.0x to 2.9x | 24 (12.2%) | 10 (12.3%) |
| 3.0x to 3.9x | 0 (0.0%) | 0 (0.0%) |
| 4.0x or more | 55 (27.9%) | 15 (18.5%) |
| Total | 197 (100.0%) | 81 (100.0%) |
Real Estate Taxes by Mortgage Status in East Cathlamet
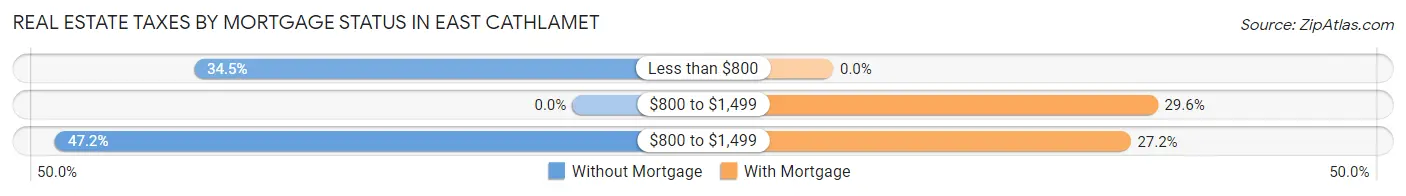
| Property Taxes | Without Mortgage | With Mortgage |
| Less than $800 | 68 (34.5%) | 0 (0.0%) |
| $800 to $1,499 | 0 (0.0%) | 24 (29.6%) |
| $800 to $1,499 | 93 (47.2%) | 22 (27.2%) |
| Total | 197 (100.0%) | 81 (100.0%) |
Health & Disability in East Cathlamet
Health Insurance Coverage by Age in East Cathlamet
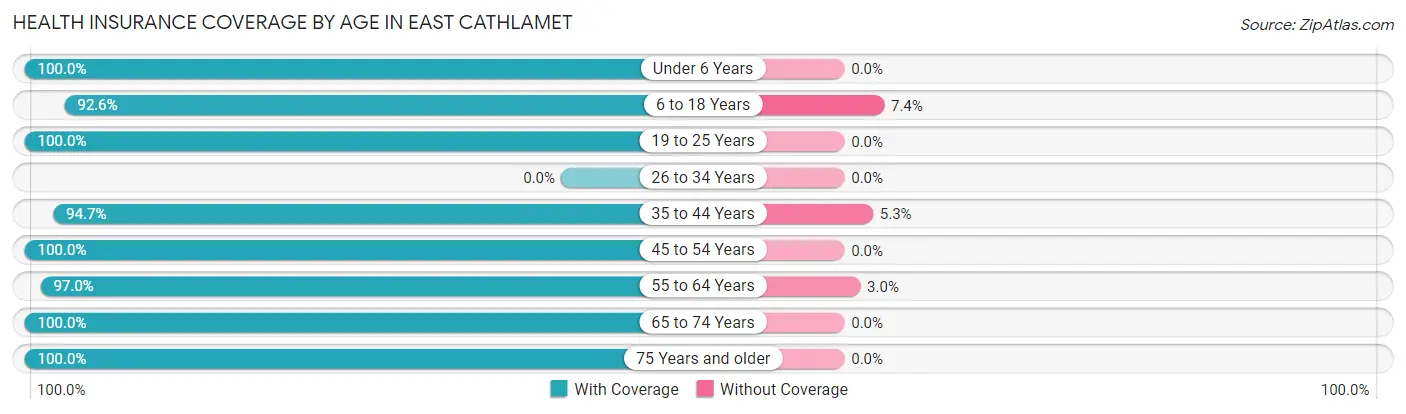
| Age Bracket | With Coverage | Without Coverage |
| Under 6 Years | 9 (100.0%) | 0 (0.0%) |
| 6 to 18 Years | 100 (92.6%) | 8 (7.4%) |
| 19 to 25 Years | 31 (100.0%) | 0 (0.0%) |
| 26 to 34 Years | 0 (0.0%) | 0 (0.0%) |
| 35 to 44 Years | 71 (94.7%) | 4 (5.3%) |
| 45 to 54 Years | 97 (100.0%) | 0 (0.0%) |
| 55 to 64 Years | 131 (97.0%) | 4 (3.0%) |
| 65 to 74 Years | 94 (100.0%) | 0 (0.0%) |
| 75 Years and older | 71 (100.0%) | 0 (0.0%) |
| Total | 604 (97.4%) | 16 (2.6%) |
Health Insurance Coverage by Citizenship Status in East Cathlamet
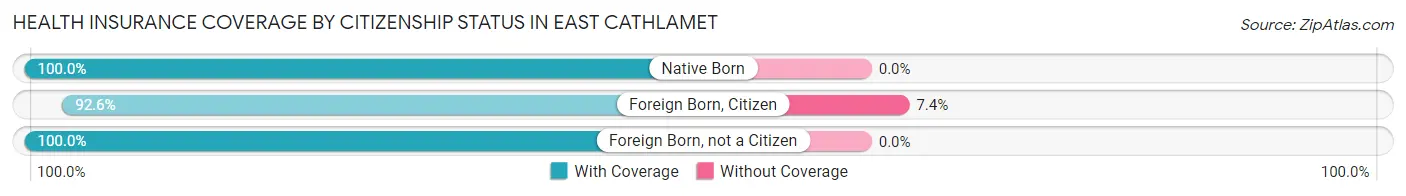
| Citizenship Status | With Coverage | Without Coverage |
| Native Born | 9 (100.0%) | 0 (0.0%) |
| Foreign Born, Citizen | 100 (92.6%) | 8 (7.4%) |
| Foreign Born, not a Citizen | 31 (100.0%) | 0 (0.0%) |
Health Insurance Coverage by Household Income in East Cathlamet
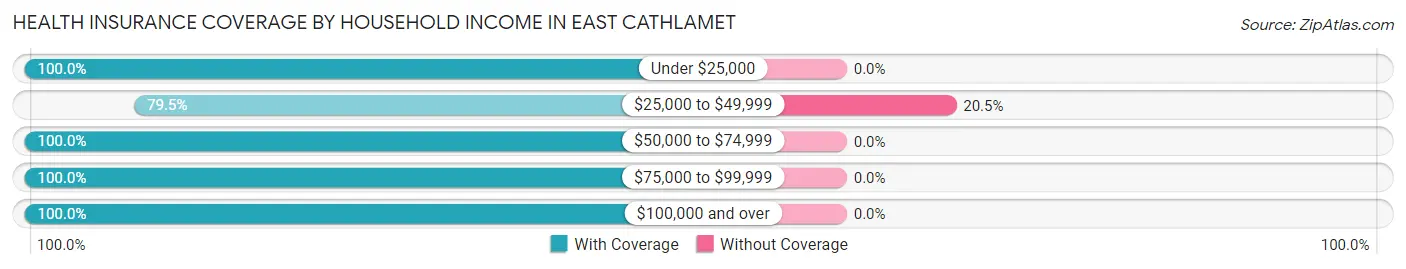
| Household Income | With Coverage | Without Coverage |
| Under $25,000 | 165 (100.0%) | 0 (0.0%) |
| $25,000 to $49,999 | 62 (79.5%) | 16 (20.5%) |
| $50,000 to $74,999 | 113 (100.0%) | 0 (0.0%) |
| $75,000 to $99,999 | 80 (100.0%) | 0 (0.0%) |
| $100,000 and over | 184 (100.0%) | 0 (0.0%) |
Public vs Private Health Insurance Coverage by Age in East Cathlamet
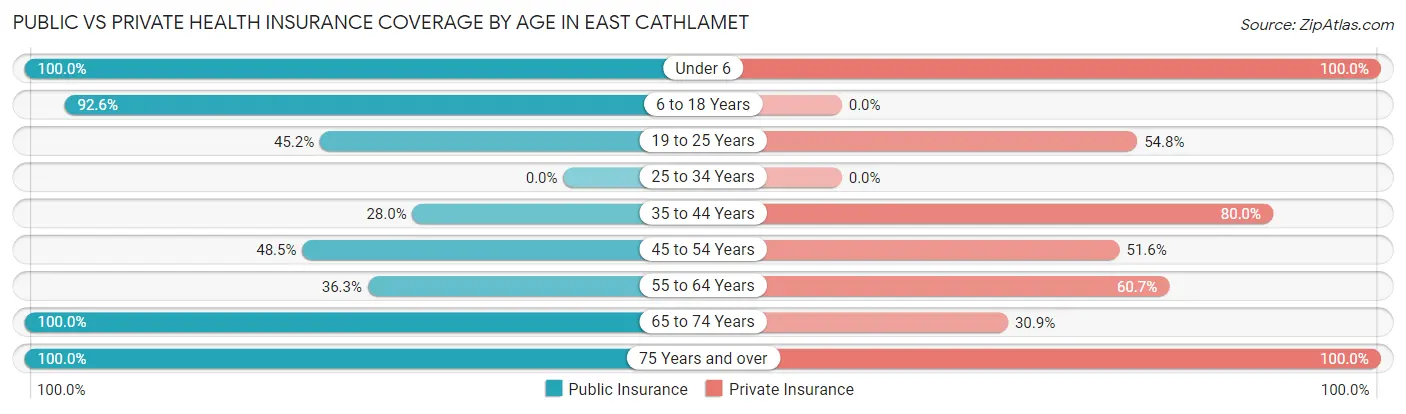
| Age Bracket | Public Insurance | Private Insurance |
| Under 6 | 9 (100.0%) | 9 (100.0%) |
| 6 to 18 Years | 100 (92.6%) | 0 (0.0%) |
| 19 to 25 Years | 14 (45.2%) | 17 (54.8%) |
| 25 to 34 Years | 0 (0.0%) | 0 (0.0%) |
| 35 to 44 Years | 21 (28.0%) | 60 (80.0%) |
| 45 to 54 Years | 47 (48.4%) | 50 (51.5%) |
| 55 to 64 Years | 49 (36.3%) | 82 (60.7%) |
| 65 to 74 Years | 94 (100.0%) | 29 (30.8%) |
| 75 Years and over | 71 (100.0%) | 71 (100.0%) |
| Total | 405 (65.3%) | 318 (51.3%) |
Disability Status by Sex by Age in East Cathlamet
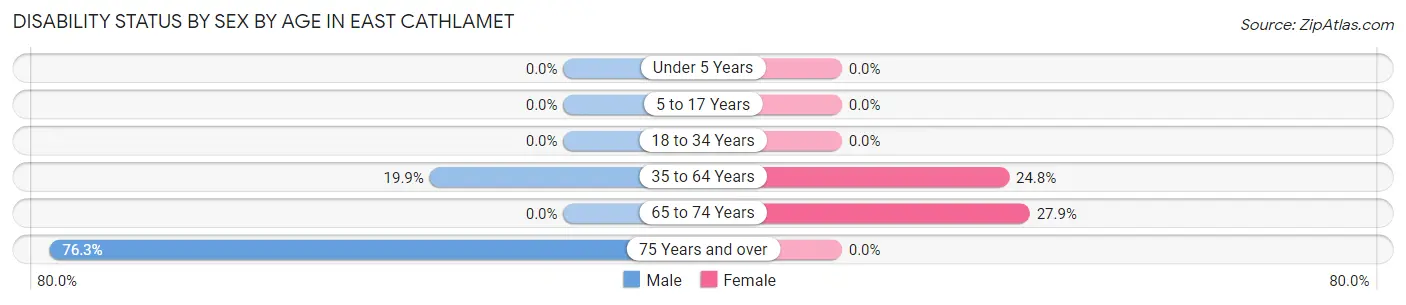
| Age Bracket | Male | Female |
| Under 5 Years | 0 (0.0%) | 0 (0.0%) |
| 5 to 17 Years | 0 (0.0%) | 0 (0.0%) |
| 18 to 34 Years | 0 (0.0%) | 0 (0.0%) |
| 35 to 64 Years | 29 (19.9%) | 40 (24.8%) |
| 65 to 74 Years | 0 (0.0%) | 12 (27.9%) |
| 75 Years and over | 29 (76.3%) | 0 (0.0%) |
Disability Class by Sex by Age in East Cathlamet
Disability Class: Hearing Difficulty
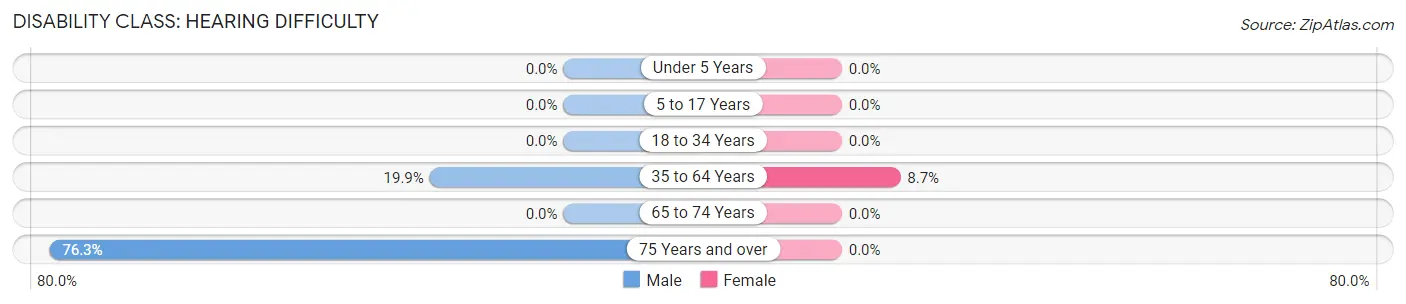
| Age Bracket | Male | Female |
| Under 5 Years | 0 (0.0%) | 0 (0.0%) |
| 5 to 17 Years | 0 (0.0%) | 0 (0.0%) |
| 18 to 34 Years | 0 (0.0%) | 0 (0.0%) |
| 35 to 64 Years | 29 (19.9%) | 14 (8.7%) |
| 65 to 74 Years | 0 (0.0%) | 0 (0.0%) |
| 75 Years and over | 29 (76.3%) | 0 (0.0%) |
Disability Class: Vision Difficulty
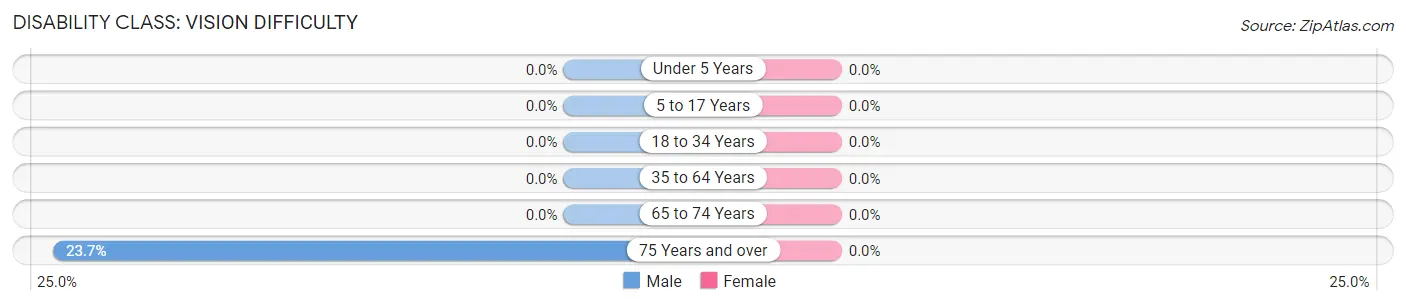
| Age Bracket | Male | Female |
| Under 5 Years | 0 (0.0%) | 0 (0.0%) |
| 5 to 17 Years | 0 (0.0%) | 0 (0.0%) |
| 18 to 34 Years | 0 (0.0%) | 0 (0.0%) |
| 35 to 64 Years | 0 (0.0%) | 0 (0.0%) |
| 65 to 74 Years | 0 (0.0%) | 0 (0.0%) |
| 75 Years and over | 9 (23.7%) | 0 (0.0%) |
Disability Class: Cognitive Difficulty
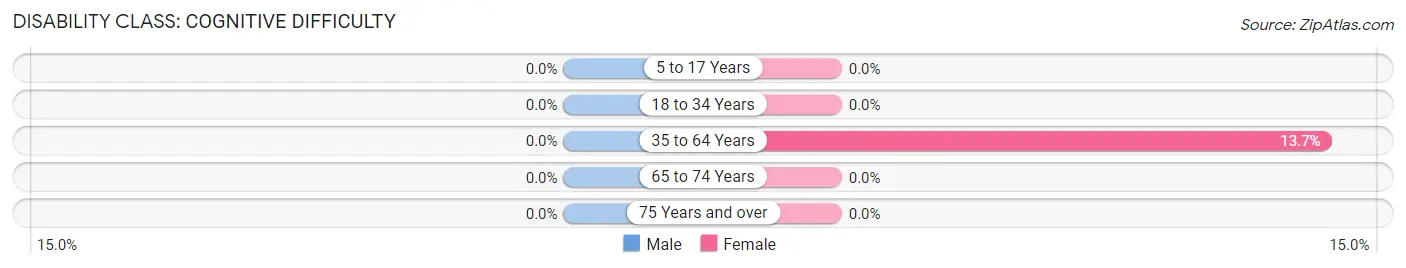
| Age Bracket | Male | Female |
| 5 to 17 Years | 0 (0.0%) | 0 (0.0%) |
| 18 to 34 Years | 0 (0.0%) | 0 (0.0%) |
| 35 to 64 Years | 0 (0.0%) | 22 (13.7%) |
| 65 to 74 Years | 0 (0.0%) | 0 (0.0%) |
| 75 Years and over | 0 (0.0%) | 0 (0.0%) |
Disability Class: Ambulatory Difficulty
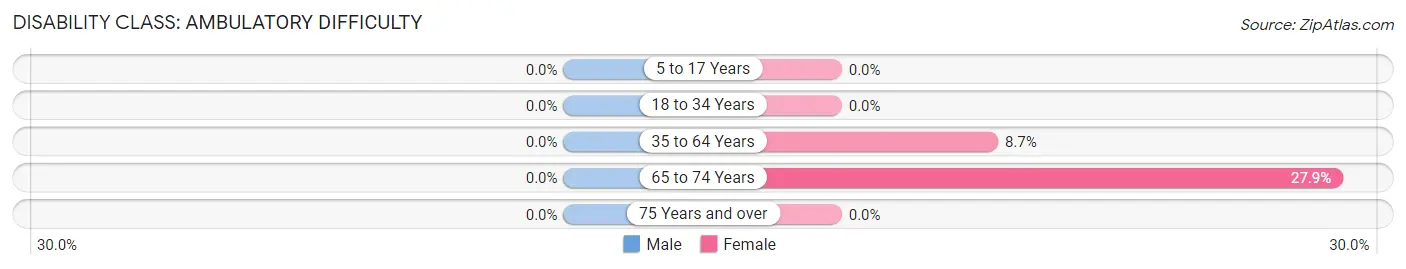
| Age Bracket | Male | Female |
| 5 to 17 Years | 0 (0.0%) | 0 (0.0%) |
| 18 to 34 Years | 0 (0.0%) | 0 (0.0%) |
| 35 to 64 Years | 0 (0.0%) | 14 (8.7%) |
| 65 to 74 Years | 0 (0.0%) | 12 (27.9%) |
| 75 Years and over | 0 (0.0%) | 0 (0.0%) |
Disability Class: Self-Care Difficulty
| Age Bracket | Male | Female |
| 5 to 17 Years | 0 (0.0%) | 0 (0.0%) |
| 18 to 34 Years | 0 (0.0%) | 0 (0.0%) |
| 35 to 64 Years | 0 (0.0%) | 0 (0.0%) |
| 65 to 74 Years | 0 (0.0%) | 0 (0.0%) |
| 75 Years and over | 0 (0.0%) | 0 (0.0%) |
Technology Access in East Cathlamet
Computing Device Access in East Cathlamet
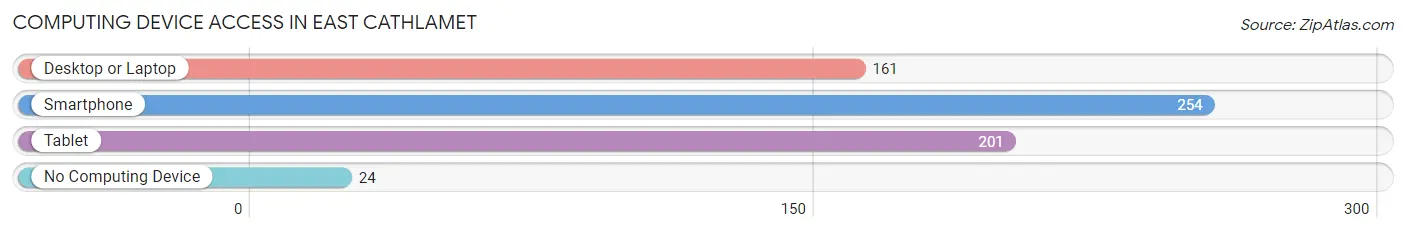
| Device Type | # Households | % Households |
| Desktop or Laptop | 161 | 55.7% |
| Smartphone | 254 | 87.9% |
| Tablet | 201 | 69.6% |
| No Computing Device | 24 | 8.3% |
| Total | 289 | 100.0% |
Internet Access in East Cathlamet
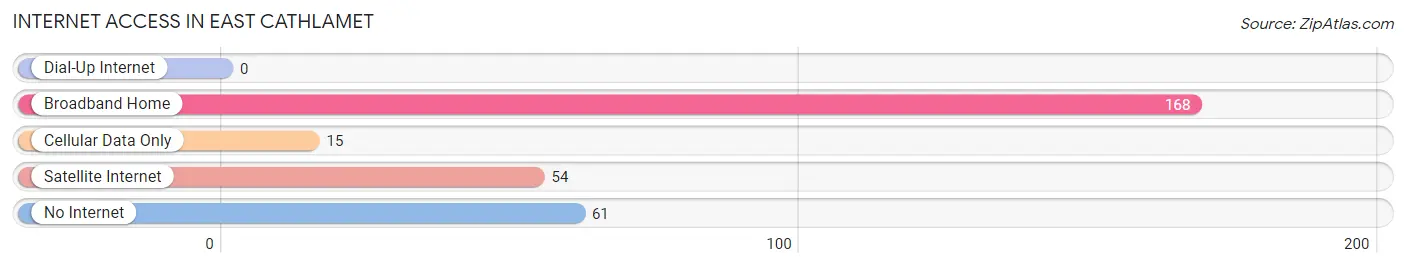
| Internet Type | # Households | % Households |
| Dial-Up Internet | 0 | 0.0% |
| Broadband Home | 168 | 58.1% |
| Cellular Data Only | 15 | 5.2% |
| Satellite Internet | 54 | 18.7% |
| No Internet | 61 | 21.1% |
| Total | 289 | 100.0% |
East Cathlamet Summary
History
East Cathlamet is a small unincorporated community located in Wahkiakum County, Washington, United States. It is situated on the east bank of the Columbia River, across from the city of Cathlamet. The area was first settled in the late 19th century by settlers from the nearby Cathlamet area. The community was originally known as "East Cathlamet Landing" and was a popular spot for fishing and boating.
The first post office in East Cathlamet was established in 1891. The community was officially incorporated in 1895. The town was named after the nearby Cathlamet Indian Tribe, which had inhabited the area for centuries.
East Cathlamet was a popular destination for tourists in the early 20th century. The town was home to several resorts, including the East Cathlamet Hotel, which was built in 1906. The hotel was destroyed by fire in 1915.
In the 1920s, East Cathlamet was a popular spot for salmon fishing. The town was also home to a cannery, which processed salmon for export.
Geography
East Cathlamet is located in Wahkiakum County, Washington, United States. It is situated on the east bank of the Columbia River, across from the city of Cathlamet. The town is located at the intersection of State Route 4 and State Route 409.
The town is surrounded by forests and mountains. The nearby Cascade Mountains provide a scenic backdrop to the town. The nearby Columbia River provides a variety of recreational activities, including fishing, boating, and swimming.
Economy
The economy of East Cathlamet is largely based on tourism and fishing. The town is home to several resorts and restaurants, which cater to tourists and locals alike. The nearby Columbia River provides a variety of recreational activities, including fishing, boating, and swimming.
The town is also home to several small businesses, including a grocery store, a hardware store, and a gas station. The town is also home to a post office and a library.
Demographics
As of the 2010 census, the population of East Cathlamet was 545. The racial makeup of the town was 94.2% White, 0.7% African American, 0.4% Native American, 0.4% Asian, 0.2% Pacific Islander, and 3.1% from other races. The median household income was $37,500.
The town is home to a variety of religious denominations, including Catholic, Lutheran, Methodist, and Baptist. The town is also home to a variety of cultural organizations, including the East Cathlamet Historical Society and the East Cathlamet Arts Council.
Conclusion
East Cathlamet is a small unincorporated community located in Wahkiakum County, Washington, United States. It is situated on the east bank of the Columbia River, across from the city of Cathlamet. The area was first settled in the late 19th century by settlers from the nearby Cathlamet area. The town is home to several resorts and restaurants, which cater to tourists and locals alike. The nearby Columbia River provides a variety of recreational activities, including fishing, boating, and swimming. As of the 2010 census, the population of East Cathlamet was 545. The town is home to a variety of religious denominations, including Catholic, Lutheran, Methodist, and Baptist. The town is also home to a variety of cultural organizations, including the East Cathlamet Historical Society and the East Cathlamet Arts Council.
Common Questions
What is Per Capita Income in East Cathlamet?
Per Capita income in East Cathlamet is $31,049.
What is the Median Family Income in East Cathlamet?
Median Family Income in East Cathlamet is $76,806.
What is the Median Household income in East Cathlamet?
Median Household Income in East Cathlamet is $71,806.
What is Inequality or Gini Index in East Cathlamet?
Inequality or Gini Index in East Cathlamet is 0.36.
What is the Total Population of East Cathlamet?
Total Population of East Cathlamet is 620.
What is the Total Male Population of East Cathlamet?
Total Male Population of East Cathlamet is 321.
What is the Total Female Population of East Cathlamet?
Total Female Population of East Cathlamet is 299.
What is the Ratio of Males per 100 Females in East Cathlamet?
There are 107.36 Males per 100 Females in East Cathlamet.
What is the Ratio of Females per 100 Males in East Cathlamet?
There are 93.15 Females per 100 Males in East Cathlamet.
What is the Median Population Age in East Cathlamet?
Median Population Age in East Cathlamet is 54.3 Years.
What is the Average Family Size in East Cathlamet
Average Family Size in East Cathlamet is 2.6 People.
What is the Average Household Size in East Cathlamet
Average Household Size in East Cathlamet is 2.1 People.
How Large is the Labor Force in East Cathlamet?
There are 149 People in the Labor Forcein in East Cathlamet.
What is the Percentage of People in the Labor Force in East Cathlamet?
28.5% of People are in the Labor Force in East Cathlamet.
What is the Unemployment Rate in East Cathlamet?
Unemployment Rate in East Cathlamet is 2.7%.