Elma, WA Map & Demographics
Elma Map
Elma Overview
$31,024
PER CAPITA INCOME
$84,924
AVG FAMILY INCOME
$64,808
AVG HOUSEHOLD INCOME
20.2%
WAGE / INCOME GAP [ % ]
79.8¢/ $1
WAGE / INCOME GAP [ $ ]
0.40
INEQUALITY / GINI INDEX
3,426
TOTAL POPULATION
1,860
MALE POPULATION
1,566
FEMALE POPULATION
118.77
MALES / 100 FEMALES
84.19
FEMALES / 100 MALES
40.7
MEDIAN AGE
3.5
AVG FAMILY SIZE
2.6
AVG HOUSEHOLD SIZE
1,503
LABOR FORCE [ PEOPLE ]
55.9%
PERCENT IN LABOR FORCE
6.1%
UNEMPLOYMENT RATE
Elma Zip Codes
Elma Area Codes
Income in Elma
Income Overview in Elma
Per Capita Income in Elma is $31,024, while median incomes of families and households are $84,924 and $64,808 respectively.
| Characteristic | Number | Measure |
| Per Capita Income | 3,426 | $31,024 |
| Median Family Income | 762 | $84,924 |
| Mean Family Income | 762 | $91,103 |
| Median Household Income | 1,264 | $64,808 |
| Mean Household Income | 1,264 | $76,161 |
| Income Deficit | 762 | $0 |
| Wage / Income Gap (%) | 3,426 | 20.17% |
| Wage / Income Gap ($) | 3,426 | 79.83¢ per $1 |
| Gini / Inequality Index | 3,426 | 0.40 |
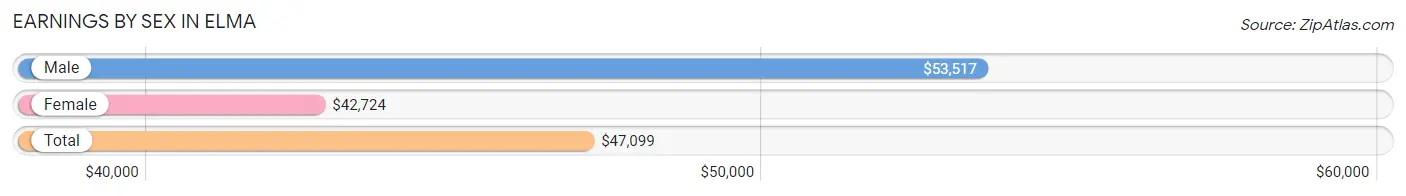
Earnings by Sex in Elma
Average Earnings in Elma are $47,099, $53,517 for men and $42,724 for women, a difference of 20.2%.
| Sex | Number | Average Earnings |
| Male | 872 (60.2%) | $53,517 |
| Female | 577 (39.8%) | $42,724 |
| Total | 1,449 (100.0%) | $47,099 |
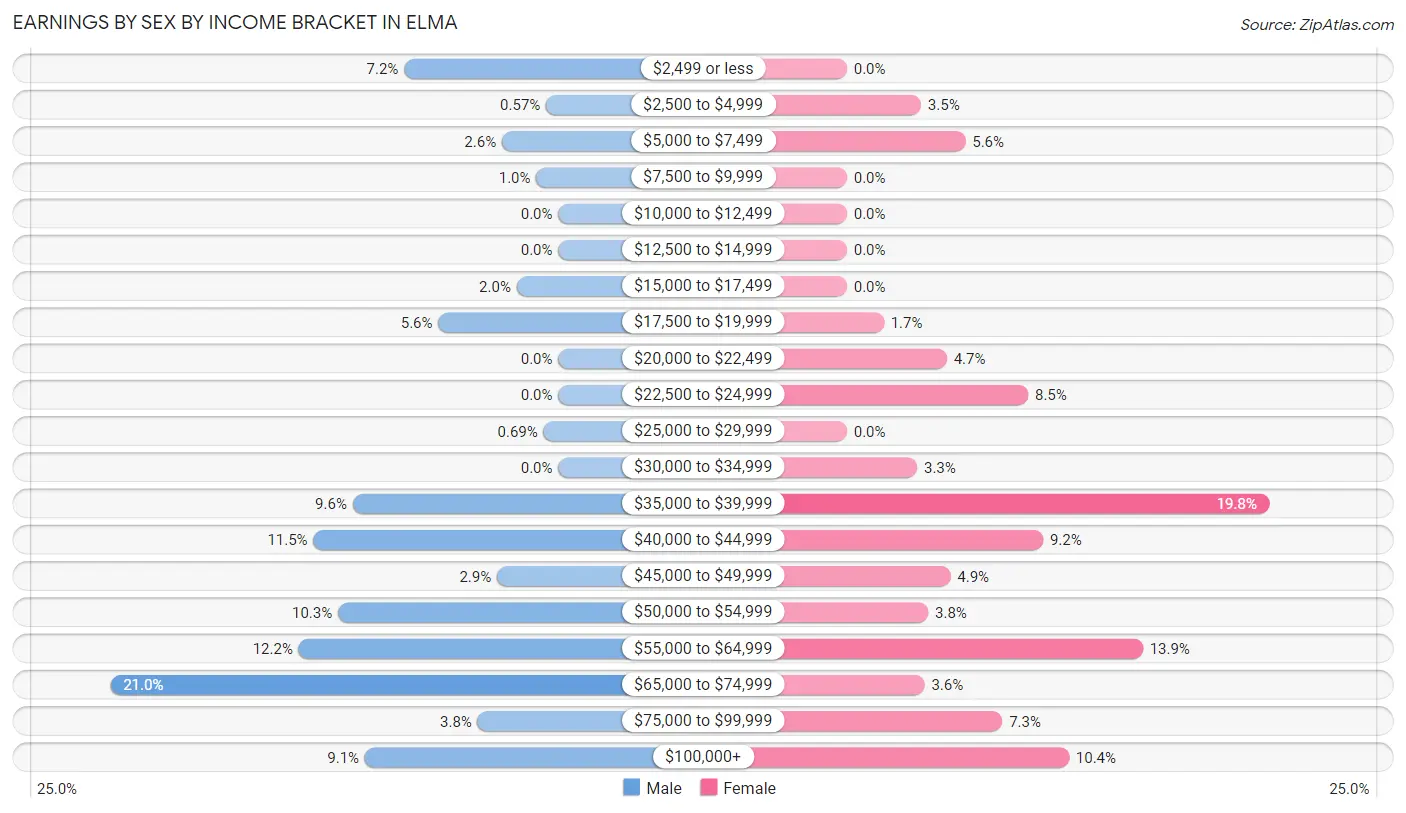
Earnings by Sex by Income Bracket in Elma
The most common earnings brackets in Elma are $65,000 to $74,999 for men (183 | 21.0%) and $35,000 to $39,999 for women (114 | 19.8%).
| Income | Male | Female |
| $2,499 or less | 63 (7.2%) | 0 (0.0%) |
| $2,500 to $4,999 | 5 (0.6%) | 20 (3.5%) |
| $5,000 to $7,499 | 23 (2.6%) | 32 (5.6%) |
| $7,500 to $9,999 | 9 (1.0%) | 0 (0.0%) |
| $10,000 to $12,499 | 0 (0.0%) | 0 (0.0%) |
| $12,500 to $14,999 | 0 (0.0%) | 0 (0.0%) |
| $15,000 to $17,499 | 17 (1.9%) | 0 (0.0%) |
| $17,500 to $19,999 | 49 (5.6%) | 10 (1.7%) |
| $20,000 to $22,499 | 0 (0.0%) | 27 (4.7%) |
| $22,500 to $24,999 | 0 (0.0%) | 49 (8.5%) |
| $25,000 to $29,999 | 6 (0.7%) | 0 (0.0%) |
| $30,000 to $34,999 | 0 (0.0%) | 19 (3.3%) |
| $35,000 to $39,999 | 84 (9.6%) | 114 (19.8%) |
| $40,000 to $44,999 | 100 (11.5%) | 53 (9.2%) |
| $45,000 to $49,999 | 25 (2.9%) | 28 (4.9%) |
| $50,000 to $54,999 | 90 (10.3%) | 22 (3.8%) |
| $55,000 to $64,999 | 106 (12.2%) | 80 (13.9%) |
| $65,000 to $74,999 | 183 (21.0%) | 21 (3.6%) |
| $75,000 to $99,999 | 33 (3.8%) | 42 (7.3%) |
| $100,000+ | 79 (9.1%) | 60 (10.4%) |
| Total | 872 (100.0%) | 577 (100.0%) |
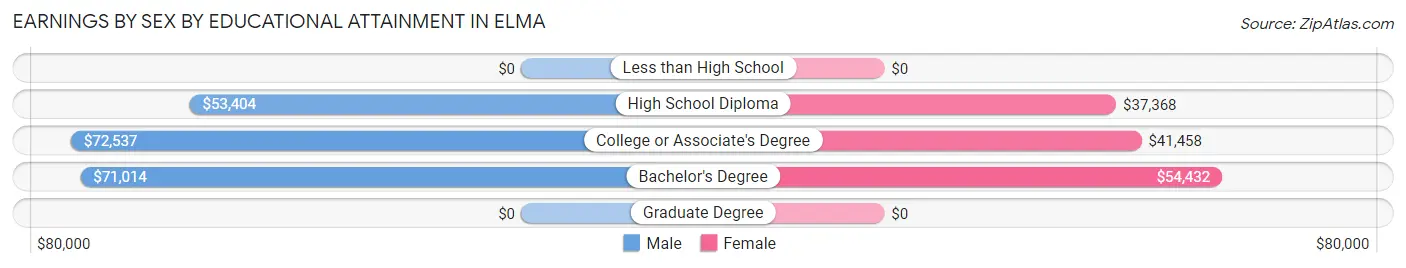
Earnings by Sex by Educational Attainment in Elma
Average earnings in Elma are $54,958 for men and $45,536 for women, a difference of 17.1%. Men with an educational attainment of college or associate's degree enjoy the highest average annual earnings of $72,537, while those with high school diploma education earn the least with $53,404. Women with an educational attainment of bachelor's degree earn the most with the average annual earnings of $54,432, while those with high school diploma education have the smallest earnings of $37,368.
| Educational Attainment | Male Income | Female Income |
| Less than High School | - | - |
| High School Diploma | $53,404 | $37,368 |
| College or Associate's Degree | $72,537 | $41,458 |
| Bachelor's Degree | $71,014 | $54,432 |
| Graduate Degree | - | - |
| Total | $54,958 | $45,536 |
Family Income in Elma
Family Income Brackets in Elma
According to the Elma family income data, there are 197 families falling into the $100,000 to $149,999 income range, which is the most common income bracket and makes up 25.9% of all families.
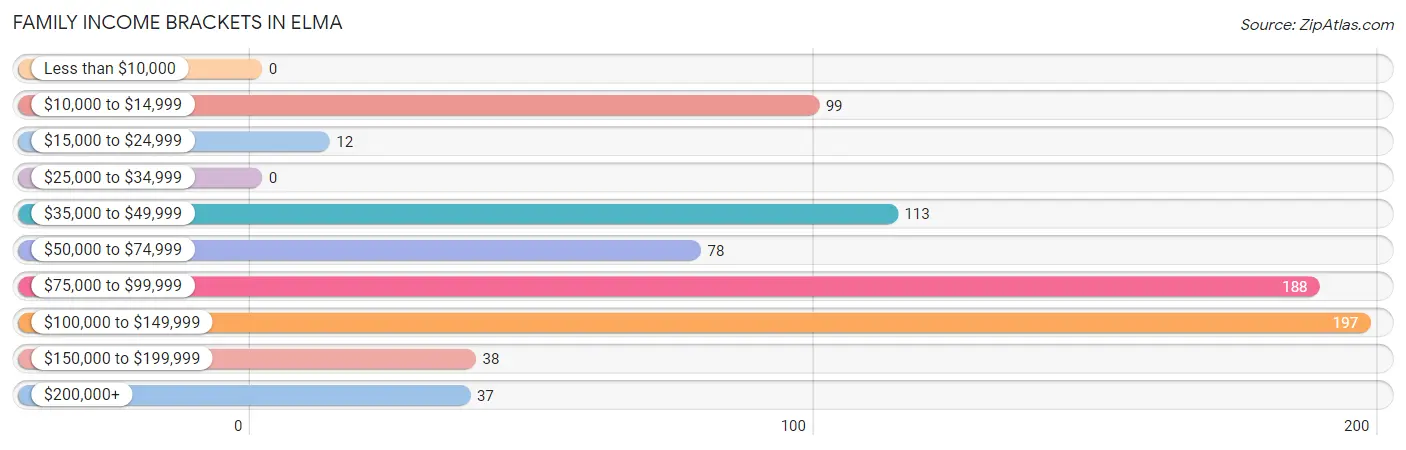
| Income Bracket | # Families | % Families |
| Less than $10,000 | 0 | 0.0% |
| $10,000 to $14,999 | 99 | 13.0% |
| $15,000 to $24,999 | 12 | 1.6% |
| $25,000 to $34,999 | 0 | 0.0% |
| $35,000 to $49,999 | 113 | 14.8% |
| $50,000 to $74,999 | 78 | 10.2% |
| $75,000 to $99,999 | 188 | 24.7% |
| $100,000 to $149,999 | 197 | 25.9% |
| $150,000 to $199,999 | 38 | 5.0% |
| $200,000+ | 37 | 4.9% |
Family Income by Famaliy Size in Elma
2-person families (428 | 56.2%) account for the highest median family income in Elma with $91,929 per family, while 2-person families (428 | 56.2%) have the highest median income of $45,964 per family member.
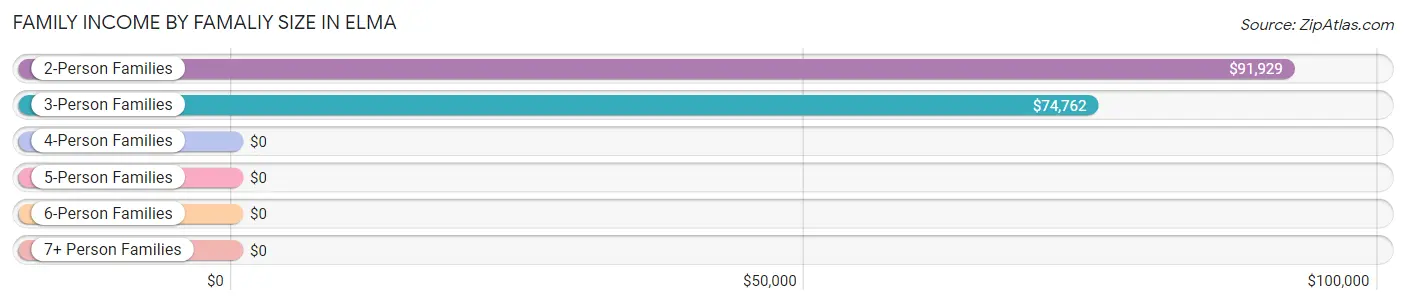
| Income Bracket | # Families | Median Income |
| 2-Person Families | 428 (56.2%) | $91,929 |
| 3-Person Families | 94 (12.3%) | $74,762 |
| 4-Person Families | 80 (10.5%) | $0 |
| 5-Person Families | 81 (10.6%) | $0 |
| 6-Person Families | 14 (1.8%) | $0 |
| 7+ Person Families | 65 (8.5%) | $0 |
| Total | 762 (100.0%) | $84,924 |
Family Income by Number of Earners in Elma
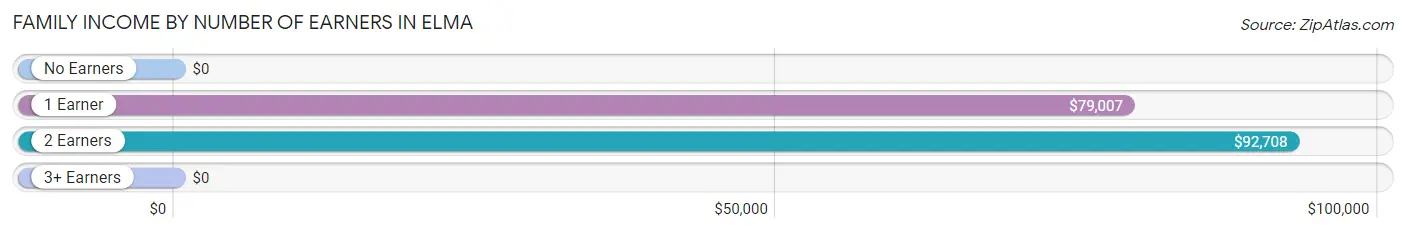
| Number of Earners | # Families | Median Income |
| No Earners | 184 (24.1%) | $0 |
| 1 Earner | 227 (29.8%) | $79,007 |
| 2 Earners | 326 (42.8%) | $92,708 |
| 3+ Earners | 25 (3.3%) | $0 |
| Total | 762 (100.0%) | $84,924 |
Household Income in Elma
Household Income Brackets in Elma
With 279 households falling in the category, the $50,000 to $74,999 income range is the most frequent in Elma, accounting for 22.1% of all households. In contrast, only 11 households (0.9%) fall into the $25,000 to $34,999 income bracket, making it the least populous group.
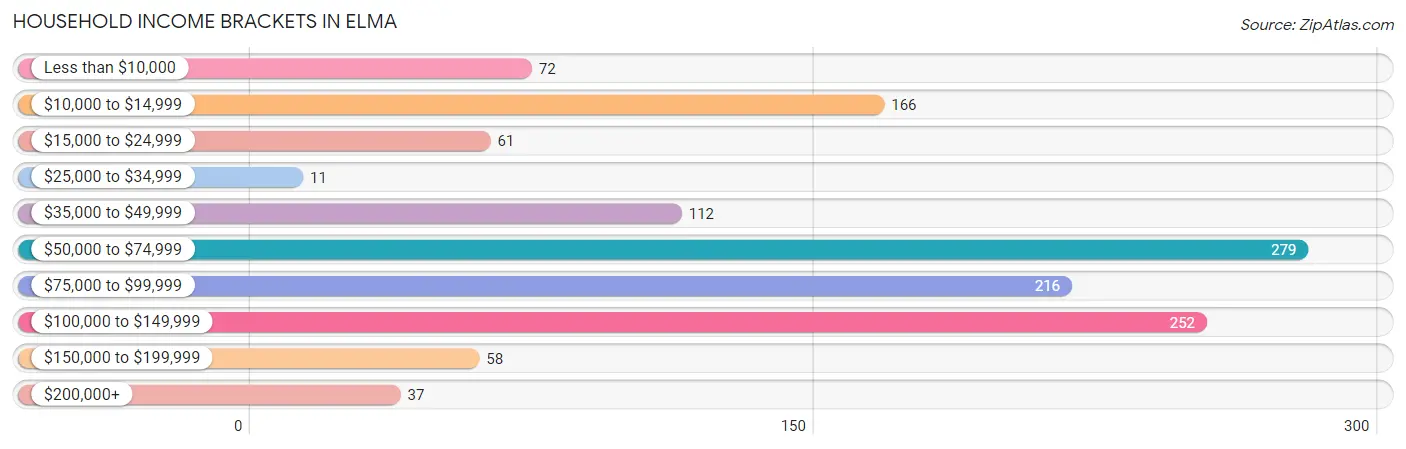
| Income Bracket | # Households | % Households |
| Less than $10,000 | 72 | 5.7% |
| $10,000 to $14,999 | 166 | 13.1% |
| $15,000 to $24,999 | 61 | 4.8% |
| $25,000 to $34,999 | 11 | 0.9% |
| $35,000 to $49,999 | 112 | 8.9% |
| $50,000 to $74,999 | 279 | 22.1% |
| $75,000 to $99,999 | 216 | 17.1% |
| $100,000 to $149,999 | 252 | 19.9% |
| $150,000 to $199,999 | 58 | 4.6% |
| $200,000+ | 37 | 2.9% |
Household Income by Householder Age in Elma
The median household income in Elma is $64,808, with the highest median household income of $76,538 found in the 65+ years age bracket for the primary householder. A total of 366 households (29.0%) fall into this category. Meanwhile, the 15 to 24 years age bracket for the primary householder has the lowest median household income of $55,625, with 126 households (10.0%) in this group.
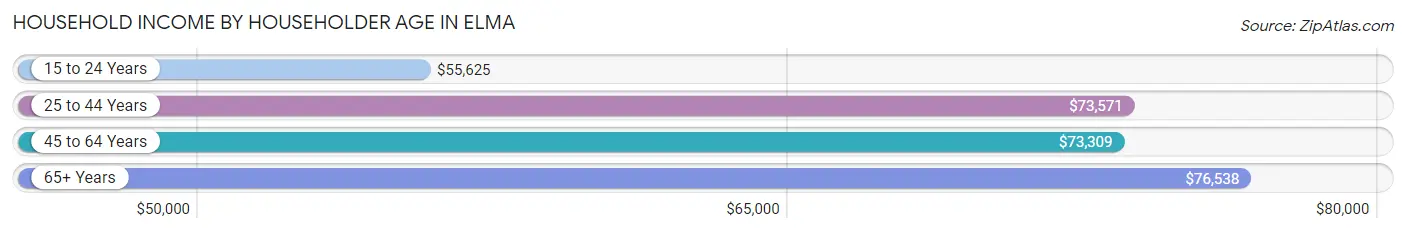
| Income Bracket | # Households | Median Income |
| 15 to 24 Years | 126 (10.0%) | $55,625 |
| 25 to 44 Years | 316 (25.0%) | $73,571 |
| 45 to 64 Years | 456 (36.1%) | $73,309 |
| 65+ Years | 366 (29.0%) | $76,538 |
| Total | 1,264 (100.0%) | $64,808 |
Poverty in Elma
Income Below Poverty by Sex and Age in Elma
With 38.5% poverty level for males and 32.4% for females among the residents of Elma, 16 and 17 year old males and 12 to 14 year old females are the most vulnerable to poverty, with 38 males (100.0%) and 50 females (84.8%) in their respective age groups living below the poverty level.
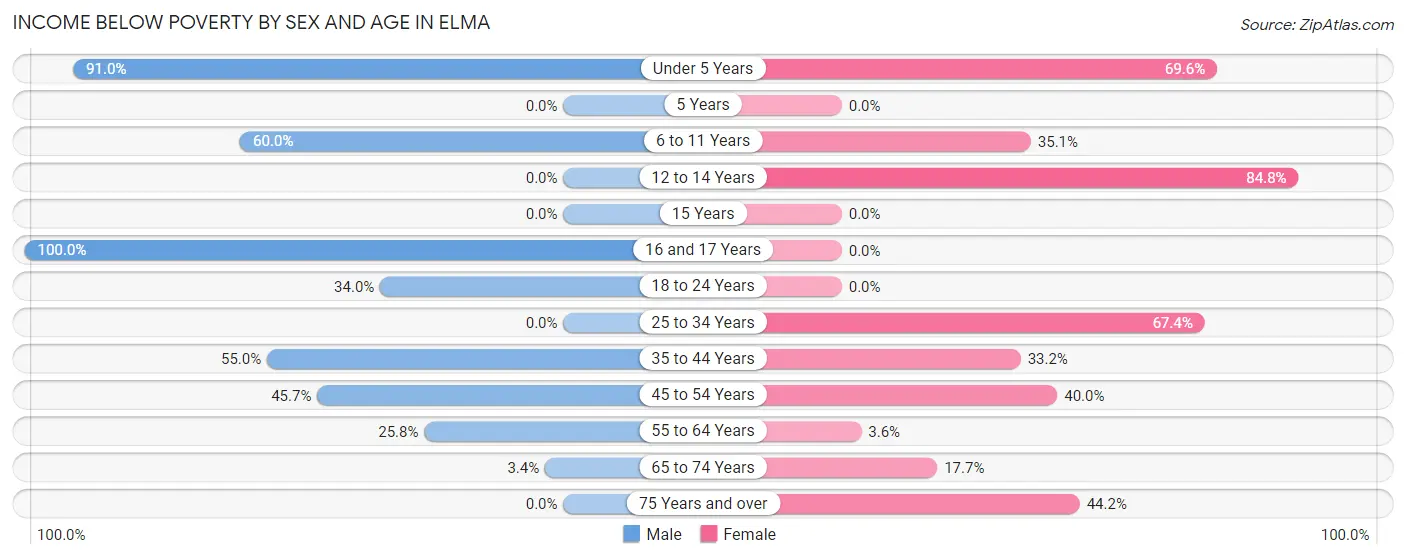
| Age Bracket | Male | Female |
| Under 5 Years | 222 (91.0%) | 39 (69.6%) |
| 5 Years | 0 (0.0%) | 0 (0.0%) |
| 6 to 11 Years | 72 (60.0%) | 80 (35.1%) |
| 12 to 14 Years | 0 (0.0%) | 50 (84.8%) |
| 15 Years | 0 (0.0%) | 0 (0.0%) |
| 16 and 17 Years | 38 (100.0%) | 0 (0.0%) |
| 18 to 24 Years | 85 (34.0%) | 0 (0.0%) |
| 25 to 34 Years | 0 (0.0%) | 130 (67.4%) |
| 35 to 44 Years | 110 (55.0%) | 88 (33.2%) |
| 45 to 54 Years | 111 (45.7%) | 22 (40.0%) |
| 55 to 64 Years | 72 (25.8%) | 11 (3.6%) |
| 65 to 74 Years | 6 (3.4%) | 34 (17.7%) |
| 75 Years and over | 0 (0.0%) | 53 (44.2%) |
| Total | 716 (38.5%) | 507 (32.4%) |
Income Above Poverty by Sex and Age in Elma
According to the poverty statistics in Elma, males aged 5 years and females aged 16 and 17 years are the age groups that are most secure financially, with 100.0% of males and 100.0% of females in these age groups living above the poverty line.
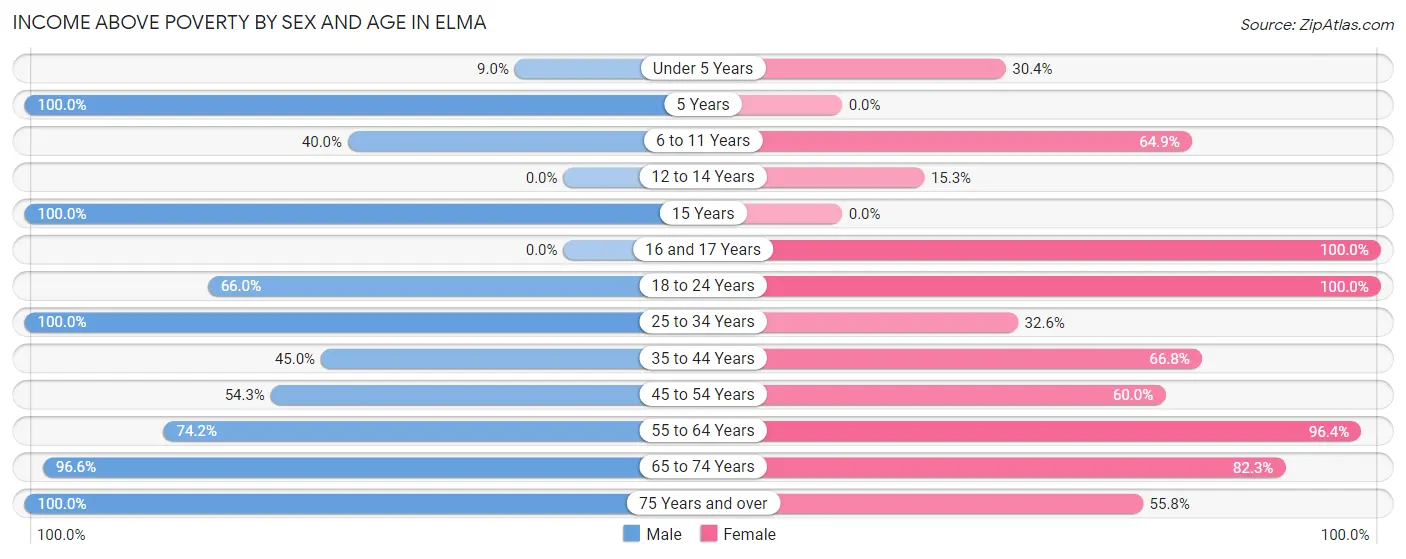
| Age Bracket | Male | Female |
| Under 5 Years | 22 (9.0%) | 17 (30.4%) |
| 5 Years | 17 (100.0%) | 0 (0.0%) |
| 6 to 11 Years | 48 (40.0%) | 148 (64.9%) |
| 12 to 14 Years | 0 (0.0%) | 9 (15.2%) |
| 15 Years | 13 (100.0%) | 0 (0.0%) |
| 16 and 17 Years | 0 (0.0%) | 12 (100.0%) |
| 18 to 24 Years | 165 (66.0%) | 83 (100.0%) |
| 25 to 34 Years | 111 (100.0%) | 63 (32.6%) |
| 35 to 44 Years | 90 (45.0%) | 177 (66.8%) |
| 45 to 54 Years | 132 (54.3%) | 33 (60.0%) |
| 55 to 64 Years | 207 (74.2%) | 292 (96.4%) |
| 65 to 74 Years | 171 (96.6%) | 158 (82.3%) |
| 75 Years and over | 166 (100.0%) | 67 (55.8%) |
| Total | 1,142 (61.5%) | 1,059 (67.6%) |
Income Below Poverty Among Married-Couple Families in Elma
The poverty statistics for married-couple families in Elma show that 14.0% or 77 of the total 549 families live below the poverty line. Families with 5 or more children have the highest poverty rate of 100.0%, comprising of 65 families. On the other hand, families with no children have the lowest poverty rate of 0.0%, which includes 0 families.
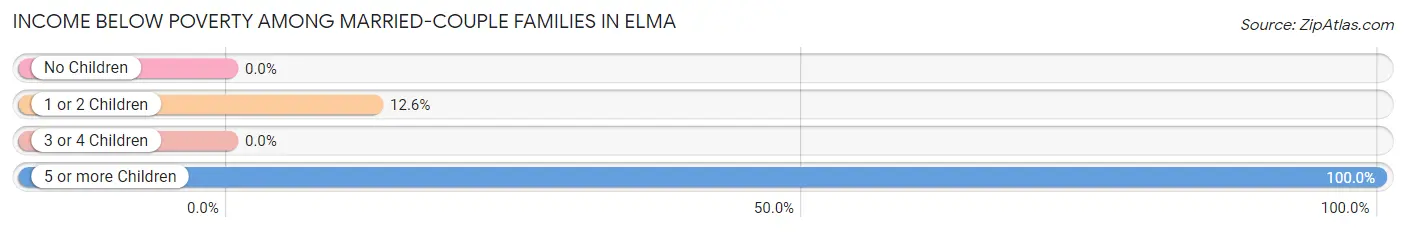
| Children | Above Poverty | Below Poverty |
| No Children | 376 (100.0%) | 0 (0.0%) |
| 1 or 2 Children | 83 (87.4%) | 12 (12.6%) |
| 3 or 4 Children | 13 (100.0%) | 0 (0.0%) |
| 5 or more Children | 0 (0.0%) | 65 (100.0%) |
| Total | 472 (86.0%) | 77 (14.0%) |
Income Below Poverty Among Single-Parent Households in Elma
According to the poverty data in Elma, 54.4% or 56 single-father households and 39.1% or 43 single-mother households are living below the poverty line. Among single-father households, those with 3 or 4 children have the highest poverty rate, with 56 households (100.0%) experiencing poverty. Likewise, among single-mother households, those with 1 or 2 children have the highest poverty rate, with 43 households (47.2%) falling below the poverty line.
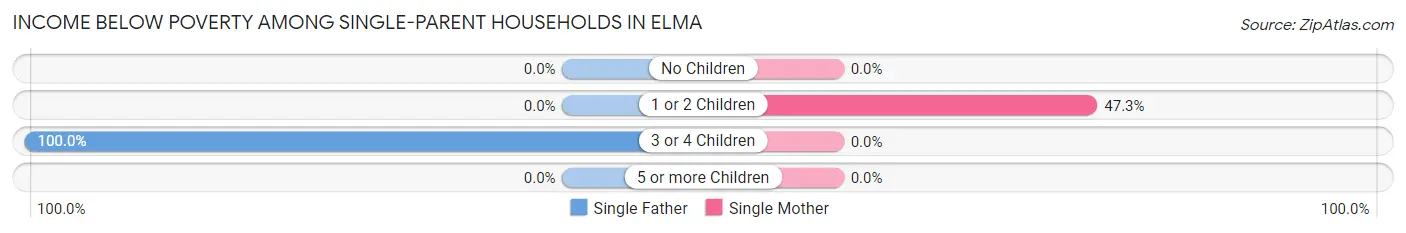
| Children | Single Father | Single Mother |
| No Children | 0 (0.0%) | 0 (0.0%) |
| 1 or 2 Children | 0 (0.0%) | 43 (47.2%) |
| 3 or 4 Children | 56 (100.0%) | 0 (0.0%) |
| 5 or more Children | 0 (0.0%) | 0 (0.0%) |
| Total | 56 (54.4%) | 43 (39.1%) |
Income Below Poverty Among Married-Couple vs Single-Parent Households in Elma
The poverty data for Elma shows that 77 of the married-couple family households (14.0%) and 99 of the single-parent households (46.5%) are living below the poverty level. Within the married-couple family households, those with 5 or more children have the highest poverty rate, with 65 households (100.0%) falling below the poverty line. Among the single-parent households, those with 3 or 4 children have the highest poverty rate, with 56 household (100.0%) living below poverty.
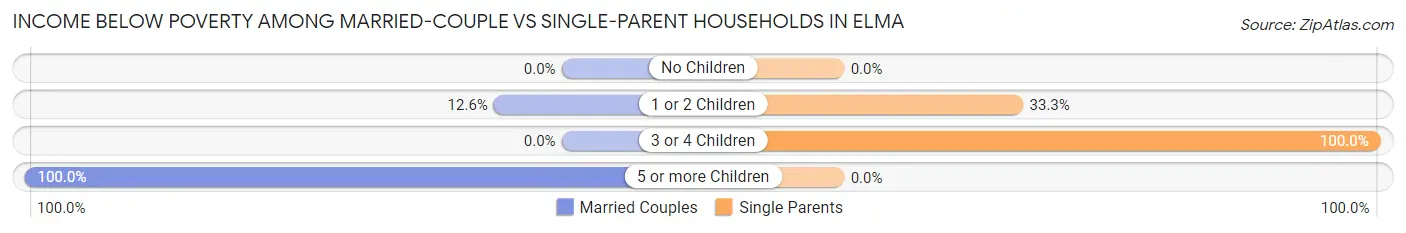
| Children | Married-Couple Families | Single-Parent Households |
| No Children | 0 (0.0%) | 0 (0.0%) |
| 1 or 2 Children | 12 (12.6%) | 43 (33.3%) |
| 3 or 4 Children | 0 (0.0%) | 56 (100.0%) |
| 5 or more Children | 65 (100.0%) | 0 (0.0%) |
| Total | 77 (14.0%) | 99 (46.5%) |
Race in Elma
The most populous races in Elma are White / Caucasian (2,682 | 78.3%), Hispanic or Latino (572 | 16.7%), and Some other Race (479 | 14.0%).
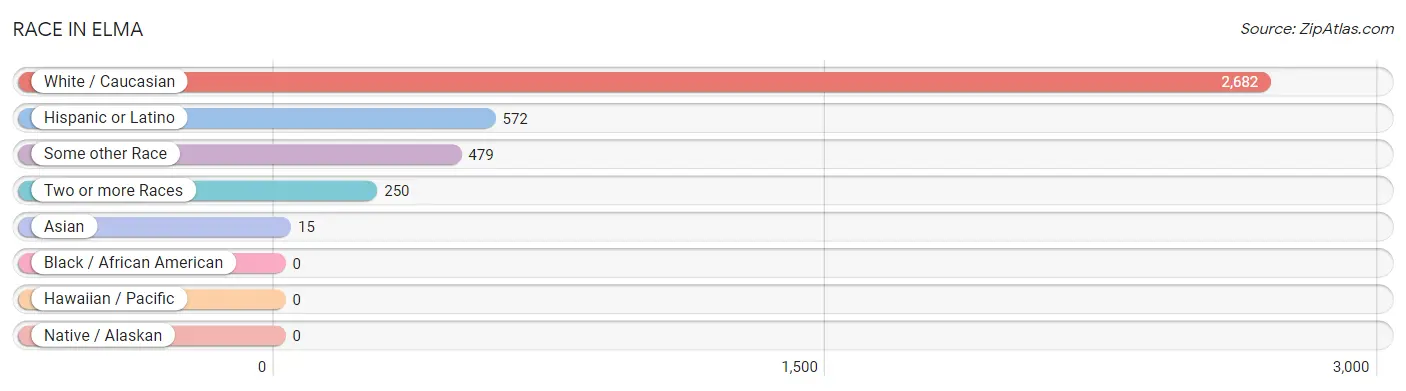
| Race | # Population | % Population |
| Asian | 15 | 0.4% |
| Black / African American | 0 | 0.0% |
| Hawaiian / Pacific | 0 | 0.0% |
| Hispanic or Latino | 572 | 16.7% |
| Native / Alaskan | 0 | 0.0% |
| White / Caucasian | 2,682 | 78.3% |
| Two or more Races | 250 | 7.3% |
| Some other Race | 479 | 14.0% |
| Total | 3,426 | 100.0% |
Ancestry in Elma
The most populous ancestries reported in Elma are Irish (657 | 19.2%), Mexican (558 | 16.3%), German (530 | 15.5%), English (296 | 8.6%), and Norwegian (243 | 7.1%), together accounting for 66.7% of all Elma residents.
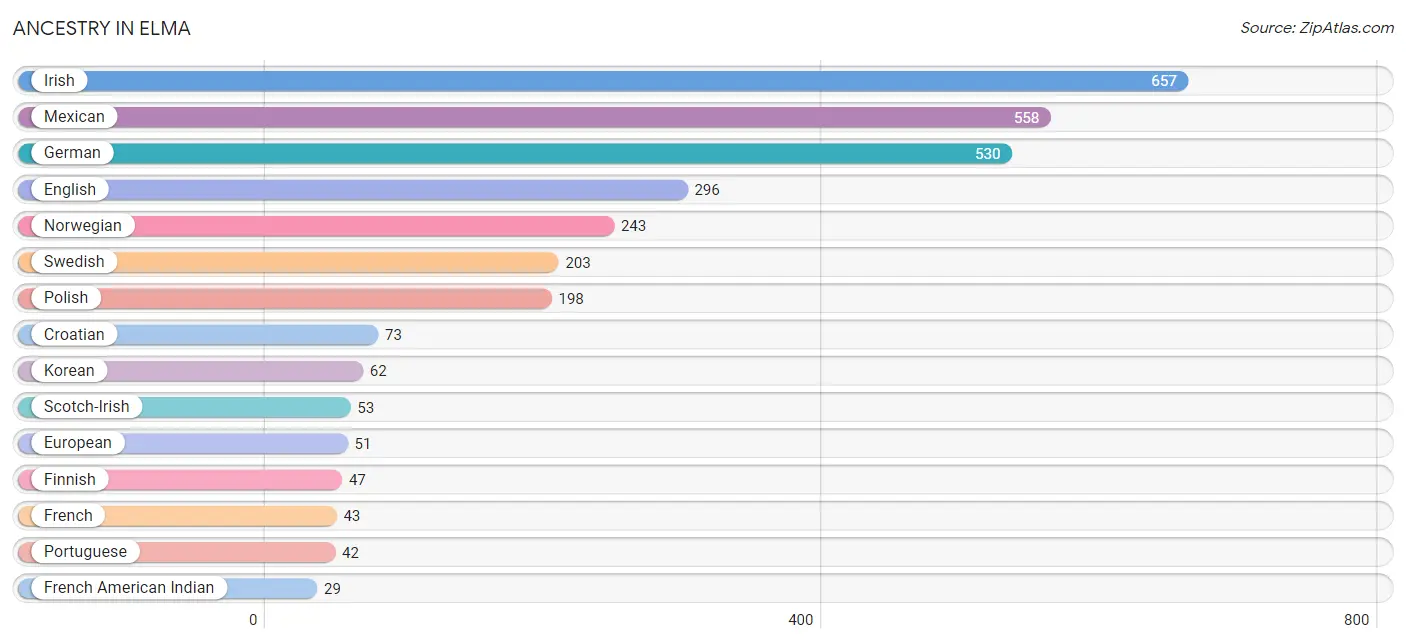
| Ancestry | # Population | % Population |
| American | 17 | 0.5% |
| Central American | 14 | 0.4% |
| Chippewa | 25 | 0.7% |
| Croatian | 73 | 2.1% |
| Czechoslovakian | 13 | 0.4% |
| English | 296 | 8.6% |
| European | 51 | 1.5% |
| Finnish | 47 | 1.4% |
| French | 43 | 1.3% |
| French American Indian | 29 | 0.9% |
| French Canadian | 29 | 0.9% |
| German | 530 | 15.5% |
| Hungarian | 21 | 0.6% |
| Irish | 657 | 19.2% |
| Italian | 6 | 0.2% |
| Korean | 62 | 1.8% |
| Mexican | 558 | 16.3% |
| Norwegian | 243 | 7.1% |
| Polish | 198 | 5.8% |
| Portuguese | 42 | 1.2% |
| Russian | 22 | 0.6% |
| Salvadoran | 14 | 0.4% |
| Scotch-Irish | 53 | 1.5% |
| Swedish | 203 | 5.9% |
| Welsh | 25 | 0.7% | View All 25 Rows |
Immigrants in Elma
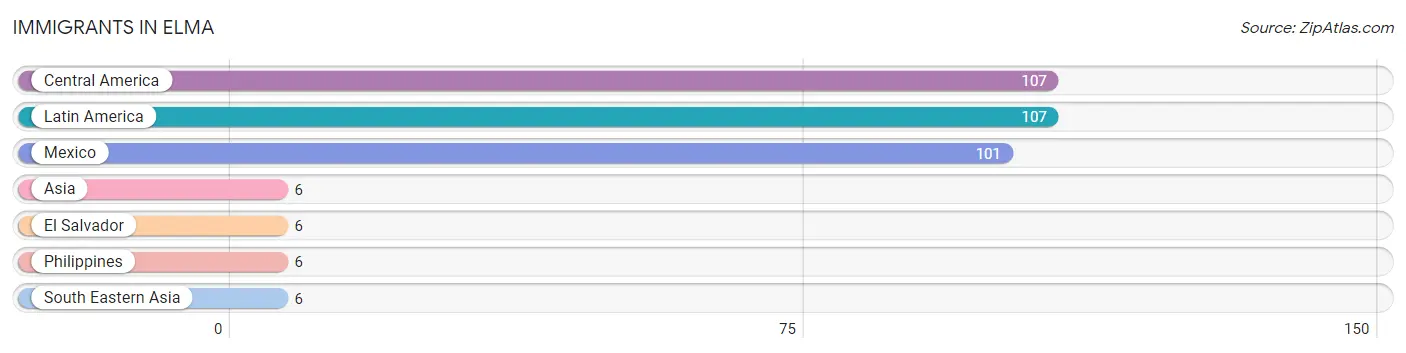
The most numerous immigrant groups reported in Elma came from Central America (107 | 3.1%), Latin America (107 | 3.1%), Mexico (101 | 2.9%), Asia (6 | 0.2%), and El Salvador (6 | 0.2%), together accounting for 9.5% of all Elma residents.
| Immigration Origin | # Population | % Population |
| Asia | 6 | 0.2% |
| Central America | 107 | 3.1% |
| El Salvador | 6 | 0.2% |
| Latin America | 107 | 3.1% |
| Mexico | 101 | 2.9% |
| Philippines | 6 | 0.2% |
| South Eastern Asia | 6 | 0.2% | View All 7 Rows |
Sex and Age in Elma
Sex and Age in Elma
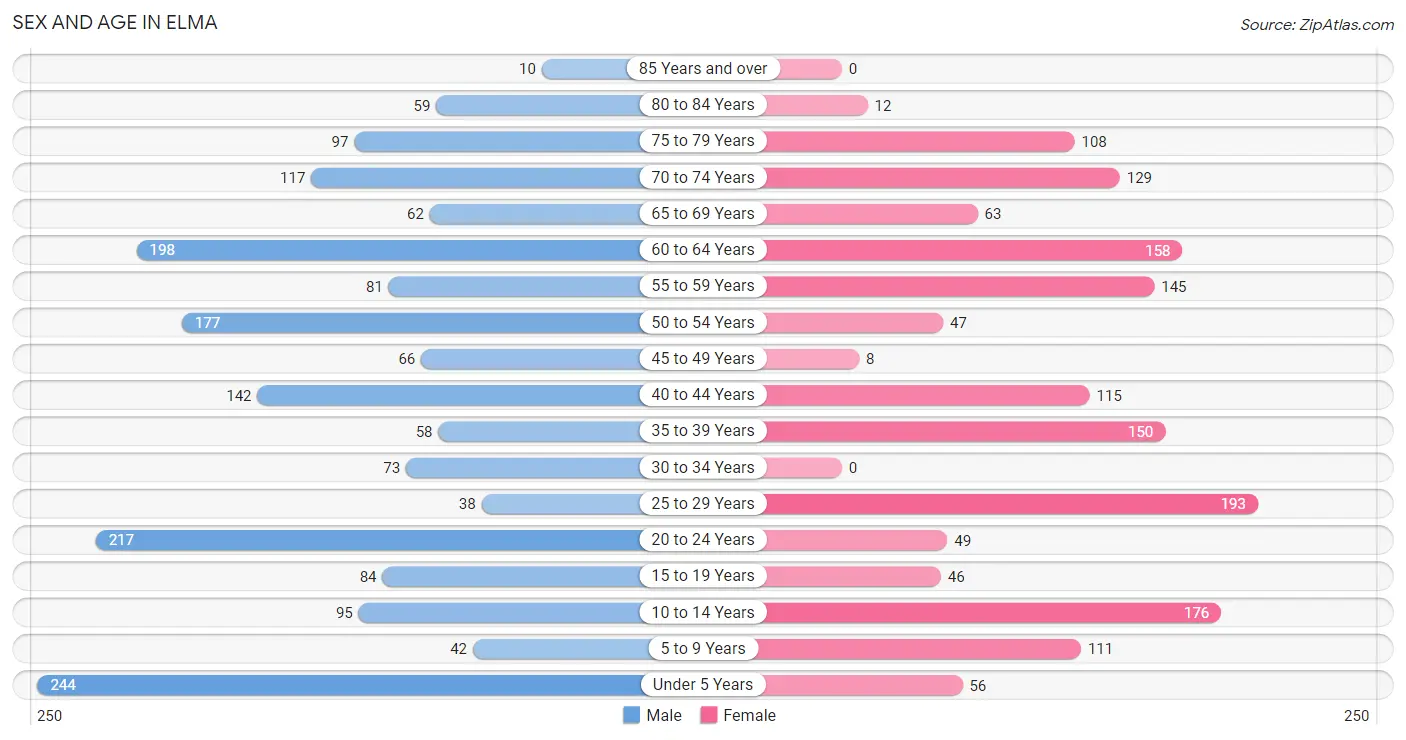
The most populous age groups in Elma are Under 5 Years (244 | 13.1%) for men and 25 to 29 Years (193 | 12.3%) for women.
| Age Bracket | Male | Female |
| Under 5 Years | 244 (13.1%) | 56 (3.6%) |
| 5 to 9 Years | 42 (2.3%) | 111 (7.1%) |
| 10 to 14 Years | 95 (5.1%) | 176 (11.2%) |
| 15 to 19 Years | 84 (4.5%) | 46 (2.9%) |
| 20 to 24 Years | 217 (11.7%) | 49 (3.1%) |
| 25 to 29 Years | 38 (2.0%) | 193 (12.3%) |
| 30 to 34 Years | 73 (3.9%) | 0 (0.0%) |
| 35 to 39 Years | 58 (3.1%) | 150 (9.6%) |
| 40 to 44 Years | 142 (7.6%) | 115 (7.3%) |
| 45 to 49 Years | 66 (3.5%) | 8 (0.5%) |
| 50 to 54 Years | 177 (9.5%) | 47 (3.0%) |
| 55 to 59 Years | 81 (4.3%) | 145 (9.3%) |
| 60 to 64 Years | 198 (10.6%) | 158 (10.1%) |
| 65 to 69 Years | 62 (3.3%) | 63 (4.0%) |
| 70 to 74 Years | 117 (6.3%) | 129 (8.2%) |
| 75 to 79 Years | 97 (5.2%) | 108 (6.9%) |
| 80 to 84 Years | 59 (3.2%) | 12 (0.8%) |
| 85 Years and over | 10 (0.5%) | 0 (0.0%) |
| Total | 1,860 (100.0%) | 1,566 (100.0%) |
Families and Households in Elma
Median Family Size in Elma
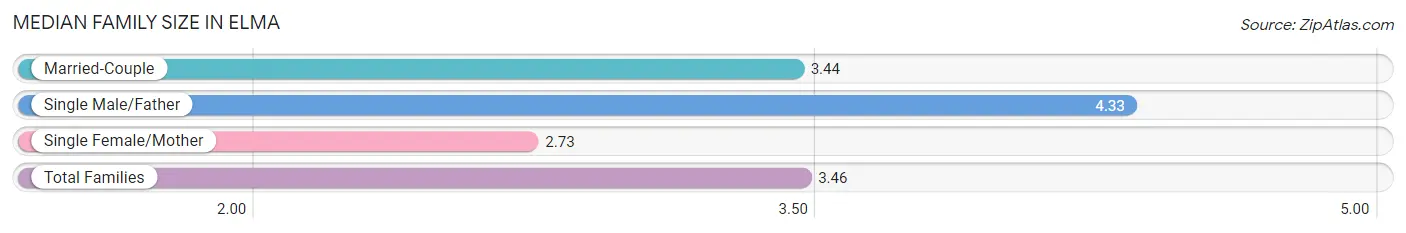
The median family size in Elma is 3.46 persons per family, with single male/father families (103 | 13.5%) accounting for the largest median family size of 4.33 persons per family. On the other hand, single female/mother families (110 | 14.4%) represent the smallest median family size with 2.73 persons per family.
| Family Type | # Families | Family Size |
| Married-Couple | 549 (72.1%) | 3.44 |
| Single Male/Father | 103 (13.5%) | 4.33 |
| Single Female/Mother | 110 (14.4%) | 2.73 |
| Total Families | 762 (100.0%) | 3.46 |
Median Household Size in Elma
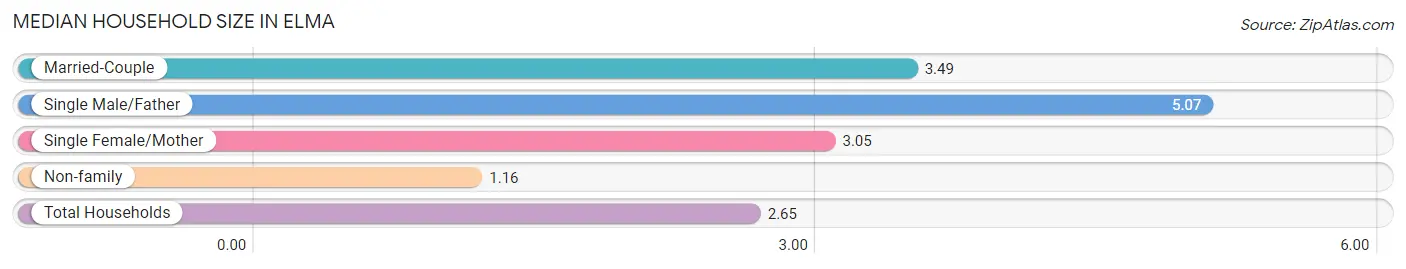
The median household size in Elma is 2.65 persons per household, with single male/father households (103 | 8.2%) accounting for the largest median household size of 5.07 persons per household. non-family households (502 | 39.7%) represent the smallest median household size with 1.16 persons per household.
| Household Type | # Households | Household Size |
| Married-Couple | 549 (43.4%) | 3.49 |
| Single Male/Father | 103 (8.2%) | 5.07 |
| Single Female/Mother | 110 (8.7%) | 3.05 |
| Non-family | 502 (39.7%) | 1.16 |
| Total Households | 1,264 (100.0%) | 2.65 |
Household Size by Marriage Status in Elma
Out of a total of 1,264 households in Elma, 762 (60.3%) are family households, while 502 (39.7%) are nonfamily households. The most numerous type of family households are 2-person households, comprising 394, and the most common type of nonfamily households are 1-person households, comprising 437.
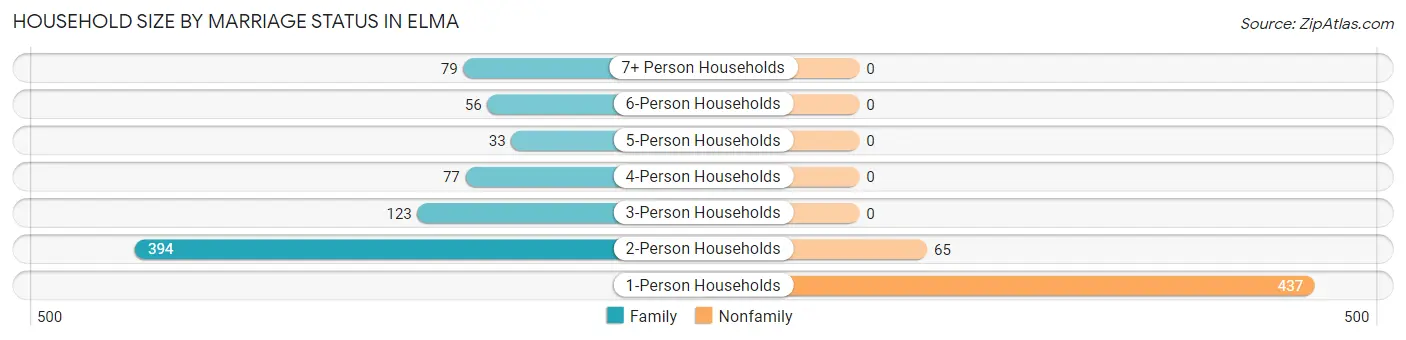
| Household Size | Family Households | Nonfamily Households |
| 1-Person Households | - | 437 (34.6%) |
| 2-Person Households | 394 (31.2%) | 65 (5.1%) |
| 3-Person Households | 123 (9.7%) | 0 (0.0%) |
| 4-Person Households | 77 (6.1%) | 0 (0.0%) |
| 5-Person Households | 33 (2.6%) | 0 (0.0%) |
| 6-Person Households | 56 (4.4%) | 0 (0.0%) |
| 7+ Person Households | 79 (6.2%) | 0 (0.0%) |
| Total | 762 (60.3%) | 502 (39.7%) |
Female Fertility in Elma
Fertility by Age in Elma
Average fertility rate in Elma is 296.0 births per 1,000 women. Women in the age bracket of 20 to 34 years have the highest fertility rate with 537.0 births per 1,000 women. Women in the age bracket of 20 to 34 years acount for 78.3% of all women with births.
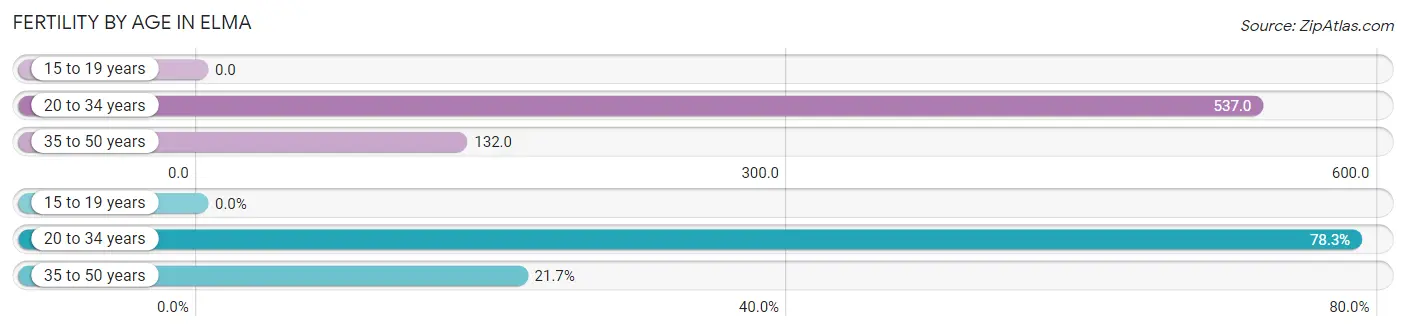
| Age Bracket | Women with Births | Births / 1,000 Women |
| 15 to 19 years | 0 (0.0%) | 0.0 |
| 20 to 34 years | 130 (78.3%) | 537.0 |
| 35 to 50 years | 36 (21.7%) | 132.0 |
| Total | 166 (100.0%) | 296.0 |
Fertility by Age by Marriage Status in Elma
21.7% of women with births (166) in Elma are married. The highest percentage of unmarried women with births falls into 20 to 34 years age bracket with 100.0% of them unmarried at the time of birth, while the lowest percentage of unmarried women with births belong to 35 to 50 years age bracket with 0.0% of them unmarried.
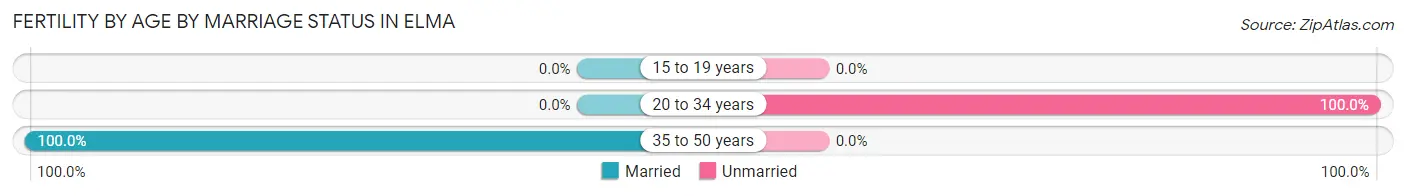
| Age Bracket | Married | Unmarried |
| 15 to 19 years | 0 (0.0%) | 0 (0.0%) |
| 20 to 34 years | 0 (0.0%) | 130 (100.0%) |
| 35 to 50 years | 36 (100.0%) | 0 (0.0%) |
| Total | 36 (21.7%) | 130 (78.3%) |
Fertility by Education in Elma
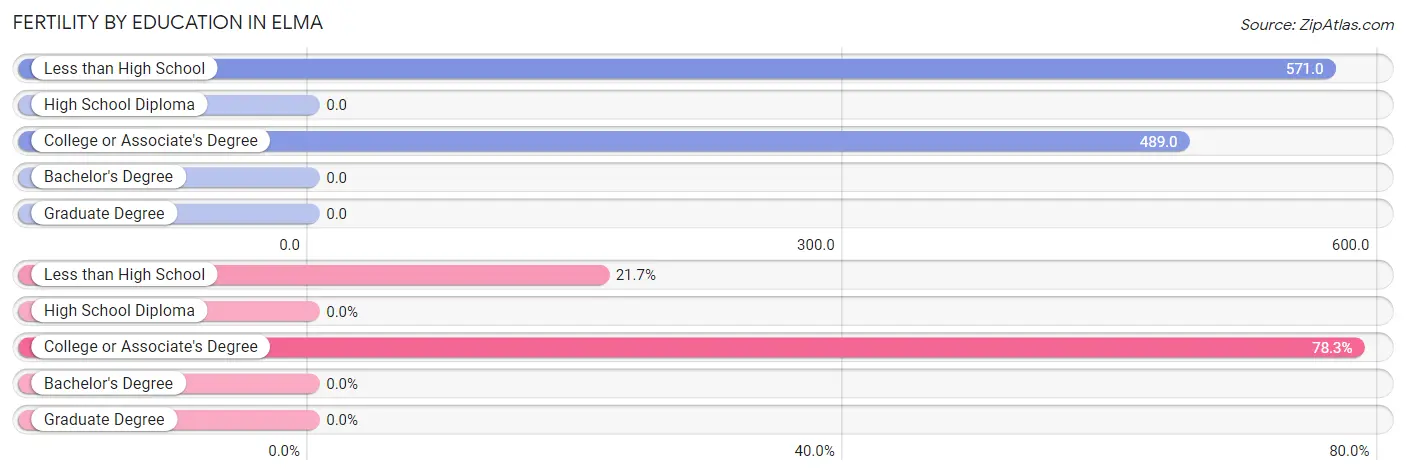
| Educational Attainment | Women with Births | Births / 1,000 Women |
| Less than High School | 36 (21.7%) | 571.0 |
| High School Diploma | 0 (0.0%) | 0.0 |
| College or Associate's Degree | 130 (78.3%) | 489.0 |
| Bachelor's Degree | 0 (0.0%) | 0.0 |
| Graduate Degree | 0 (0.0%) | 0.0 |
| Total | 166 (100.0%) | 296.0 |
Fertility by Education by Marriage Status in Elma
78.3% of women with births in Elma are unmarried. Women with the educational attainment of less than high school are most likely to be married with 100.0% of them married at childbirth, while women with the educational attainment of college or associate's degree are least likely to be married with 100.0% of them unmarried at childbirth.
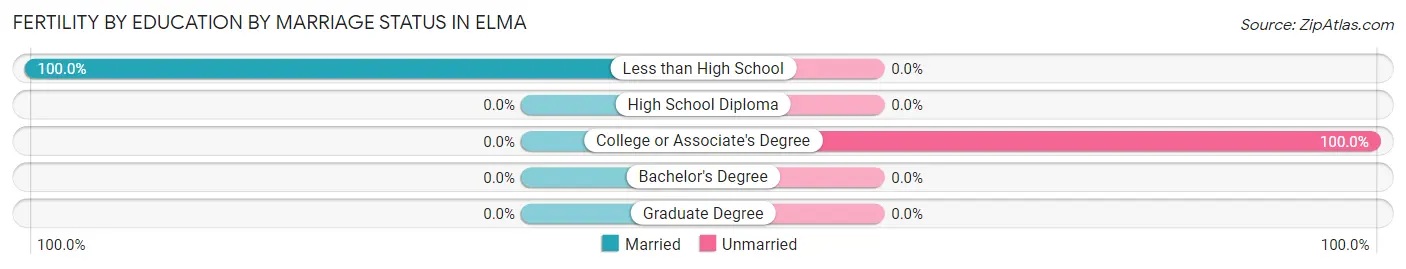
| Educational Attainment | Married | Unmarried |
| Less than High School | 36 (100.0%) | 0 (0.0%) |
| High School Diploma | 0 (0.0%) | 0 (0.0%) |
| College or Associate's Degree | 0 (0.0%) | 130 (100.0%) |
| Bachelor's Degree | 0 (0.0%) | 0 (0.0%) |
| Graduate Degree | 0 (0.0%) | 0 (0.0%) |
| Total | 36 (21.7%) | 130 (78.3%) |
Employment Characteristics in Elma
Employment by Class of Employer in Elma
Among the 1,393 employed individuals in Elma, private company employees (773 | 55.5%), state government employees (206 | 14.8%), and local government employees (140 | 10.1%) make up the most common classes of employment.
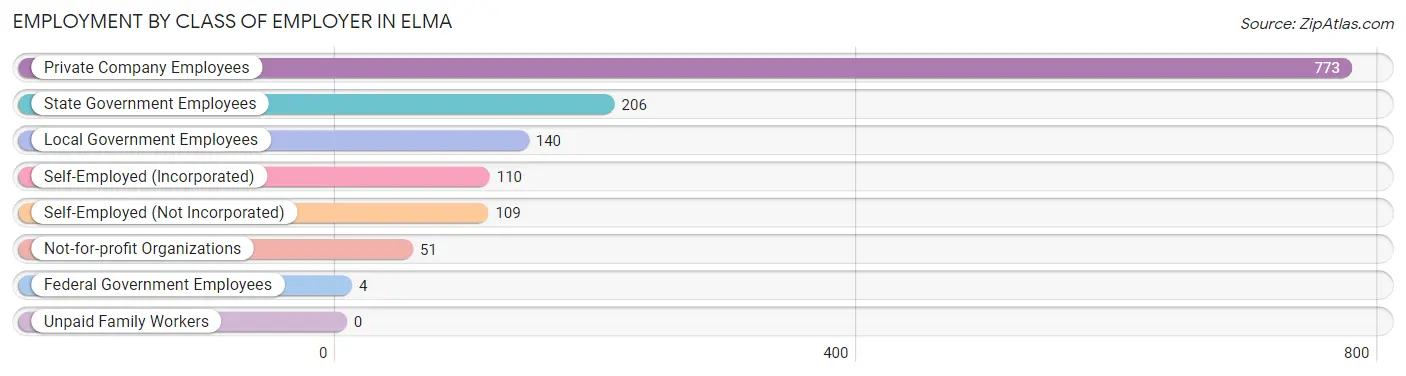
| Employer Class | # Employees | % Employees |
| Private Company Employees | 773 | 55.5% |
| Self-Employed (Incorporated) | 110 | 7.9% |
| Self-Employed (Not Incorporated) | 109 | 7.8% |
| Not-for-profit Organizations | 51 | 3.7% |
| Local Government Employees | 140 | 10.1% |
| State Government Employees | 206 | 14.8% |
| Federal Government Employees | 4 | 0.3% |
| Unpaid Family Workers | 0 | 0.0% |
| Total | 1,393 | 100.0% |
Employment Status by Age in Elma
According to the labor force statistics for Elma, out of the total population over 16 years of age (2,689), 55.9% or 1,503 individuals are in the labor force, with 6.1% or 92 of them unemployed. The age group with the highest labor force participation rate is 20 to 24 years, with 100.0% or 266 individuals in the labor force. Within the labor force, the 45 to 54 years age range has the highest percentage of unemployed individuals, with 30.6% or 55 of them being unemployed.
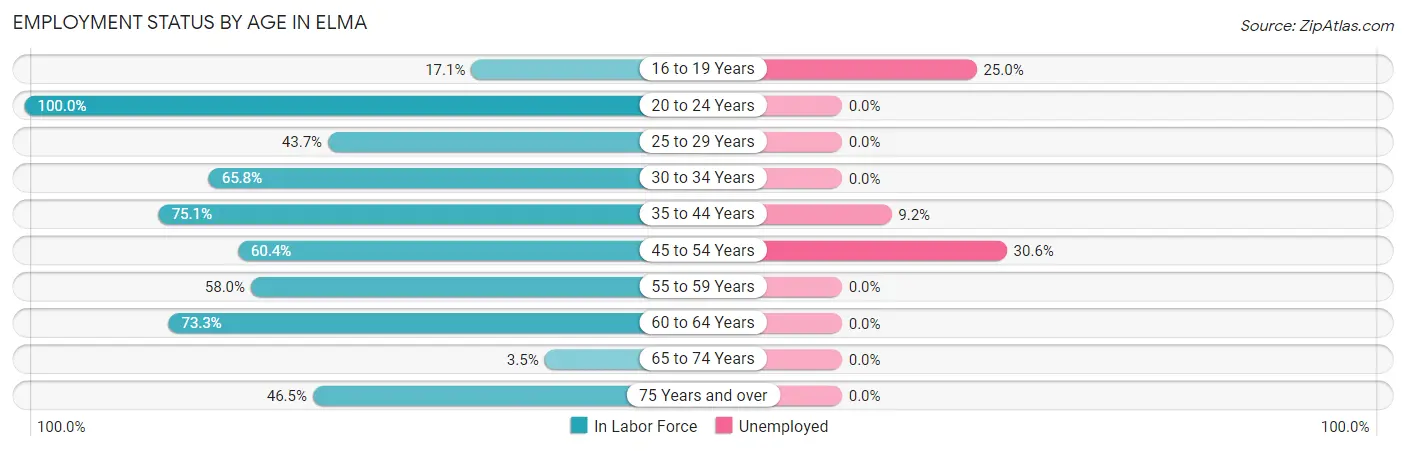
| Age Bracket | In Labor Force | Unemployed |
| 16 to 19 Years | 20 (17.1%) | 5 (25.0%) |
| 20 to 24 Years | 266 (100.0%) | 0 (0.0%) |
| 25 to 29 Years | 101 (43.7%) | 0 (0.0%) |
| 30 to 34 Years | 48 (65.8%) | 0 (0.0%) |
| 35 to 44 Years | 349 (75.1%) | 32 (9.2%) |
| 45 to 54 Years | 180 (60.4%) | 55 (30.6%) |
| 55 to 59 Years | 131 (58.0%) | 0 (0.0%) |
| 60 to 64 Years | 261 (73.3%) | 0 (0.0%) |
| 65 to 74 Years | 13 (3.5%) | 0 (0.0%) |
| 75 Years and over | 133 (46.5%) | 0 (0.0%) |
| Total | 1,503 (55.9%) | 92 (6.1%) |
Employment Status by Educational Attainment in Elma
According to labor force statistics for Elma, 64.9% of individuals (1,070) out of the total population between 25 and 64 years of age (1,649) are in the labor force, with 8.1% or 87 of them being unemployed. The group with the highest labor force participation rate are those with the educational attainment of bachelor's degree or higher, with 87.6% or 283 individuals in the labor force. Within the labor force, individuals with high school diploma education have the highest percentage of unemployment, with 15.2% or 55 of them being unemployed.
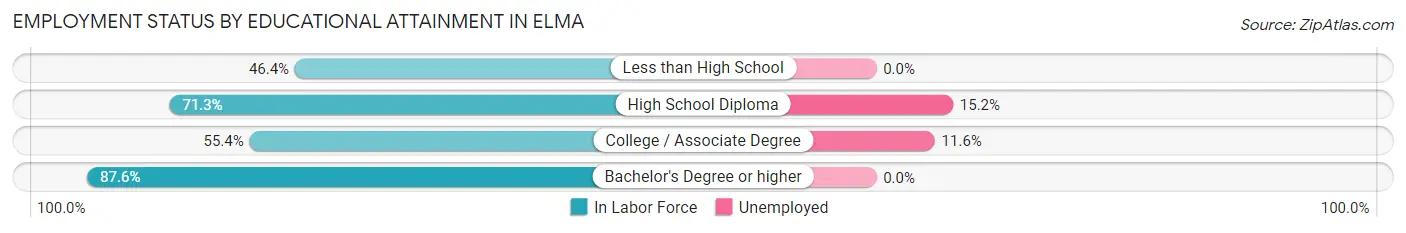
| Educational Attainment | In Labor Force | Unemployed |
| Less than High School | 149 (46.4%) | 0 (0.0%) |
| High School Diploma | 363 (71.3%) | 77 (15.2%) |
| College / Associate Degree | 275 (55.4%) | 58 (11.6%) |
| Bachelor's Degree or higher | 283 (87.6%) | 0 (0.0%) |
| Total | 1,070 (64.9%) | 134 (8.1%) |
Employment Occupations by Sex in Elma
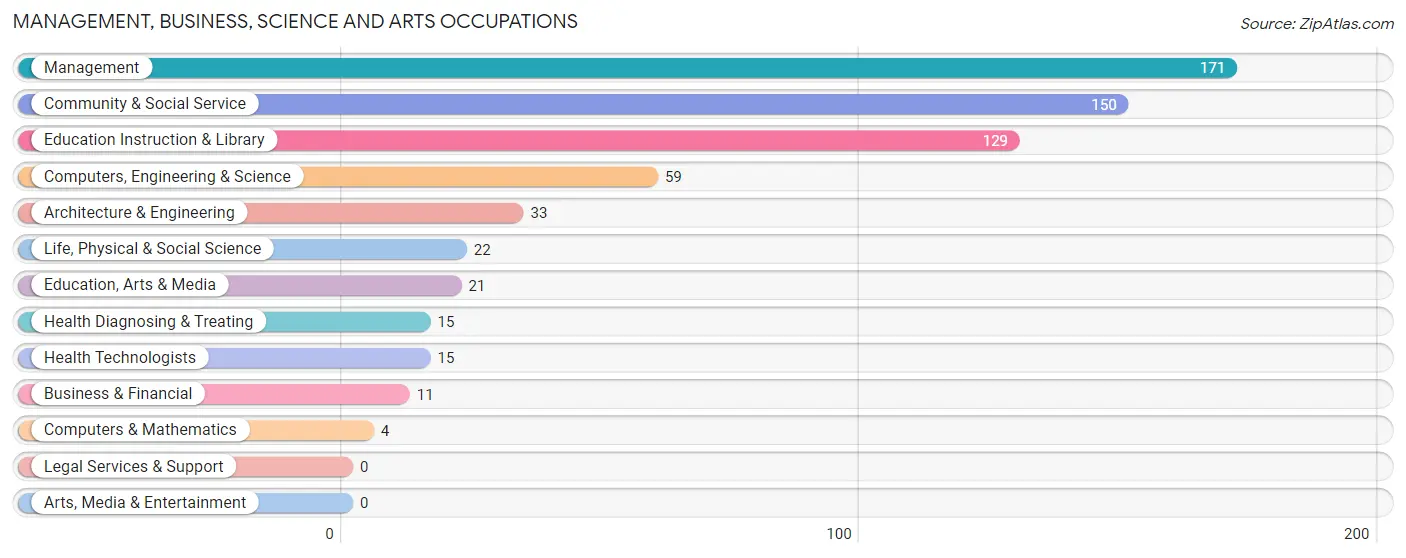
Management, Business, Science and Arts Occupations
The most common Management, Business, Science and Arts occupations in Elma are Management (171 | 12.1%), Community & Social Service (150 | 10.6%), Education Instruction & Library (129 | 9.1%), Computers, Engineering & Science (59 | 4.2%), and Architecture & Engineering (33 | 2.3%).
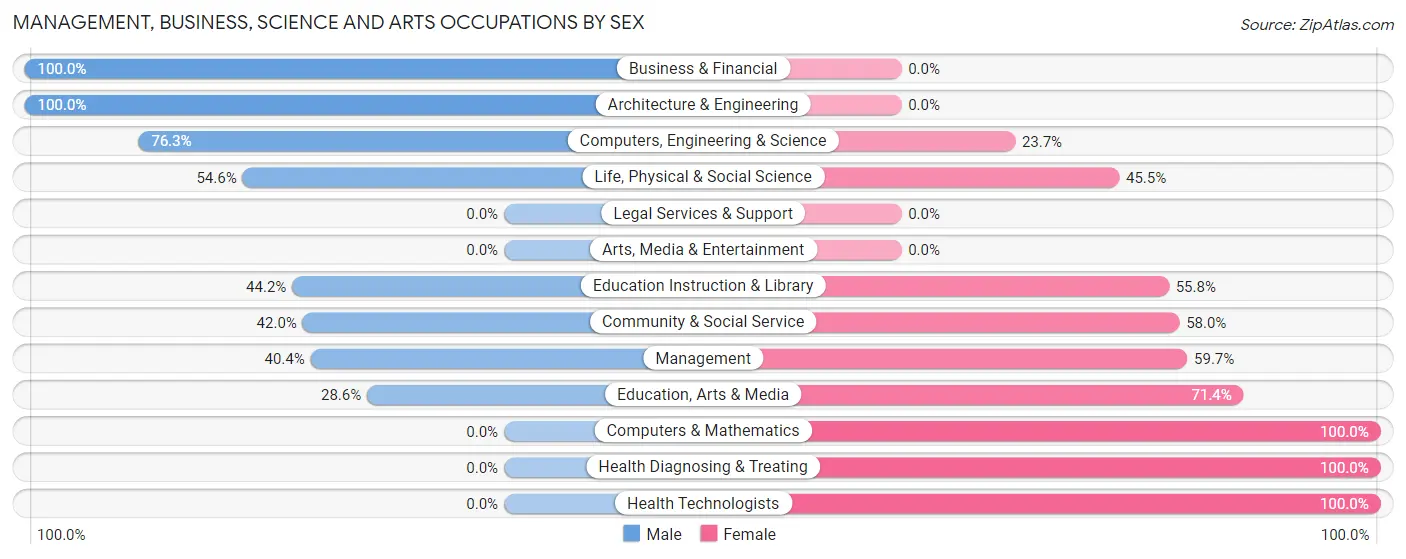
Management, Business, Science and Arts Occupations by Sex
Within the Management, Business, Science and Arts occupations in Elma, the most male-oriented occupations are Business & Financial (100.0%), Architecture & Engineering (100.0%), and Computers, Engineering & Science (76.3%), while the most female-oriented occupations are Computers & Mathematics (100.0%), Health Diagnosing & Treating (100.0%), and Health Technologists (100.0%).
| Occupation | Male | Female |
| Management | 69 (40.4%) | 102 (59.7%) |
| Business & Financial | 11 (100.0%) | 0 (0.0%) |
| Computers, Engineering & Science | 45 (76.3%) | 14 (23.7%) |
| Computers & Mathematics | 0 (0.0%) | 4 (100.0%) |
| Architecture & Engineering | 33 (100.0%) | 0 (0.0%) |
| Life, Physical & Social Science | 12 (54.5%) | 10 (45.5%) |
| Community & Social Service | 63 (42.0%) | 87 (58.0%) |
| Education, Arts & Media | 6 (28.6%) | 15 (71.4%) |
| Legal Services & Support | 0 (0.0%) | 0 (0.0%) |
| Education Instruction & Library | 57 (44.2%) | 72 (55.8%) |
| Arts, Media & Entertainment | 0 (0.0%) | 0 (0.0%) |
| Health Diagnosing & Treating | 0 (0.0%) | 15 (100.0%) |
| Health Technologists | 0 (0.0%) | 15 (100.0%) |
| Total (Category) | 188 (46.3%) | 218 (53.7%) |
| Total (Overall) | 852 (60.4%) | 558 (39.6%) |
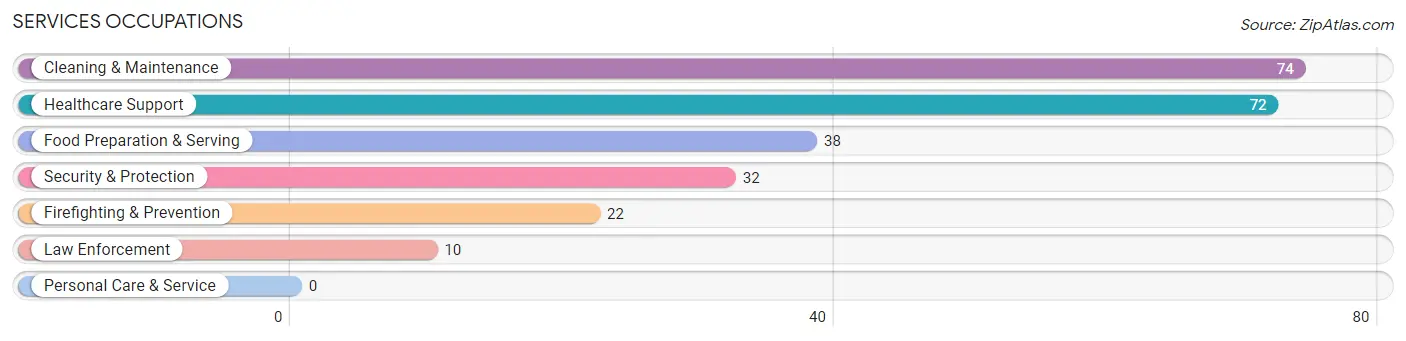
Services Occupations
The most common Services occupations in Elma are Cleaning & Maintenance (74 | 5.2%), Healthcare Support (72 | 5.1%), Food Preparation & Serving (38 | 2.7%), Security & Protection (32 | 2.3%), and Firefighting & Prevention (22 | 1.6%).
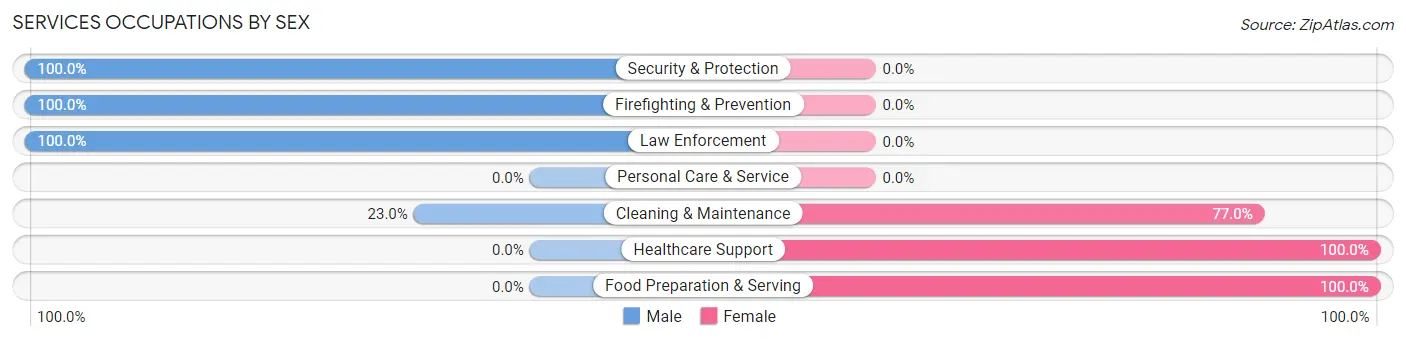
Services Occupations by Sex
Within the Services occupations in Elma, the most male-oriented occupations are Security & Protection (100.0%), Firefighting & Prevention (100.0%), and Law Enforcement (100.0%), while the most female-oriented occupations are Healthcare Support (100.0%), Food Preparation & Serving (100.0%), and Cleaning & Maintenance (77.0%).
| Occupation | Male | Female |
| Healthcare Support | 0 (0.0%) | 72 (100.0%) |
| Security & Protection | 32 (100.0%) | 0 (0.0%) |
| Firefighting & Prevention | 22 (100.0%) | 0 (0.0%) |
| Law Enforcement | 10 (100.0%) | 0 (0.0%) |
| Food Preparation & Serving | 0 (0.0%) | 38 (100.0%) |
| Cleaning & Maintenance | 17 (23.0%) | 57 (77.0%) |
| Personal Care & Service | 0 (0.0%) | 0 (0.0%) |
| Total (Category) | 49 (22.7%) | 167 (77.3%) |
| Total (Overall) | 852 (60.4%) | 558 (39.6%) |
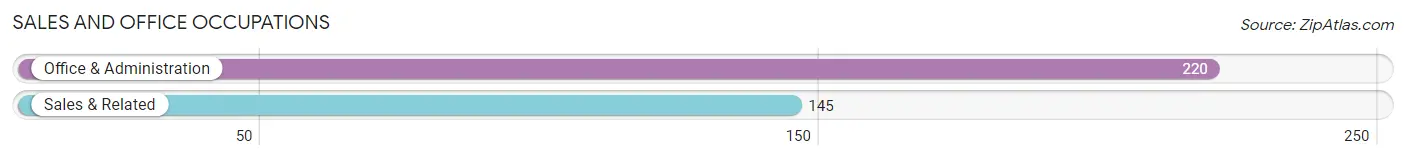
Sales and Office Occupations
The most common Sales and Office occupations in Elma are Office & Administration (220 | 15.6%), and Sales & Related (145 | 10.3%).
Sales and Office Occupations by Sex
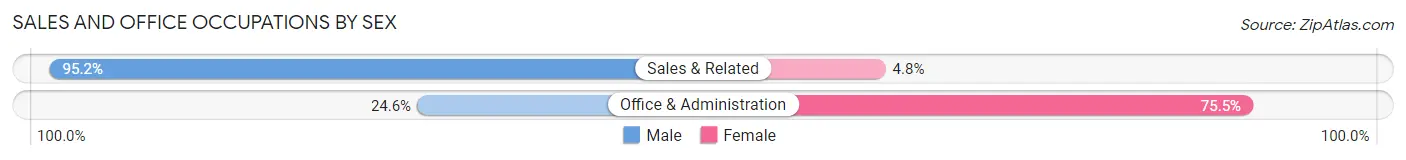
| Occupation | Male | Female |
| Sales & Related | 138 (95.2%) | 7 (4.8%) |
| Office & Administration | 54 (24.5%) | 166 (75.4%) |
| Total (Category) | 192 (52.6%) | 173 (47.4%) |
| Total (Overall) | 852 (60.4%) | 558 (39.6%) |
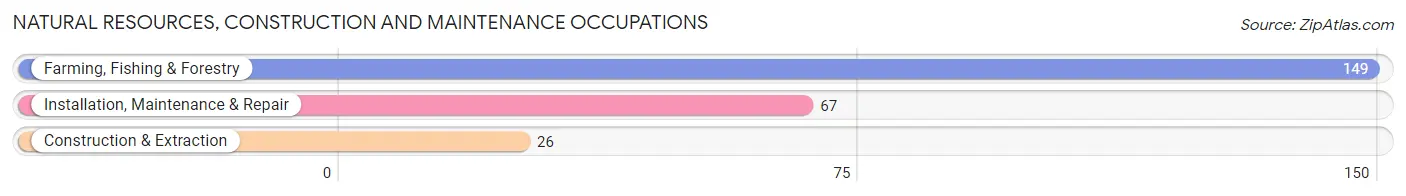
Natural Resources, Construction and Maintenance Occupations
The most common Natural Resources, Construction and Maintenance occupations in Elma are Farming, Fishing & Forestry (149 | 10.6%), Installation, Maintenance & Repair (67 | 4.8%), and Construction & Extraction (26 | 1.8%).
Natural Resources, Construction and Maintenance Occupations by Sex
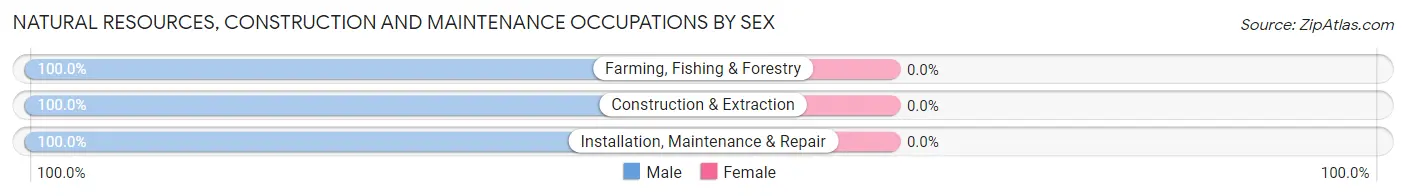
| Occupation | Male | Female |
| Farming, Fishing & Forestry | 149 (100.0%) | 0 (0.0%) |
| Construction & Extraction | 26 (100.0%) | 0 (0.0%) |
| Installation, Maintenance & Repair | 67 (100.0%) | 0 (0.0%) |
| Total (Category) | 242 (100.0%) | 0 (0.0%) |
| Total (Overall) | 852 (60.4%) | 558 (39.6%) |
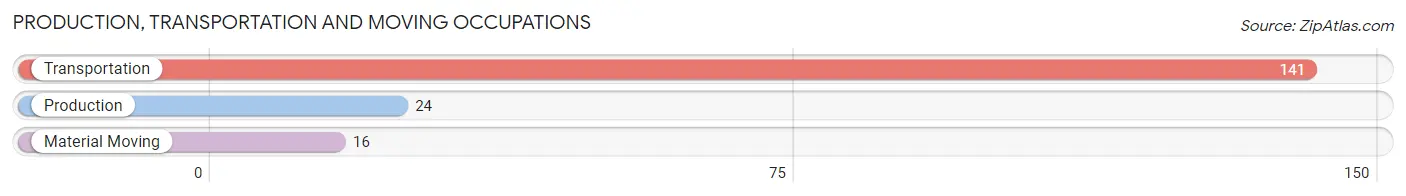
Production, Transportation and Moving Occupations
The most common Production, Transportation and Moving occupations in Elma are Transportation (141 | 10.0%), Production (24 | 1.7%), and Material Moving (16 | 1.1%).
Production, Transportation and Moving Occupations by Sex
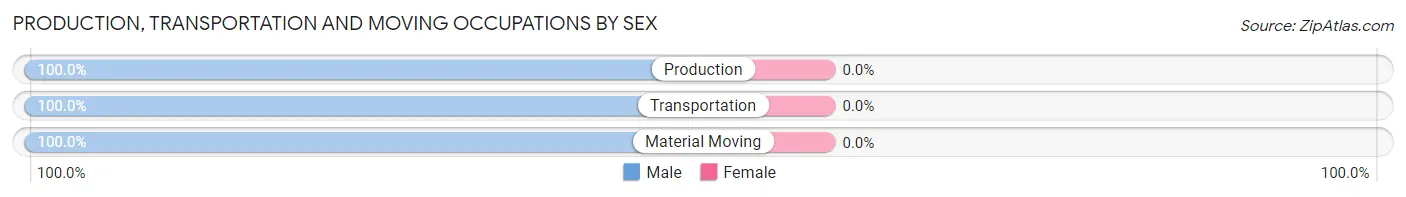
| Occupation | Male | Female |
| Production | 24 (100.0%) | 0 (0.0%) |
| Transportation | 141 (100.0%) | 0 (0.0%) |
| Material Moving | 16 (100.0%) | 0 (0.0%) |
| Total (Category) | 181 (100.0%) | 0 (0.0%) |
| Total (Overall) | 852 (60.4%) | 558 (39.6%) |
Employment Industries by Sex in Elma
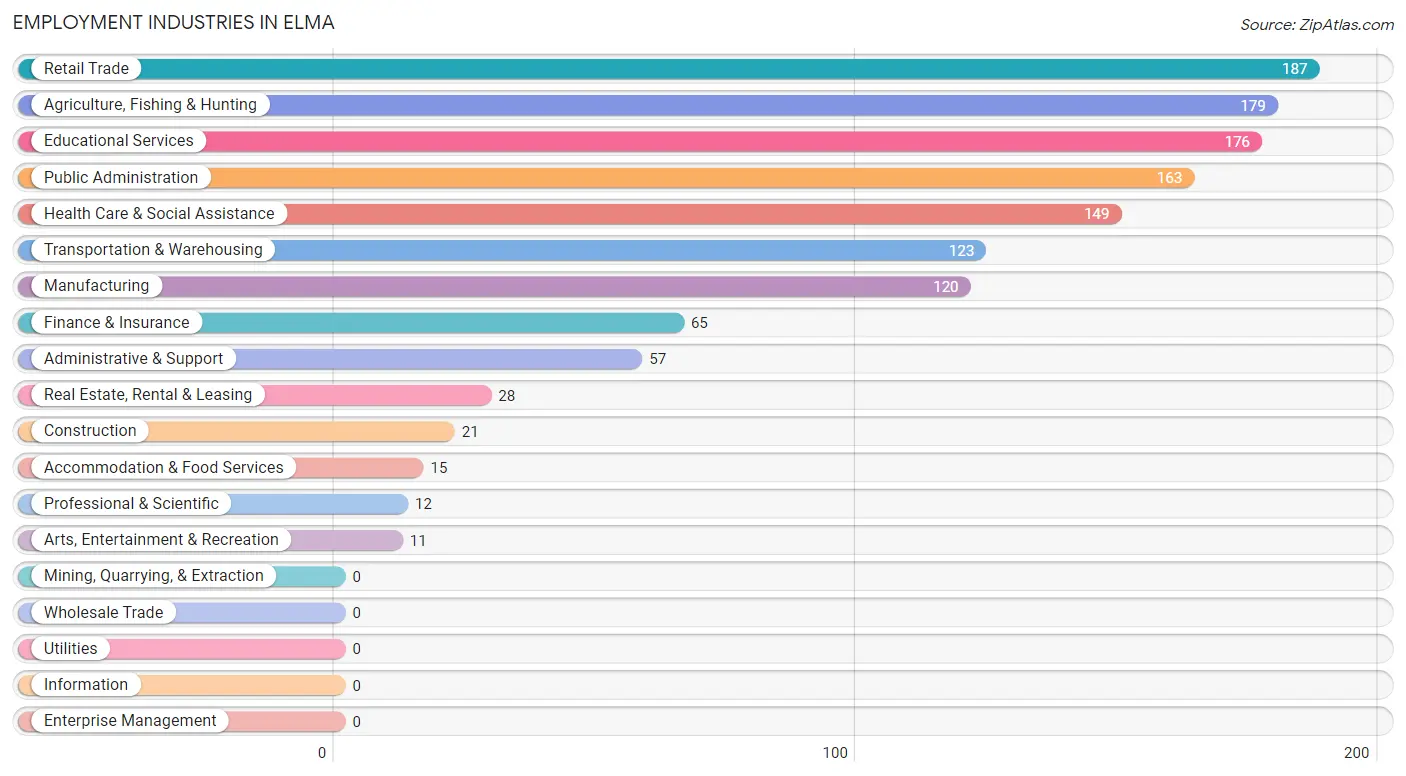
Employment Industries in Elma
The major employment industries in Elma include Retail Trade (187 | 13.3%), Agriculture, Fishing & Hunting (179 | 12.7%), Educational Services (176 | 12.5%), Public Administration (163 | 11.6%), and Health Care & Social Assistance (149 | 10.6%).
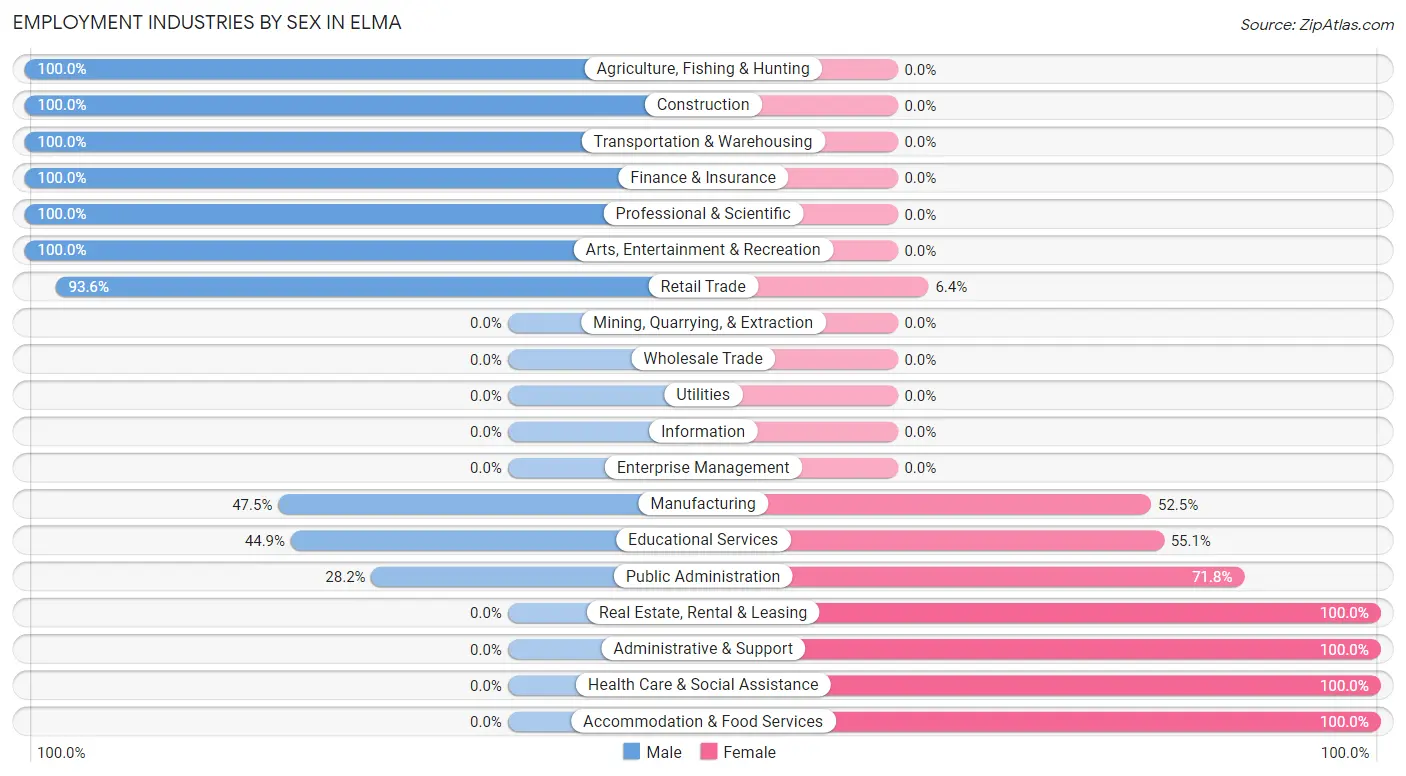
Employment Industries by Sex in Elma
The Elma industries that see more men than women are Agriculture, Fishing & Hunting (100.0%), Construction (100.0%), and Transportation & Warehousing (100.0%), whereas the industries that tend to have a higher number of women are Real Estate, Rental & Leasing (100.0%), Administrative & Support (100.0%), and Health Care & Social Assistance (100.0%).
| Industry | Male | Female |
| Agriculture, Fishing & Hunting | 179 (100.0%) | 0 (0.0%) |
| Mining, Quarrying, & Extraction | 0 (0.0%) | 0 (0.0%) |
| Construction | 21 (100.0%) | 0 (0.0%) |
| Manufacturing | 57 (47.5%) | 63 (52.5%) |
| Wholesale Trade | 0 (0.0%) | 0 (0.0%) |
| Retail Trade | 175 (93.6%) | 12 (6.4%) |
| Transportation & Warehousing | 123 (100.0%) | 0 (0.0%) |
| Utilities | 0 (0.0%) | 0 (0.0%) |
| Information | 0 (0.0%) | 0 (0.0%) |
| Finance & Insurance | 65 (100.0%) | 0 (0.0%) |
| Real Estate, Rental & Leasing | 0 (0.0%) | 28 (100.0%) |
| Professional & Scientific | 12 (100.0%) | 0 (0.0%) |
| Enterprise Management | 0 (0.0%) | 0 (0.0%) |
| Administrative & Support | 0 (0.0%) | 57 (100.0%) |
| Educational Services | 79 (44.9%) | 97 (55.1%) |
| Health Care & Social Assistance | 0 (0.0%) | 149 (100.0%) |
| Arts, Entertainment & Recreation | 11 (100.0%) | 0 (0.0%) |
| Accommodation & Food Services | 0 (0.0%) | 15 (100.0%) |
| Public Administration | 46 (28.2%) | 117 (71.8%) |
| Total | 852 (60.4%) | 558 (39.6%) |
Education in Elma
School Enrollment in Elma
The most common levels of schooling among the 595 students in Elma are middle school (243 | 40.8%), elementary school (114 | 19.2%), and high school (91 | 15.3%).
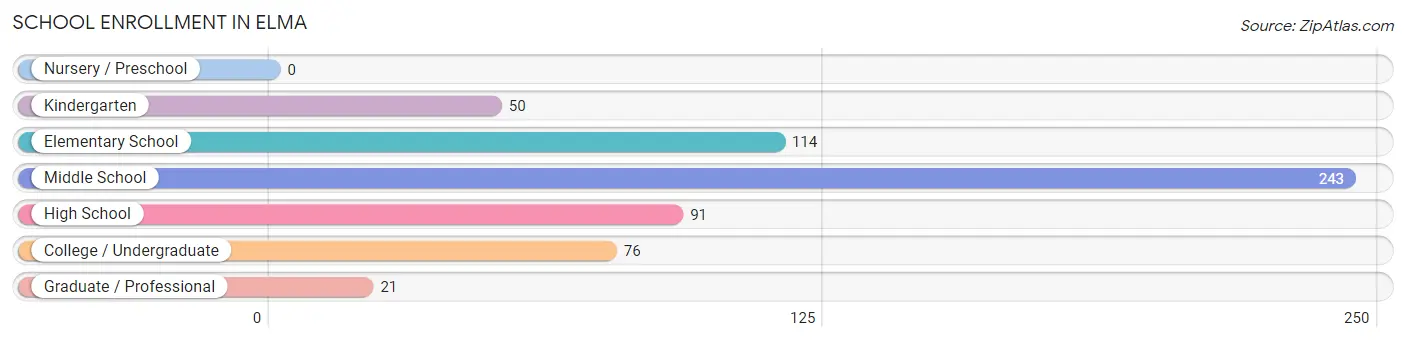
| School Level | # Students | % Students |
| Nursery / Preschool | 0 | 0.0% |
| Kindergarten | 50 | 8.4% |
| Elementary School | 114 | 19.2% |
| Middle School | 243 | 40.8% |
| High School | 91 | 15.3% |
| College / Undergraduate | 76 | 12.8% |
| Graduate / Professional | 21 | 3.5% |
| Total | 595 | 100.0% |
School Enrollment by Age by Funding Source in Elma
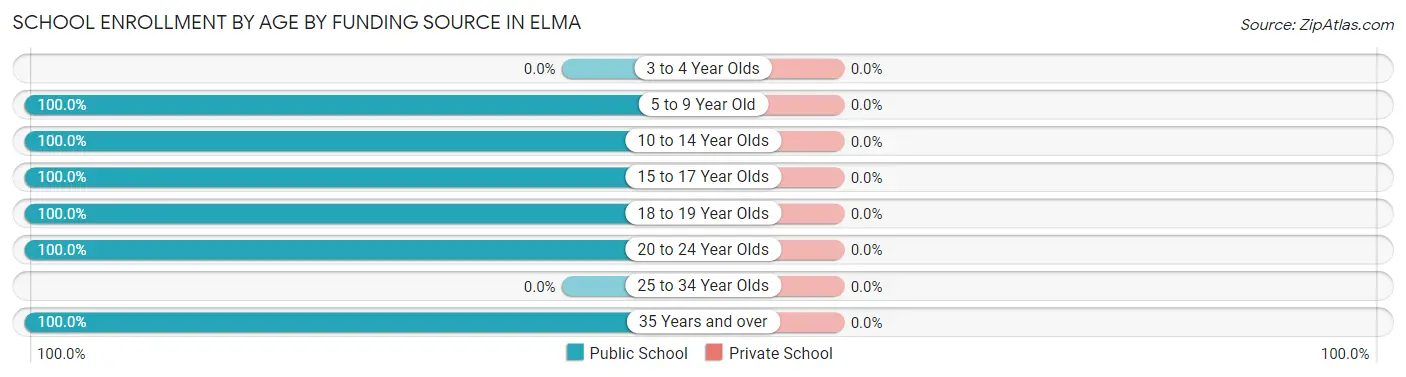
| Age Bracket | Public School | Private School |
| 3 to 4 Year Olds | 0 (0.0%) | 0 (0.0%) |
| 5 to 9 Year Old | 136 (100.0%) | 0 (0.0%) |
| 10 to 14 Year Olds | 271 (100.0%) | 0 (0.0%) |
| 15 to 17 Year Olds | 63 (100.0%) | 0 (0.0%) |
| 18 to 19 Year Olds | 47 (100.0%) | 0 (0.0%) |
| 20 to 24 Year Olds | 57 (100.0%) | 0 (0.0%) |
| 25 to 34 Year Olds | 0 (0.0%) | 0 (0.0%) |
| 35 Years and over | 21 (100.0%) | 0 (0.0%) |
| Total | 595 (100.0%) | 0 (0.0%) |
Educational Attainment by Field of Study in Elma
Education (97 | 20.9%), arts & humanities (79 | 17.0%), bio, nature & agricultural (75 | 16.1%), communications (73 | 15.7%), and liberal arts & history (49 | 10.5%) are the most common fields of study among 465 individuals in Elma who have obtained a bachelor's degree or higher.
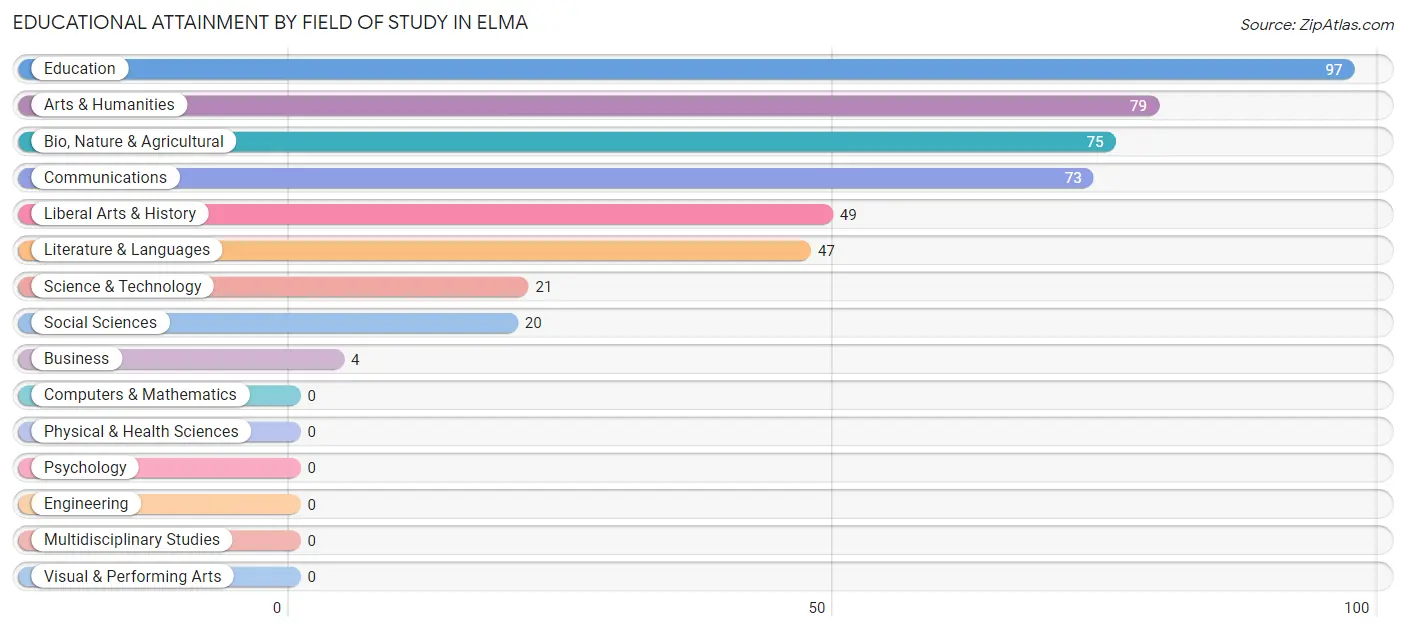
| Field of Study | # Graduates | % Graduates |
| Computers & Mathematics | 0 | 0.0% |
| Bio, Nature & Agricultural | 75 | 16.1% |
| Physical & Health Sciences | 0 | 0.0% |
| Psychology | 0 | 0.0% |
| Social Sciences | 20 | 4.3% |
| Engineering | 0 | 0.0% |
| Multidisciplinary Studies | 0 | 0.0% |
| Science & Technology | 21 | 4.5% |
| Business | 4 | 0.9% |
| Education | 97 | 20.9% |
| Literature & Languages | 47 | 10.1% |
| Liberal Arts & History | 49 | 10.5% |
| Visual & Performing Arts | 0 | 0.0% |
| Communications | 73 | 15.7% |
| Arts & Humanities | 79 | 17.0% |
| Total | 465 | 100.0% |
Transportation & Commute in Elma
Vehicle Availability by Sex in Elma
The most prevalent vehicle ownership categories in Elma are males with 2 vehicles (340, accounting for 40.7%) and females with 2 vehicles (254, making up 60.9%).
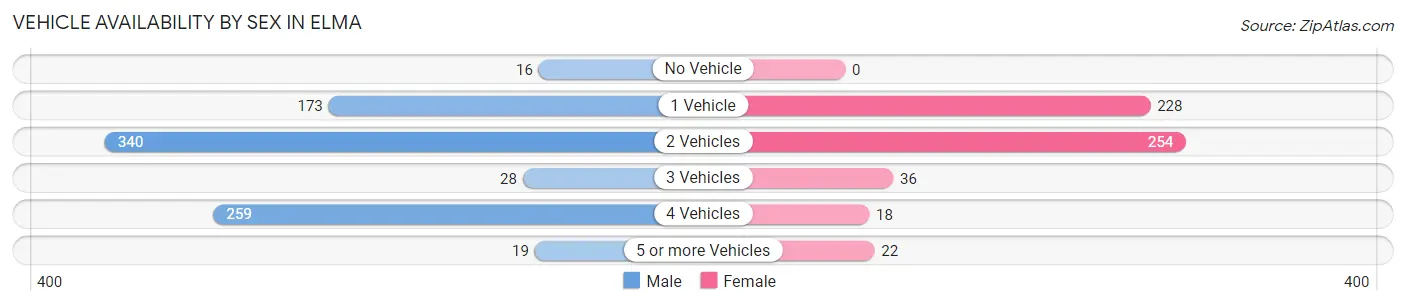
| Vehicles Available | Male | Female |
| No Vehicle | 16 (1.9%) | 0 (0.0%) |
| 1 Vehicle | 173 (20.7%) | 228 (40.9%) |
| 2 Vehicles | 340 (40.7%) | 254 (45.5%) |
| 3 Vehicles | 28 (3.4%) | 36 (6.5%) |
| 4 Vehicles | 259 (31.0%) | 18 (3.2%) |
| 5 or more Vehicles | 19 (2.3%) | 22 (3.9%) |
| Total | 835 (100.0%) | 558 (100.0%) |
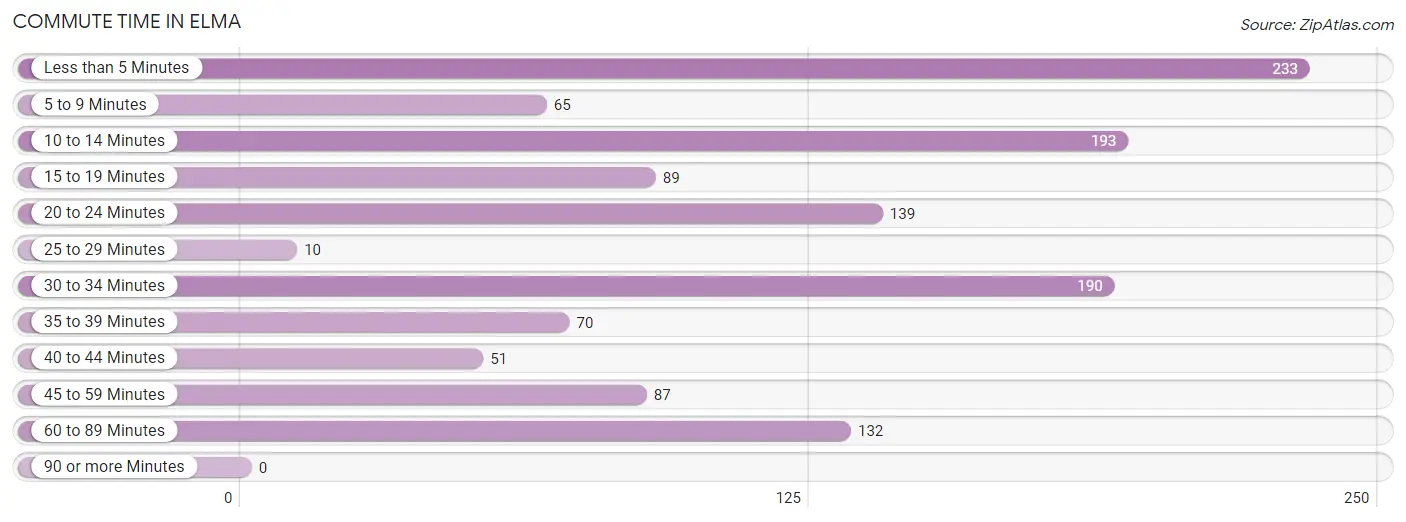
Commute Time in Elma
The most frequently occuring commute durations in Elma are less than 5 minutes (233 commuters, 18.5%), 10 to 14 minutes (193 commuters, 15.3%), and 30 to 34 minutes (190 commuters, 15.1%).
| Commute Time | # Commuters | % Commuters |
| Less than 5 Minutes | 233 | 18.5% |
| 5 to 9 Minutes | 65 | 5.2% |
| 10 to 14 Minutes | 193 | 15.3% |
| 15 to 19 Minutes | 89 | 7.1% |
| 20 to 24 Minutes | 139 | 11.0% |
| 25 to 29 Minutes | 10 | 0.8% |
| 30 to 34 Minutes | 190 | 15.1% |
| 35 to 39 Minutes | 70 | 5.6% |
| 40 to 44 Minutes | 51 | 4.1% |
| 45 to 59 Minutes | 87 | 6.9% |
| 60 to 89 Minutes | 132 | 10.5% |
| 90 or more Minutes | 0 | 0.0% |
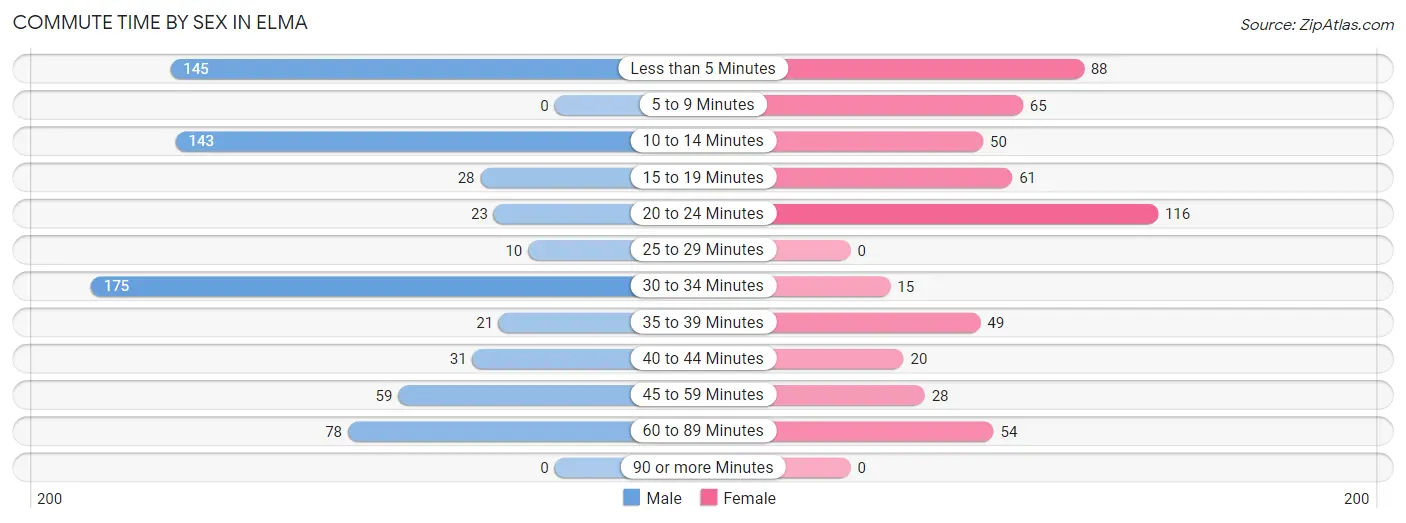
Commute Time by Sex in Elma
The most common commute times in Elma are 30 to 34 minutes (175 commuters, 24.5%) for males and 20 to 24 minutes (116 commuters, 21.2%) for females.
| Commute Time | Male | Female |
| Less than 5 Minutes | 145 (20.3%) | 88 (16.1%) |
| 5 to 9 Minutes | 0 (0.0%) | 65 (11.9%) |
| 10 to 14 Minutes | 143 (20.1%) | 50 (9.2%) |
| 15 to 19 Minutes | 28 (3.9%) | 61 (11.2%) |
| 20 to 24 Minutes | 23 (3.2%) | 116 (21.2%) |
| 25 to 29 Minutes | 10 (1.4%) | 0 (0.0%) |
| 30 to 34 Minutes | 175 (24.5%) | 15 (2.8%) |
| 35 to 39 Minutes | 21 (2.9%) | 49 (9.0%) |
| 40 to 44 Minutes | 31 (4.3%) | 20 (3.7%) |
| 45 to 59 Minutes | 59 (8.3%) | 28 (5.1%) |
| 60 to 89 Minutes | 78 (10.9%) | 54 (9.9%) |
| 90 or more Minutes | 0 (0.0%) | 0 (0.0%) |
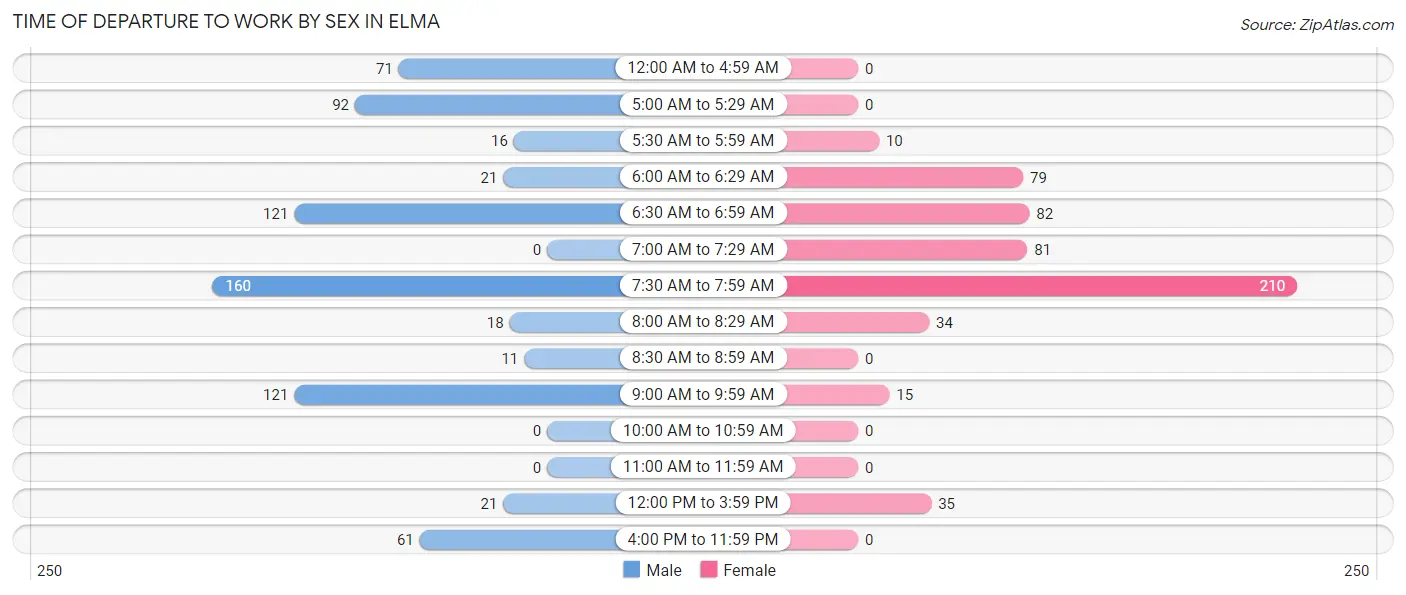
Time of Departure to Work by Sex in Elma
The most frequent times of departure to work in Elma are 7:30 AM to 7:59 AM (160, 22.4%) for males and 7:30 AM to 7:59 AM (210, 38.5%) for females.
| Time of Departure | Male | Female |
| 12:00 AM to 4:59 AM | 71 (10.0%) | 0 (0.0%) |
| 5:00 AM to 5:29 AM | 92 (12.9%) | 0 (0.0%) |
| 5:30 AM to 5:59 AM | 16 (2.2%) | 10 (1.8%) |
| 6:00 AM to 6:29 AM | 21 (2.9%) | 79 (14.5%) |
| 6:30 AM to 6:59 AM | 121 (17.0%) | 82 (15.0%) |
| 7:00 AM to 7:29 AM | 0 (0.0%) | 81 (14.8%) |
| 7:30 AM to 7:59 AM | 160 (22.4%) | 210 (38.5%) |
| 8:00 AM to 8:29 AM | 18 (2.5%) | 34 (6.2%) |
| 8:30 AM to 8:59 AM | 11 (1.5%) | 0 (0.0%) |
| 9:00 AM to 9:59 AM | 121 (17.0%) | 15 (2.8%) |
| 10:00 AM to 10:59 AM | 0 (0.0%) | 0 (0.0%) |
| 11:00 AM to 11:59 AM | 0 (0.0%) | 0 (0.0%) |
| 12:00 PM to 3:59 PM | 21 (2.9%) | 35 (6.4%) |
| 4:00 PM to 11:59 PM | 61 (8.6%) | 0 (0.0%) |
| Total | 713 (100.0%) | 546 (100.0%) |
Housing Occupancy in Elma
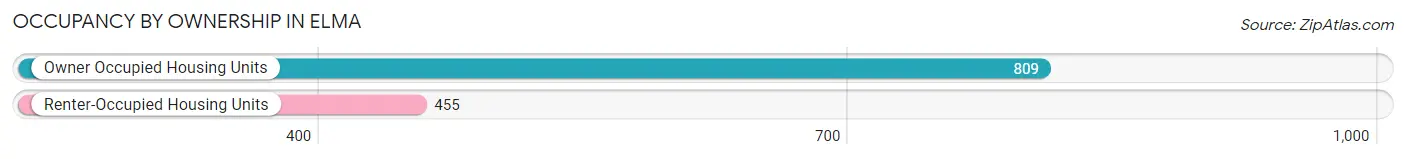
Occupancy by Ownership in Elma
Of the total 1,264 dwellings in Elma, owner-occupied units account for 809 (64.0%), while renter-occupied units make up 455 (36.0%).
| Occupancy | # Housing Units | % Housing Units |
| Owner Occupied Housing Units | 809 | 64.0% |
| Renter-Occupied Housing Units | 455 | 36.0% |
| Total Occupied Housing Units | 1,264 | 100.0% |
Occupancy by Household Size in Elma
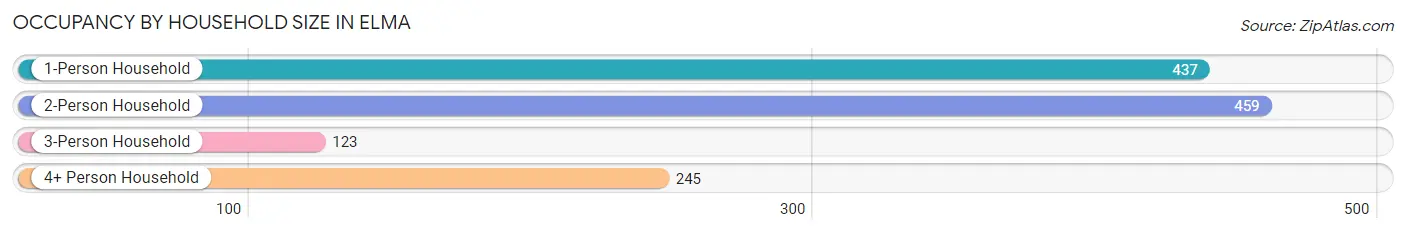
| Household Size | # Housing Units | % Housing Units |
| 1-Person Household | 437 | 34.6% |
| 2-Person Household | 459 | 36.3% |
| 3-Person Household | 123 | 9.7% |
| 4+ Person Household | 245 | 19.4% |
| Total Housing Units | 1,264 | 100.0% |
Occupancy by Ownership by Household Size in Elma
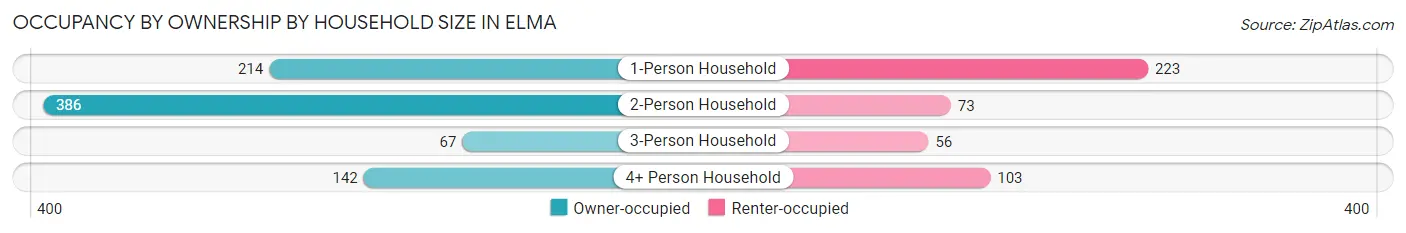
| Household Size | Owner-occupied | Renter-occupied |
| 1-Person Household | 214 (49.0%) | 223 (51.0%) |
| 2-Person Household | 386 (84.1%) | 73 (15.9%) |
| 3-Person Household | 67 (54.5%) | 56 (45.5%) |
| 4+ Person Household | 142 (58.0%) | 103 (42.0%) |
| Total Housing Units | 809 (64.0%) | 455 (36.0%) |
Occupancy by Educational Attainment in Elma
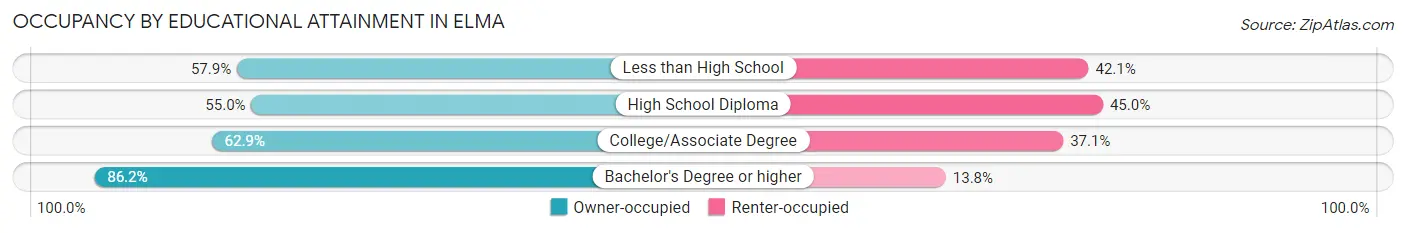
| Household Size | Owner-occupied | Renter-occupied |
| Less than High School | 77 (57.9%) | 56 (42.1%) |
| High School Diploma | 257 (55.0%) | 210 (45.0%) |
| College/Associate Degree | 263 (62.9%) | 155 (37.1%) |
| Bachelor's Degree or higher | 212 (86.2%) | 34 (13.8%) |
Occupancy by Age of Householder in Elma
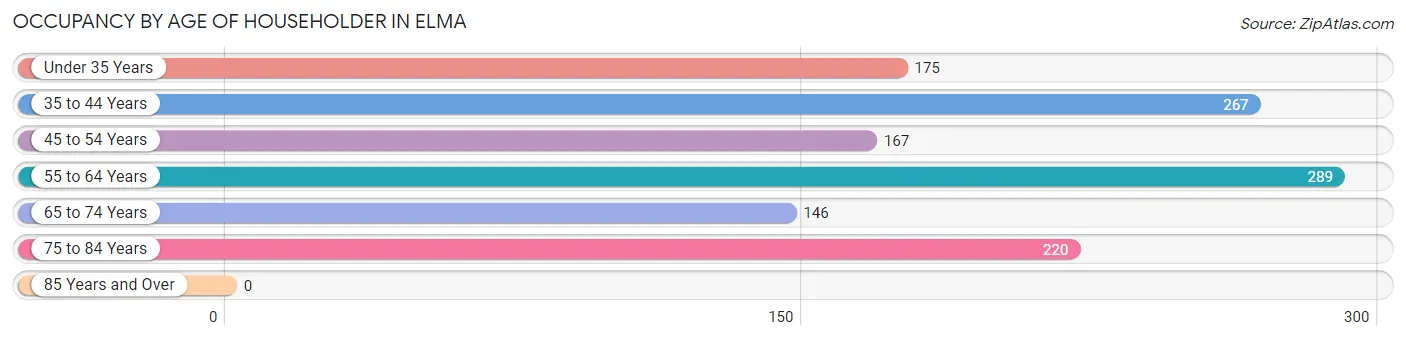
| Age Bracket | # Households | % Households |
| Under 35 Years | 175 | 13.8% |
| 35 to 44 Years | 267 | 21.1% |
| 45 to 54 Years | 167 | 13.2% |
| 55 to 64 Years | 289 | 22.9% |
| 65 to 74 Years | 146 | 11.6% |
| 75 to 84 Years | 220 | 17.4% |
| 85 Years and Over | 0 | 0.0% |
| Total | 1,264 | 100.0% |
Housing Finances in Elma
Median Income by Occupancy in Elma
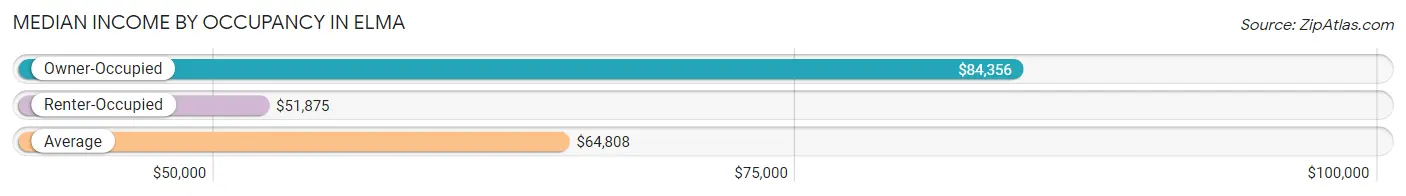
| Occupancy Type | # Households | Median Income |
| Owner-Occupied | 809 (64.0%) | $84,356 |
| Renter-Occupied | 455 (36.0%) | $51,875 |
| Average | 1,264 (100.0%) | $64,808 |
Occupancy by Householder Income Bracket in Elma
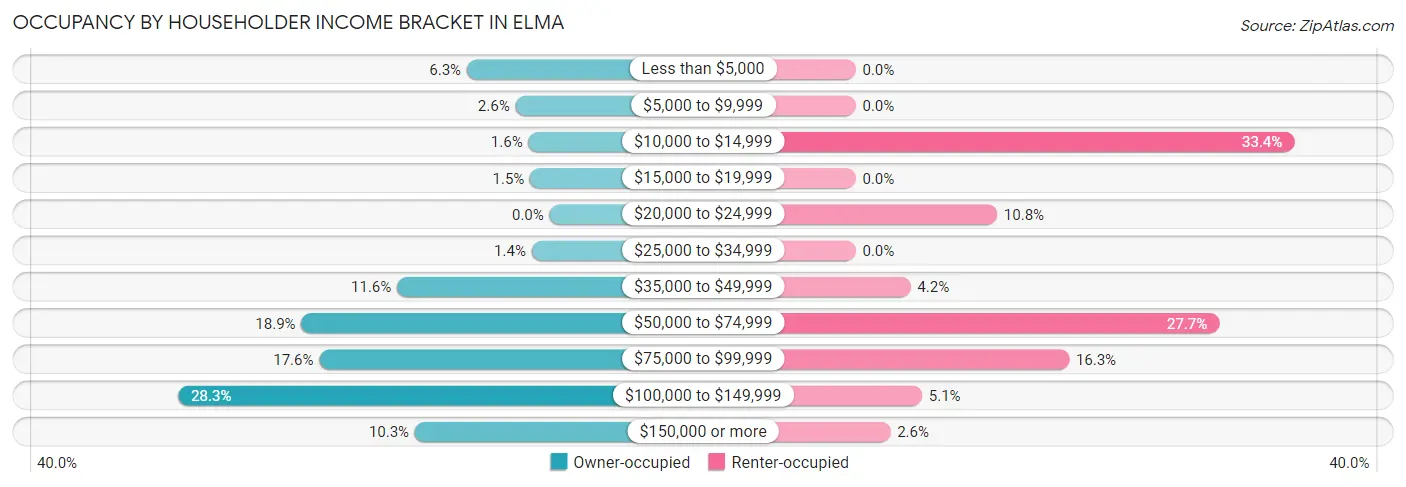
| Income Bracket | Owner-occupied | Renter-occupied |
| Less than $5,000 | 51 (6.3%) | 0 (0.0%) |
| $5,000 to $9,999 | 21 (2.6%) | 0 (0.0%) |
| $10,000 to $14,999 | 13 (1.6%) | 152 (33.4%) |
| $15,000 to $19,999 | 12 (1.5%) | 0 (0.0%) |
| $20,000 to $24,999 | 0 (0.0%) | 49 (10.8%) |
| $25,000 to $34,999 | 11 (1.4%) | 0 (0.0%) |
| $35,000 to $49,999 | 94 (11.6%) | 19 (4.2%) |
| $50,000 to $74,999 | 153 (18.9%) | 126 (27.7%) |
| $75,000 to $99,999 | 142 (17.5%) | 74 (16.3%) |
| $100,000 to $149,999 | 229 (28.3%) | 23 (5.1%) |
| $150,000 or more | 83 (10.3%) | 12 (2.6%) |
| Total | 809 (100.0%) | 455 (100.0%) |
Monthly Housing Cost Tiers in Elma
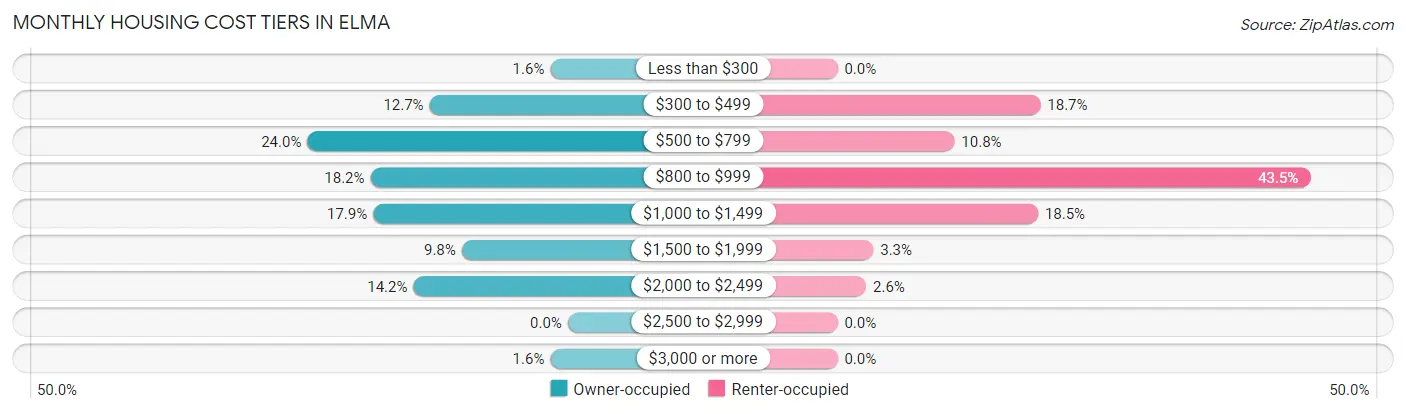
| Monthly Cost | Owner-occupied | Renter-occupied |
| Less than $300 | 13 (1.6%) | 0 (0.0%) |
| $300 to $499 | 103 (12.7%) | 85 (18.7%) |
| $500 to $799 | 194 (24.0%) | 49 (10.8%) |
| $800 to $999 | 147 (18.2%) | 198 (43.5%) |
| $1,000 to $1,499 | 145 (17.9%) | 84 (18.5%) |
| $1,500 to $1,999 | 79 (9.8%) | 15 (3.3%) |
| $2,000 to $2,499 | 115 (14.2%) | 12 (2.6%) |
| $2,500 to $2,999 | 0 (0.0%) | 0 (0.0%) |
| $3,000 or more | 13 (1.6%) | 0 (0.0%) |
| Total | 809 (100.0%) | 455 (100.0%) |
Physical Housing Characteristics in Elma
Housing Structures in Elma
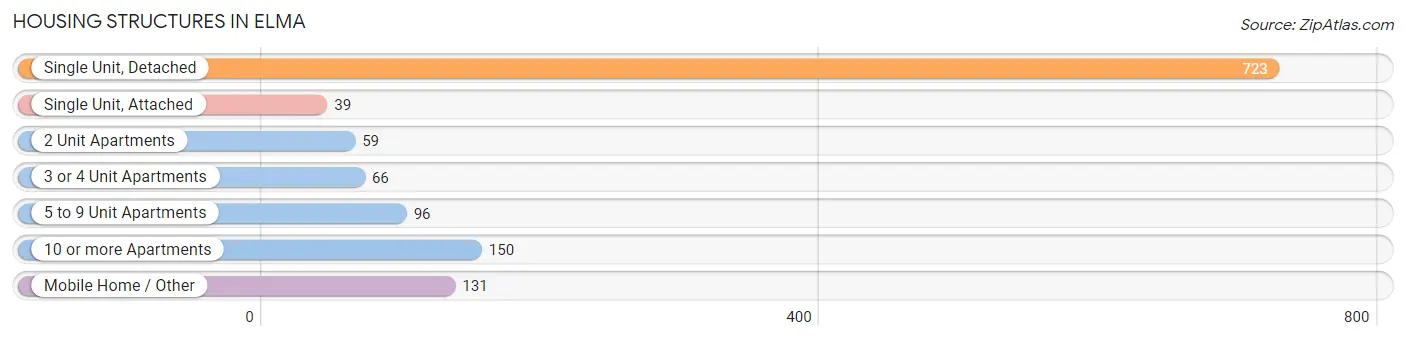
| Structure Type | # Housing Units | % Housing Units |
| Single Unit, Detached | 723 | 57.2% |
| Single Unit, Attached | 39 | 3.1% |
| 2 Unit Apartments | 59 | 4.7% |
| 3 or 4 Unit Apartments | 66 | 5.2% |
| 5 to 9 Unit Apartments | 96 | 7.6% |
| 10 or more Apartments | 150 | 11.9% |
| Mobile Home / Other | 131 | 10.4% |
| Total | 1,264 | 100.0% |
Housing Structures by Occupancy in Elma
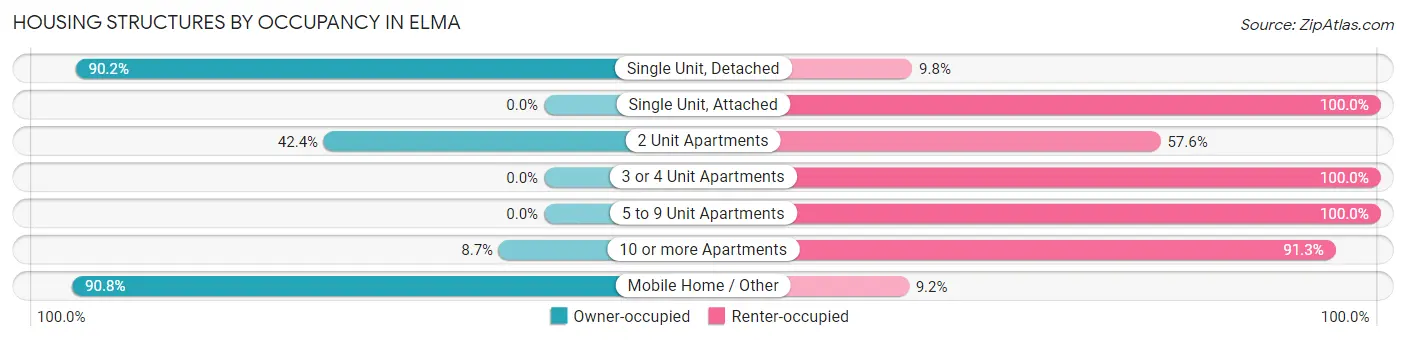
| Structure Type | Owner-occupied | Renter-occupied |
| Single Unit, Detached | 652 (90.2%) | 71 (9.8%) |
| Single Unit, Attached | 0 (0.0%) | 39 (100.0%) |
| 2 Unit Apartments | 25 (42.4%) | 34 (57.6%) |
| 3 or 4 Unit Apartments | 0 (0.0%) | 66 (100.0%) |
| 5 to 9 Unit Apartments | 0 (0.0%) | 96 (100.0%) |
| 10 or more Apartments | 13 (8.7%) | 137 (91.3%) |
| Mobile Home / Other | 119 (90.8%) | 12 (9.2%) |
| Total | 809 (64.0%) | 455 (36.0%) |
Housing Structures by Number of Rooms in Elma
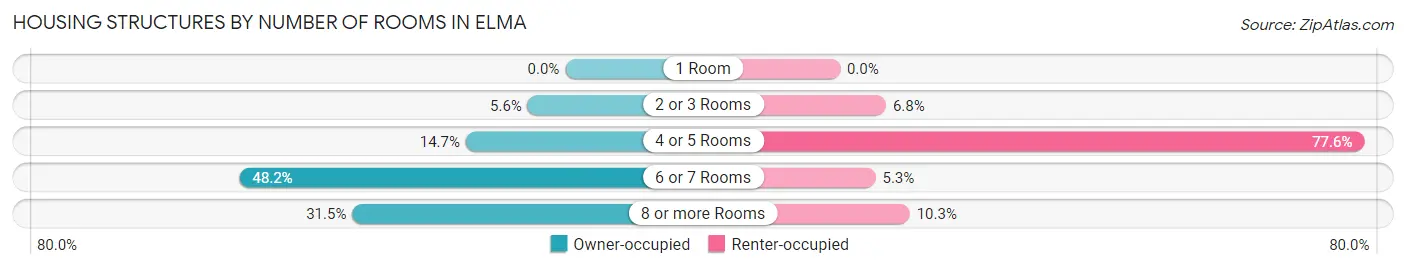
| Number of Rooms | Owner-occupied | Renter-occupied |
| 1 Room | 0 (0.0%) | 0 (0.0%) |
| 2 or 3 Rooms | 45 (5.6%) | 31 (6.8%) |
| 4 or 5 Rooms | 119 (14.7%) | 353 (77.6%) |
| 6 or 7 Rooms | 390 (48.2%) | 24 (5.3%) |
| 8 or more Rooms | 255 (31.5%) | 47 (10.3%) |
| Total | 809 (100.0%) | 455 (100.0%) |
Housing Structure by Heating Type in Elma
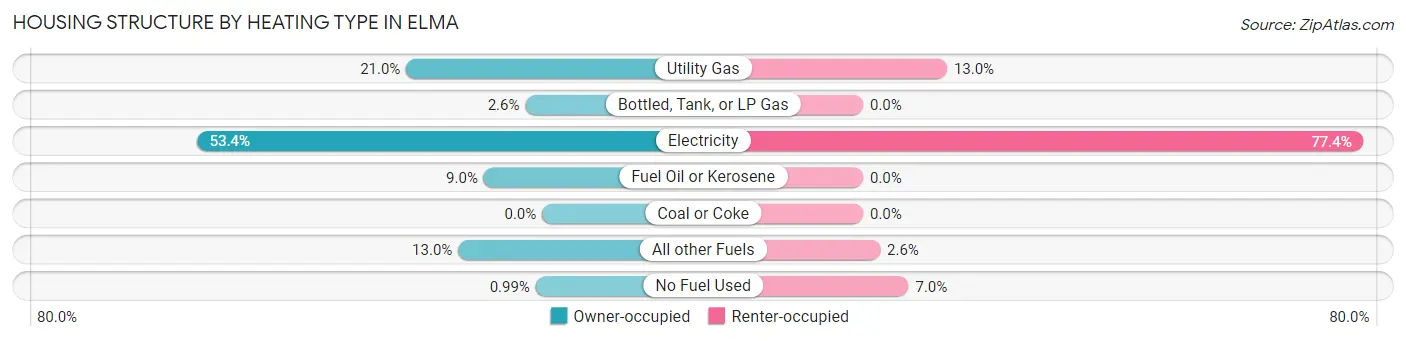
| Heating Type | Owner-occupied | Renter-occupied |
| Utility Gas | 170 (21.0%) | 59 (13.0%) |
| Bottled, Tank, or LP Gas | 21 (2.6%) | 0 (0.0%) |
| Electricity | 432 (53.4%) | 352 (77.4%) |
| Fuel Oil or Kerosene | 73 (9.0%) | 0 (0.0%) |
| Coal or Coke | 0 (0.0%) | 0 (0.0%) |
| All other Fuels | 105 (13.0%) | 12 (2.6%) |
| No Fuel Used | 8 (1.0%) | 32 (7.0%) |
| Total | 809 (100.0%) | 455 (100.0%) |
Household Vehicle Usage in Elma
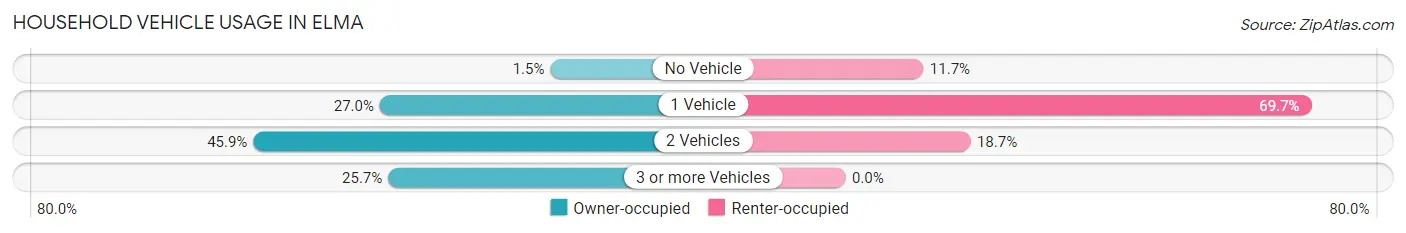
| Vehicles per Household | Owner-occupied | Renter-occupied |
| No Vehicle | 12 (1.5%) | 53 (11.7%) |
| 1 Vehicle | 218 (27.0%) | 317 (69.7%) |
| 2 Vehicles | 371 (45.9%) | 85 (18.7%) |
| 3 or more Vehicles | 208 (25.7%) | 0 (0.0%) |
| Total | 809 (100.0%) | 455 (100.0%) |
Real Estate & Mortgages in Elma
Real Estate and Mortgage Overview in Elma
| Characteristic | Without Mortgage | With Mortgage |
| Housing Units | 406 | 403 |
| Median Property Value | $239,200 | $334,900 |
| Median Household Income | $80,000 | $83 |
| Monthly Housing Costs | $550 | $13 |
| Real Estate Taxes | $2,274 | $46 |
Property Value by Mortgage Status in Elma
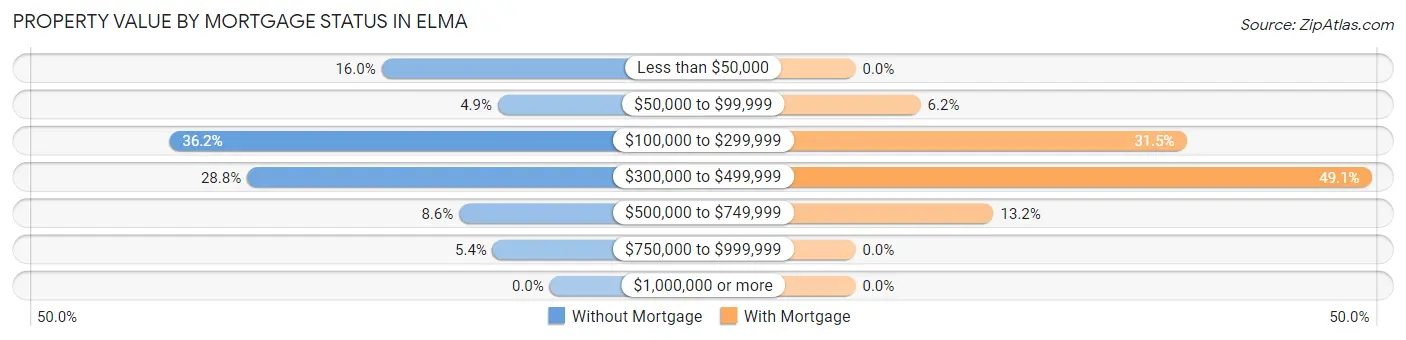
| Property Value | Without Mortgage | With Mortgage |
| Less than $50,000 | 65 (16.0%) | 0 (0.0%) |
| $50,000 to $99,999 | 20 (4.9%) | 25 (6.2%) |
| $100,000 to $299,999 | 147 (36.2%) | 127 (31.5%) |
| $300,000 to $499,999 | 117 (28.8%) | 198 (49.1%) |
| $500,000 to $749,999 | 35 (8.6%) | 53 (13.2%) |
| $750,000 to $999,999 | 22 (5.4%) | 0 (0.0%) |
| $1,000,000 or more | 0 (0.0%) | 0 (0.0%) |
| Total | 406 (100.0%) | 403 (100.0%) |
Household Income by Mortgage Status in Elma
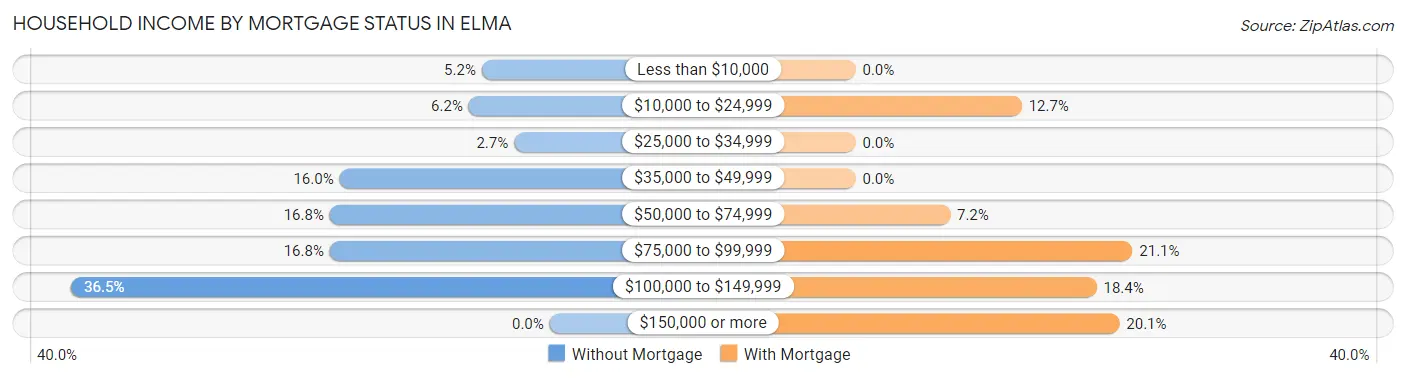
| Household Income | Without Mortgage | With Mortgage |
| Less than $10,000 | 21 (5.2%) | 0 (0.0%) |
| $10,000 to $24,999 | 25 (6.2%) | 51 (12.7%) |
| $25,000 to $34,999 | 11 (2.7%) | 0 (0.0%) |
| $35,000 to $49,999 | 65 (16.0%) | 0 (0.0%) |
| $50,000 to $74,999 | 68 (16.8%) | 29 (7.2%) |
| $75,000 to $99,999 | 68 (16.8%) | 85 (21.1%) |
| $100,000 to $149,999 | 148 (36.4%) | 74 (18.4%) |
| $150,000 or more | 0 (0.0%) | 81 (20.1%) |
| Total | 406 (100.0%) | 403 (100.0%) |
Property Value to Household Income Ratio in Elma
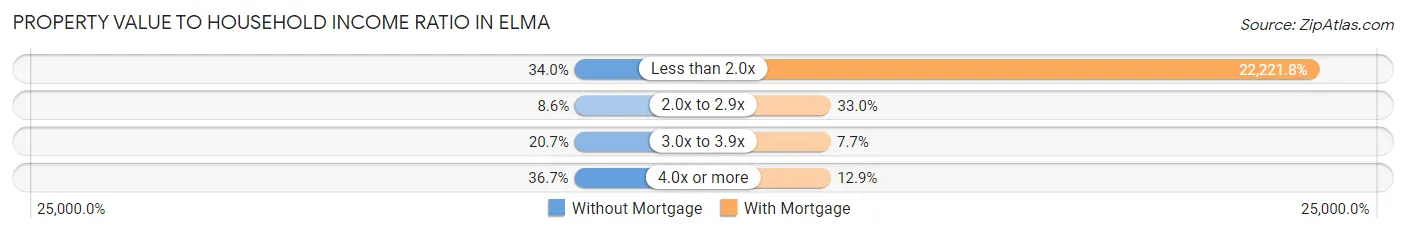
| Value-to-Income Ratio | Without Mortgage | With Mortgage |
| Less than 2.0x | 138 (34.0%) | 89,554 (22,221.8%) |
| 2.0x to 2.9x | 35 (8.6%) | 133 (33.0%) |
| 3.0x to 3.9x | 84 (20.7%) | 31 (7.7%) |
| 4.0x or more | 149 (36.7%) | 52 (12.9%) |
| Total | 406 (100.0%) | 403 (100.0%) |
Real Estate Taxes by Mortgage Status in Elma
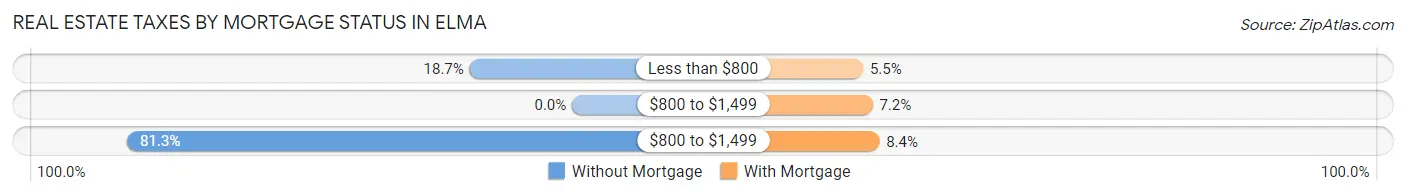
| Property Taxes | Without Mortgage | With Mortgage |
| Less than $800 | 76 (18.7%) | 22 (5.5%) |
| $800 to $1,499 | 0 (0.0%) | 29 (7.2%) |
| $800 to $1,499 | 330 (81.3%) | 34 (8.4%) |
| Total | 406 (100.0%) | 403 (100.0%) |
Health & Disability in Elma
Health Insurance Coverage by Age in Elma
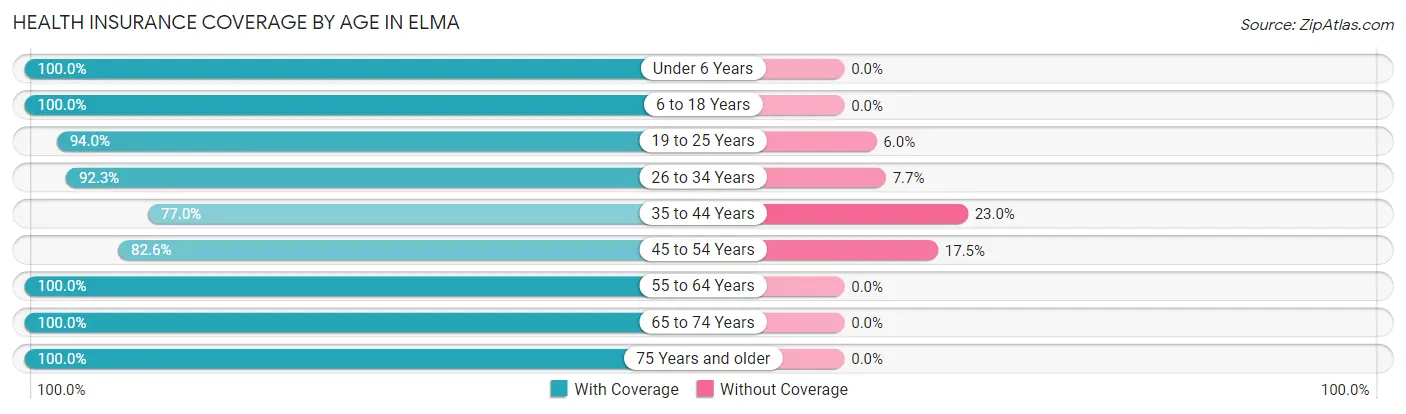
| Age Bracket | With Coverage | Without Coverage |
| Under 6 Years | 317 (100.0%) | 0 (0.0%) |
| 6 to 18 Years | 518 (100.0%) | 0 (0.0%) |
| 19 to 25 Years | 298 (94.0%) | 19 (6.0%) |
| 26 to 34 Years | 251 (92.3%) | 21 (7.7%) |
| 35 to 44 Years | 358 (77.0%) | 107 (23.0%) |
| 45 to 54 Years | 246 (82.6%) | 52 (17.4%) |
| 55 to 64 Years | 582 (100.0%) | 0 (0.0%) |
| 65 to 74 Years | 369 (100.0%) | 0 (0.0%) |
| 75 Years and older | 286 (100.0%) | 0 (0.0%) |
| Total | 3,225 (94.2%) | 199 (5.8%) |
Health Insurance Coverage by Citizenship Status in Elma
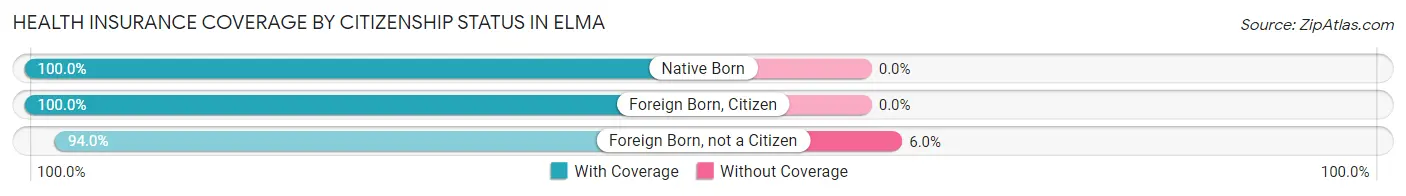
| Citizenship Status | With Coverage | Without Coverage |
| Native Born | 317 (100.0%) | 0 (0.0%) |
| Foreign Born, Citizen | 518 (100.0%) | 0 (0.0%) |
| Foreign Born, not a Citizen | 298 (94.0%) | 19 (6.0%) |
Health Insurance Coverage by Household Income in Elma
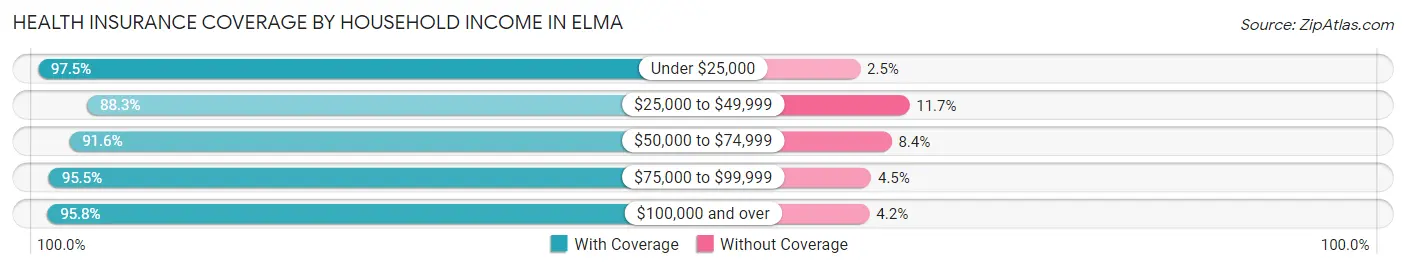
| Household Income | With Coverage | Without Coverage |
| Under $25,000 | 706 (97.5%) | 18 (2.5%) |
| $25,000 to $49,999 | 490 (88.3%) | 65 (11.7%) |
| $50,000 to $74,999 | 372 (91.6%) | 34 (8.4%) |
| $75,000 to $99,999 | 715 (95.5%) | 34 (4.5%) |
| $100,000 and over | 881 (95.8%) | 39 (4.2%) |
Public vs Private Health Insurance Coverage by Age in Elma
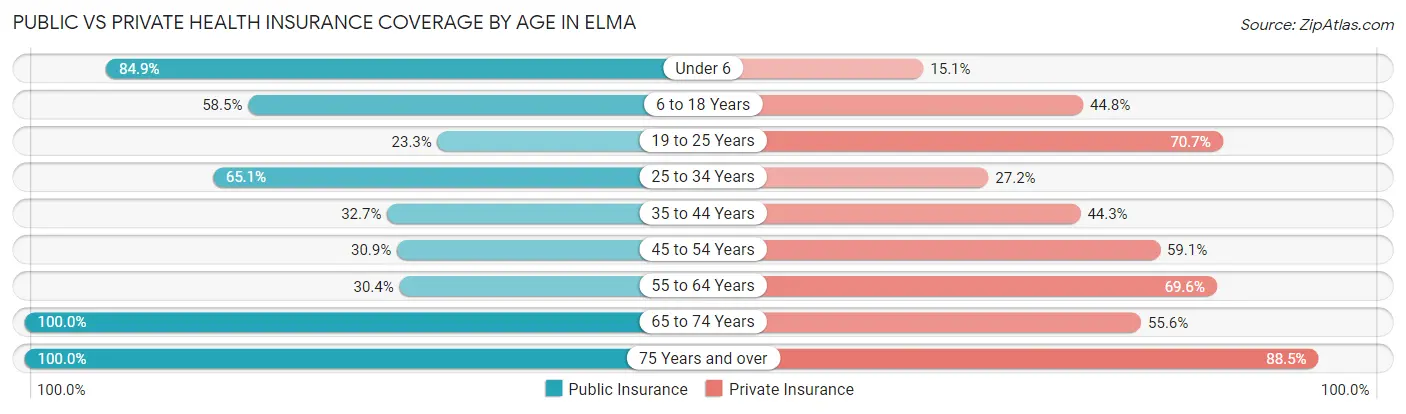
| Age Bracket | Public Insurance | Private Insurance |
| Under 6 | 269 (84.9%) | 48 (15.1%) |
| 6 to 18 Years | 303 (58.5%) | 232 (44.8%) |
| 19 to 25 Years | 74 (23.3%) | 224 (70.7%) |
| 25 to 34 Years | 177 (65.1%) | 74 (27.2%) |
| 35 to 44 Years | 152 (32.7%) | 206 (44.3%) |
| 45 to 54 Years | 92 (30.9%) | 176 (59.1%) |
| 55 to 64 Years | 177 (30.4%) | 405 (69.6%) |
| 65 to 74 Years | 369 (100.0%) | 205 (55.6%) |
| 75 Years and over | 286 (100.0%) | 253 (88.5%) |
| Total | 1,899 (55.5%) | 1,823 (53.2%) |
Disability Status by Sex by Age in Elma
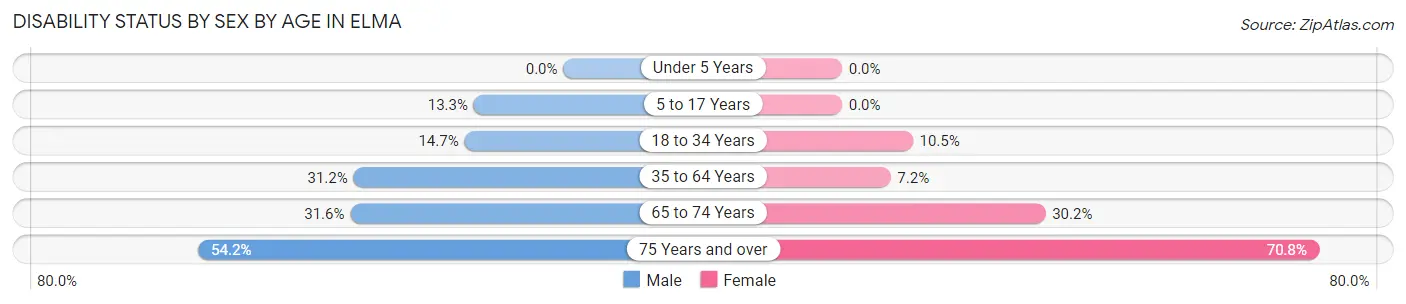
| Age Bracket | Male | Female |
| Under 5 Years | 0 (0.0%) | 0 (0.0%) |
| 5 to 17 Years | 25 (13.3%) | 0 (0.0%) |
| 18 to 34 Years | 53 (14.7%) | 29 (10.5%) |
| 35 to 64 Years | 225 (31.2%) | 45 (7.2%) |
| 65 to 74 Years | 56 (31.6%) | 58 (30.2%) |
| 75 Years and over | 90 (54.2%) | 85 (70.8%) |
Disability Class by Sex by Age in Elma
Disability Class: Hearing Difficulty
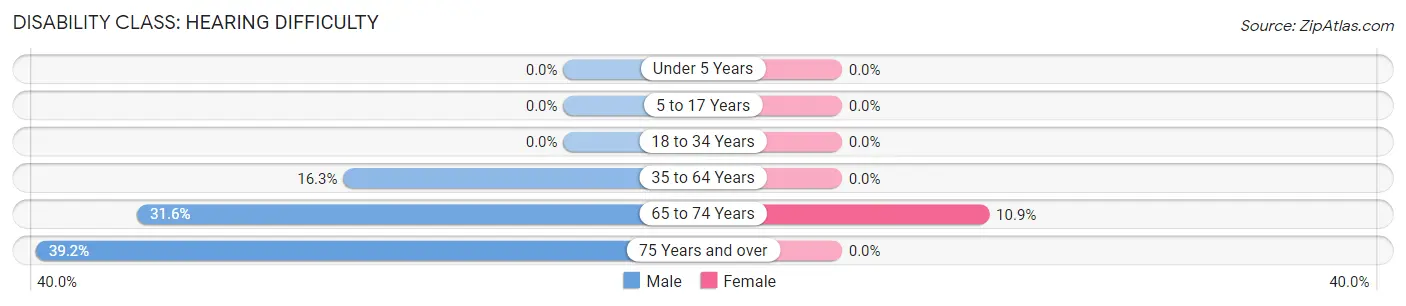
| Age Bracket | Male | Female |
| Under 5 Years | 0 (0.0%) | 0 (0.0%) |
| 5 to 17 Years | 0 (0.0%) | 0 (0.0%) |
| 18 to 34 Years | 0 (0.0%) | 0 (0.0%) |
| 35 to 64 Years | 118 (16.3%) | 0 (0.0%) |
| 65 to 74 Years | 56 (31.6%) | 21 (10.9%) |
| 75 Years and over | 65 (39.2%) | 0 (0.0%) |
Disability Class: Vision Difficulty
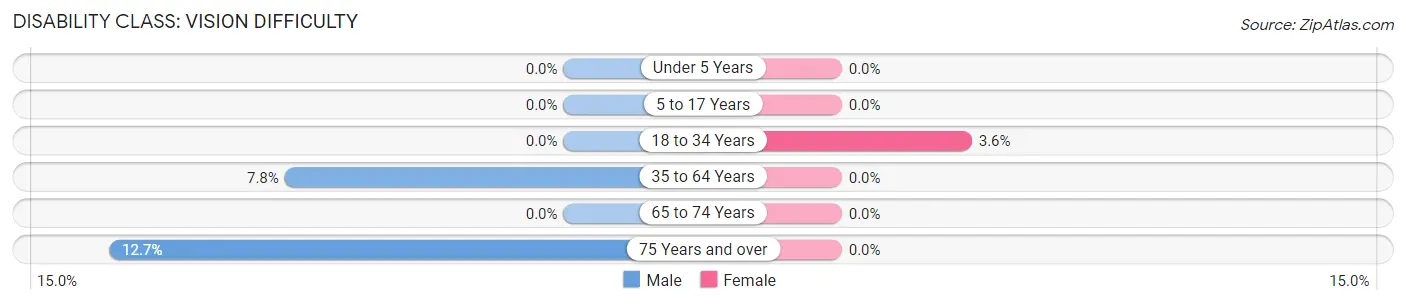
| Age Bracket | Male | Female |
| Under 5 Years | 0 (0.0%) | 0 (0.0%) |
| 5 to 17 Years | 0 (0.0%) | 0 (0.0%) |
| 18 to 34 Years | 0 (0.0%) | 10 (3.6%) |
| 35 to 64 Years | 56 (7.8%) | 0 (0.0%) |
| 65 to 74 Years | 0 (0.0%) | 0 (0.0%) |
| 75 Years and over | 21 (12.7%) | 0 (0.0%) |
Disability Class: Cognitive Difficulty
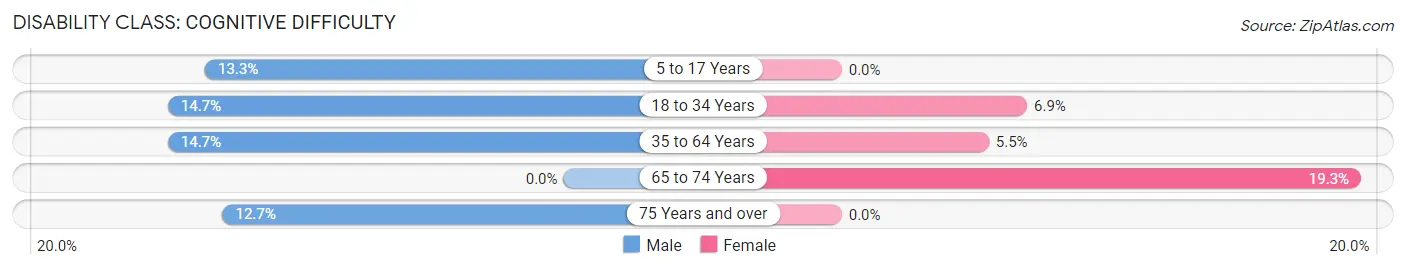
| Age Bracket | Male | Female |
| 5 to 17 Years | 25 (13.3%) | 0 (0.0%) |
| 18 to 34 Years | 53 (14.7%) | 19 (6.9%) |
| 35 to 64 Years | 106 (14.7%) | 34 (5.5%) |
| 65 to 74 Years | 0 (0.0%) | 37 (19.3%) |
| 75 Years and over | 21 (12.7%) | 0 (0.0%) |
Disability Class: Ambulatory Difficulty
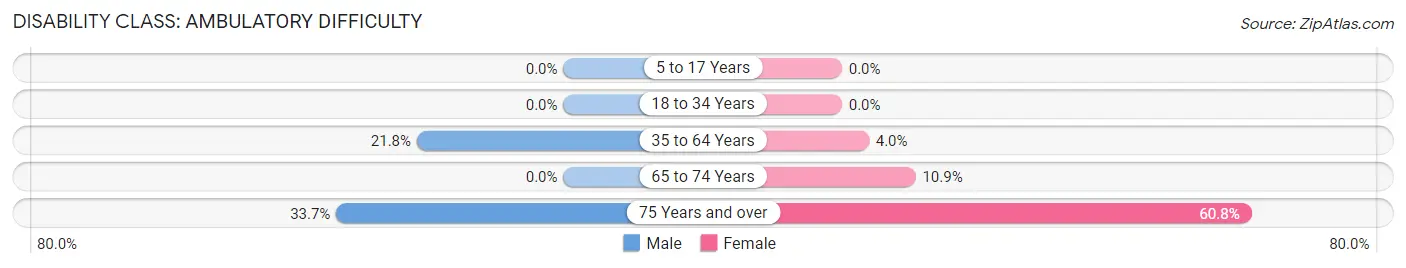
| Age Bracket | Male | Female |
| 5 to 17 Years | 0 (0.0%) | 0 (0.0%) |
| 18 to 34 Years | 0 (0.0%) | 0 (0.0%) |
| 35 to 64 Years | 157 (21.7%) | 25 (4.0%) |
| 65 to 74 Years | 0 (0.0%) | 21 (10.9%) |
| 75 Years and over | 56 (33.7%) | 73 (60.8%) |
Disability Class: Self-Care Difficulty
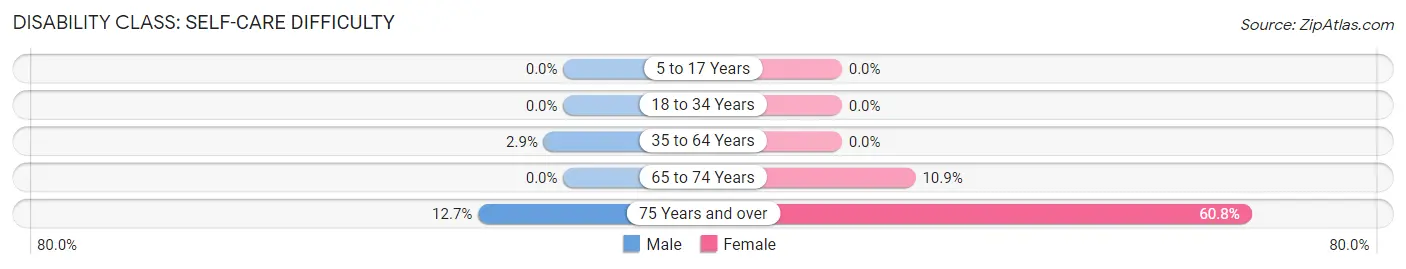
| Age Bracket | Male | Female |
| 5 to 17 Years | 0 (0.0%) | 0 (0.0%) |
| 18 to 34 Years | 0 (0.0%) | 0 (0.0%) |
| 35 to 64 Years | 21 (2.9%) | 0 (0.0%) |
| 65 to 74 Years | 0 (0.0%) | 21 (10.9%) |
| 75 Years and over | 21 (12.7%) | 73 (60.8%) |
Technology Access in Elma
Computing Device Access in Elma
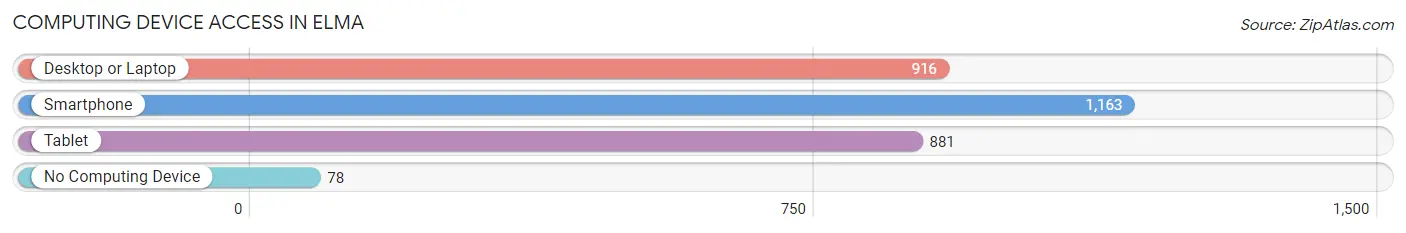
| Device Type | # Households | % Households |
| Desktop or Laptop | 916 | 72.5% |
| Smartphone | 1,163 | 92.0% |
| Tablet | 881 | 69.7% |
| No Computing Device | 78 | 6.2% |
| Total | 1,264 | 100.0% |
Internet Access in Elma
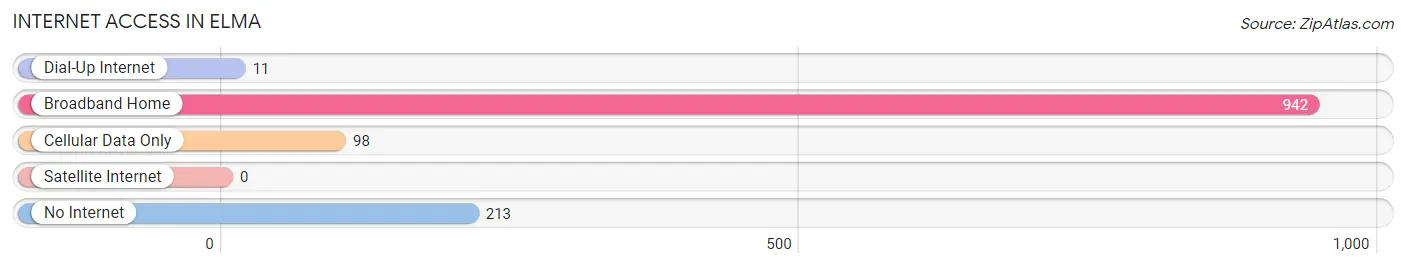
| Internet Type | # Households | % Households |
| Dial-Up Internet | 11 | 0.9% |
| Broadband Home | 942 | 74.5% |
| Cellular Data Only | 98 | 7.7% |
| Satellite Internet | 0 | 0.0% |
| No Internet | 213 | 16.9% |
| Total | 1,264 | 100.0% |
Elma Summary
Elma, Washington is a small city located in Grays Harbor County, Washington. It is situated on the Chehalis River, approximately 20 miles from the Pacific Ocean. The city is located in the foothills of the Olympic Mountains and is surrounded by lush forests and rolling hills. The population of Elma was 2,945 in the 2010 census, making it the largest city in Grays Harbor County.
Geography
Elma is located in the foothills of the Olympic Mountains, approximately 20 miles from the Pacific Ocean. The city is situated on the Chehalis River, which flows through the city and provides a source of recreation for the residents. The city is surrounded by lush forests and rolling hills, providing a beautiful backdrop for the city. The climate in Elma is mild, with temperatures ranging from the mid-50s in the winter to the mid-70s in the summer.
History
Elma was founded in 1891 by a group of settlers from the Midwest. The city was named after Elma, Iowa, the hometown of one of the settlers. The settlers were attracted to the area due to its abundance of natural resources, including timber, fish, and game. The city quickly grew and by the early 1900s, Elma had become a thriving logging and fishing community.
In the 1920s, Elma began to experience a decline in its economy due to the Great Depression. The city was able to survive the economic downturn and by the 1950s, Elma had become a popular tourist destination. The city was known for its beautiful scenery and outdoor activities, such as fishing, hunting, and camping.
Economy
Elma’s economy is largely based on the timber industry. The city is home to several lumber mills, which provide jobs for many of the city’s residents. The city is also home to several small businesses, including restaurants, retail stores, and service providers.
The city is also home to a number of manufacturing companies, including a paper mill and a furniture factory. The city is also home to a number of agricultural businesses, including dairy farms and fruit orchards.
Demographics
As of the 2010 census, the population of Elma was 2,945. The racial makeup of the city was 91.3% White, 0.7% African American, 0.7% Native American, 0.7% Asian, 0.2% Pacific Islander, and 5.9% from other races. The median household income in Elma was $37,917, and the median family income was $45,917.
Conclusion
Elma, Washington is a small city located in Grays Harbor County, Washington. It is situated on the Chehalis River, approximately 20 miles from the Pacific Ocean. The city is surrounded by lush forests and rolling hills, providing a beautiful backdrop for the city. The economy of Elma is largely based on the timber industry, and the city is also home to several small businesses, manufacturing companies, and agricultural businesses. The population of Elma was 2,945 in the 2010 census, and the median household income was $37,917.
Common Questions
What is Per Capita Income in Elma?
Per Capita income in Elma is $31,024.
What is the Median Family Income in Elma?
Median Family Income in Elma is $84,924.
What is the Median Household income in Elma?
Median Household Income in Elma is $64,808.
What is Income or Wage Gap in Elma?
Income or Wage Gap in Elma is 20.2%.
Women in Elma earn 79.8 cents for every dollar earned by a man.
What is Inequality or Gini Index in Elma?
Inequality or Gini Index in Elma is 0.40.
What is the Total Population of Elma?
Total Population of Elma is 3,426.
What is the Total Male Population of Elma?
Total Male Population of Elma is 1,860.
What is the Total Female Population of Elma?
Total Female Population of Elma is 1,566.
What is the Ratio of Males per 100 Females in Elma?
There are 118.77 Males per 100 Females in Elma.
What is the Ratio of Females per 100 Males in Elma?
There are 84.19 Females per 100 Males in Elma.
What is the Median Population Age in Elma?
Median Population Age in Elma is 40.7 Years.
What is the Average Family Size in Elma
Average Family Size in Elma is 3.5 People.
What is the Average Household Size in Elma
Average Household Size in Elma is 2.6 People.
How Large is the Labor Force in Elma?
There are 1,503 People in the Labor Forcein in Elma.
What is the Percentage of People in the Labor Force in Elma?
55.9% of People are in the Labor Force in Elma.
What is the Unemployment Rate in Elma?
Unemployment Rate in Elma is 6.1%.