Jamestown, WA Map & Demographics
Jamestown Map
Jamestown Overview
$55,843
PER CAPITA INCOME
$143,636
AVG FAMILY INCOME
$100,625
AVG HOUSEHOLD INCOME
0.37
INEQUALITY / GINI INDEX
326
TOTAL POPULATION
134
MALE POPULATION
192
FEMALE POPULATION
69.79
MALES / 100 FEMALES
143.28
FEMALES / 100 MALES
63.5
MEDIAN AGE
2.5
AVG FAMILY SIZE
2.0
AVG HOUSEHOLD SIZE
115
LABOR FORCE [ PEOPLE ]
38.6%
PERCENT IN LABOR FORCE
11.3%
UNEMPLOYMENT RATE
Income in Jamestown
Income Overview in Jamestown
Per Capita Income in Jamestown is $55,843, while median incomes of families and households are $143,636 and $100,625 respectively.
| Characteristic | Number | Measure |
| Per Capita Income | 326 | $55,843 |
| Median Family Income | 96 | $143,636 |
| Mean Family Income | 96 | $154,148 |
| Median Household Income | 164 | $100,625 |
| Mean Household Income | 164 | $108,826 |
| Income Deficit | 96 | $0 |
| Wage / Income Gap (%) | 326 | 0.00% |
| Wage / Income Gap ($) | 326 | 100.00¢ per $1 |
| Gini / Inequality Index | 326 | 0.37 |
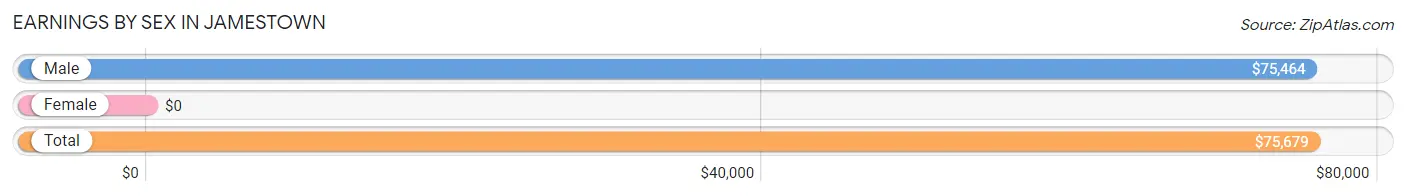
Earnings by Sex in Jamestown
| Sex | Number | Average Earnings |
| Male | 63 (52.9%) | $75,464 |
| Female | 56 (47.1%) | $0 |
| Total | 119 (100.0%) | $75,679 |
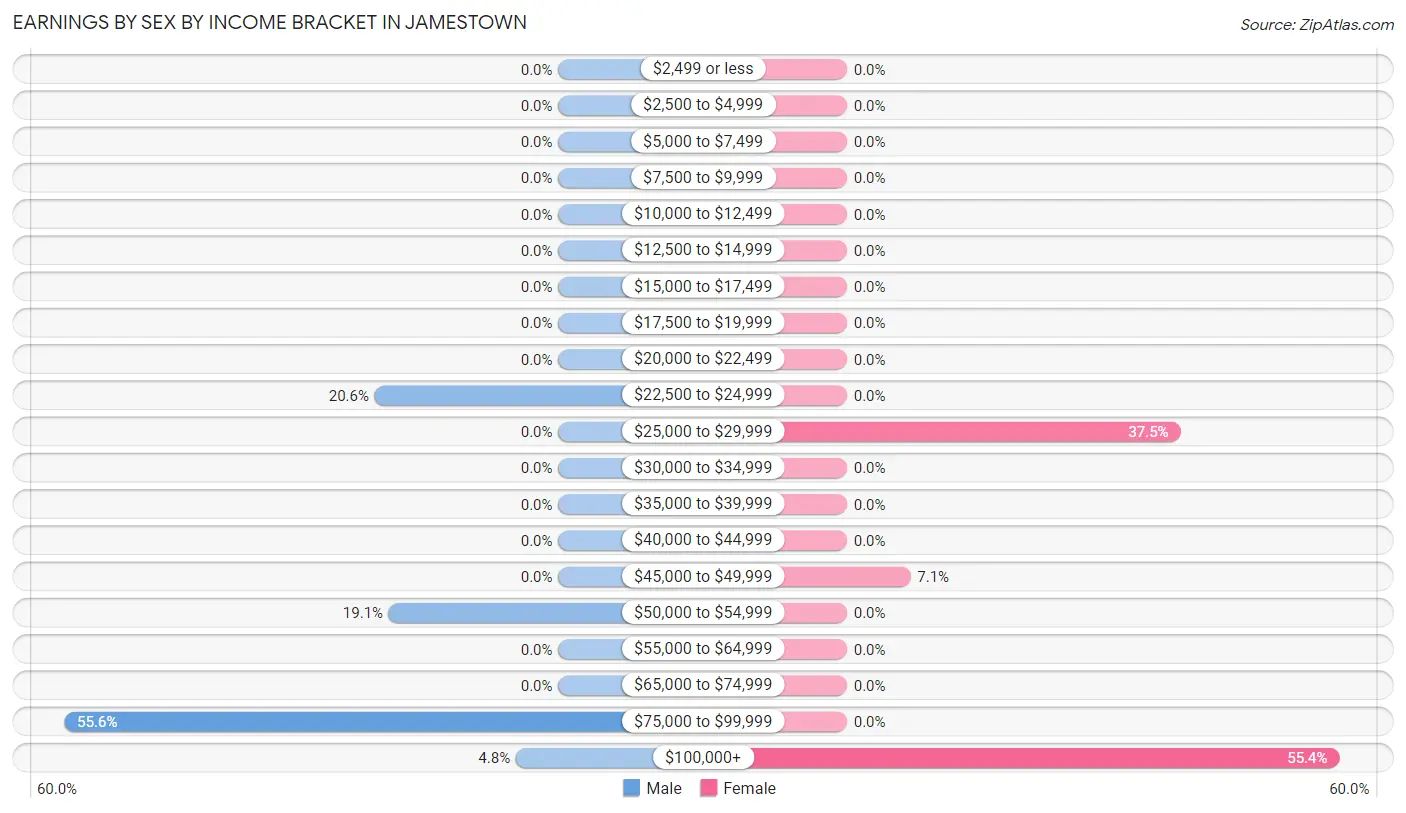
Earnings by Sex by Income Bracket in Jamestown
The most common earnings brackets in Jamestown are $75,000 to $99,999 for men (35 | 55.6%) and $100,000+ for women (31 | 55.4%).
| Income | Male | Female |
| $2,499 or less | 0 (0.0%) | 0 (0.0%) |
| $2,500 to $4,999 | 0 (0.0%) | 0 (0.0%) |
| $5,000 to $7,499 | 0 (0.0%) | 0 (0.0%) |
| $7,500 to $9,999 | 0 (0.0%) | 0 (0.0%) |
| $10,000 to $12,499 | 0 (0.0%) | 0 (0.0%) |
| $12,500 to $14,999 | 0 (0.0%) | 0 (0.0%) |
| $15,000 to $17,499 | 0 (0.0%) | 0 (0.0%) |
| $17,500 to $19,999 | 0 (0.0%) | 0 (0.0%) |
| $20,000 to $22,499 | 0 (0.0%) | 0 (0.0%) |
| $22,500 to $24,999 | 13 (20.6%) | 0 (0.0%) |
| $25,000 to $29,999 | 0 (0.0%) | 21 (37.5%) |
| $30,000 to $34,999 | 0 (0.0%) | 0 (0.0%) |
| $35,000 to $39,999 | 0 (0.0%) | 0 (0.0%) |
| $40,000 to $44,999 | 0 (0.0%) | 0 (0.0%) |
| $45,000 to $49,999 | 0 (0.0%) | 4 (7.1%) |
| $50,000 to $54,999 | 12 (19.1%) | 0 (0.0%) |
| $55,000 to $64,999 | 0 (0.0%) | 0 (0.0%) |
| $65,000 to $74,999 | 0 (0.0%) | 0 (0.0%) |
| $75,000 to $99,999 | 35 (55.6%) | 0 (0.0%) |
| $100,000+ | 3 (4.8%) | 31 (55.4%) |
| Total | 63 (100.0%) | 56 (100.0%) |
Earnings by Sex by Educational Attainment in Jamestown
| Educational Attainment | Male Income | Female Income |
| Less than High School | - | - |
| High School Diploma | - | - |
| College or Associate's Degree | - | - |
| Bachelor's Degree | - | - |
| Graduate Degree | - | - |
| Total | $75,464 | $0 |
Family Income in Jamestown
Family Income Brackets in Jamestown
According to the Jamestown family income data, there are 42 families falling into the $100,000 to $149,999 income range, which is the most common income bracket and makes up 43.8% of all families.
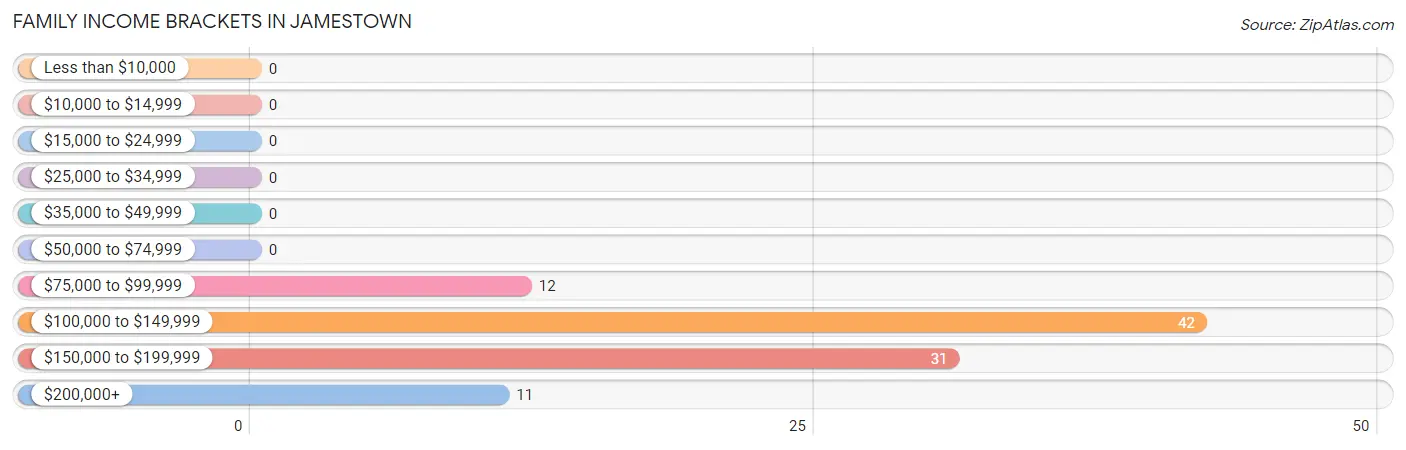
| Income Bracket | # Families | % Families |
| Less than $10,000 | 0 | 0.0% |
| $10,000 to $14,999 | 0 | 0.0% |
| $15,000 to $24,999 | 0 | 0.0% |
| $25,000 to $34,999 | 0 | 0.0% |
| $35,000 to $49,999 | 0 | 0.0% |
| $50,000 to $74,999 | 0 | 0.0% |
| $75,000 to $99,999 | 12 | 12.5% |
| $100,000 to $149,999 | 42 | 43.8% |
| $150,000 to $199,999 | 31 | 32.3% |
| $200,000+ | 11 | 11.5% |
Family Income by Famaliy Size in Jamestown
2-person families (53 | 55.2%) account for the highest median family income in Jamestown with $113,977 per family, while 2-person families (53 | 55.2%) have the highest median income of $56,988 per family member.
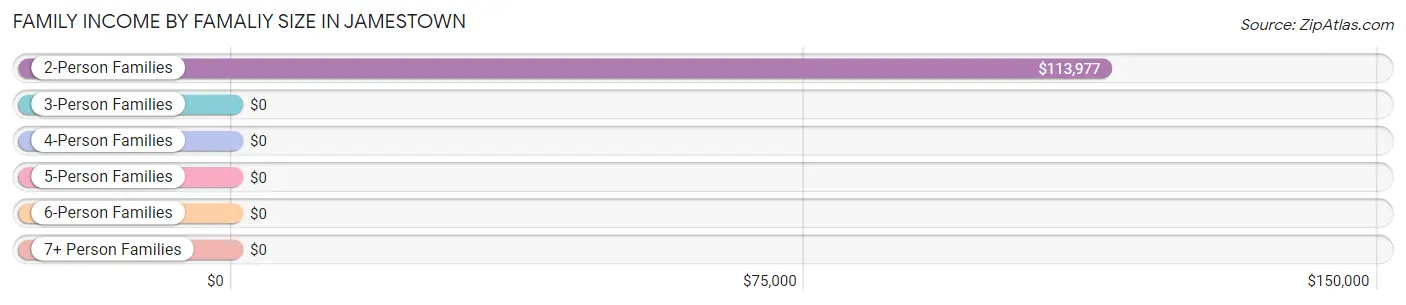
| Income Bracket | # Families | Median Income |
| 2-Person Families | 53 (55.2%) | $113,977 |
| 3-Person Families | 43 (44.8%) | $0 |
| 4-Person Families | 0 (0.0%) | $0 |
| 5-Person Families | 0 (0.0%) | $0 |
| 6-Person Families | 0 (0.0%) | $0 |
| 7+ Person Families | 0 (0.0%) | $0 |
| Total | 96 (100.0%) | $143,636 |
Family Income by Number of Earners in Jamestown
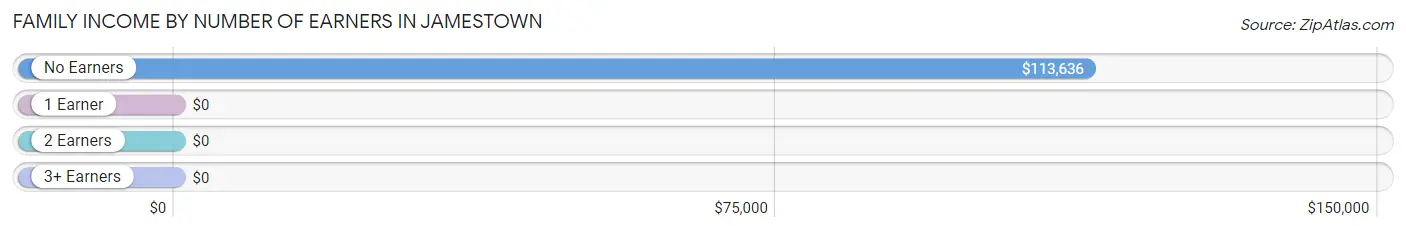
| Number of Earners | # Families | Median Income |
| No Earners | 50 (52.1%) | $113,636 |
| 1 Earner | 3 (3.1%) | $0 |
| 2 Earners | 31 (32.3%) | $0 |
| 3+ Earners | 12 (12.5%) | $0 |
| Total | 96 (100.0%) | $143,636 |
Household Income in Jamestown
Household Income Brackets in Jamestown
With 42 households falling in the category, the $35,000 to $49,999 income range is the most frequent in Jamestown, accounting for 25.6% of all households.
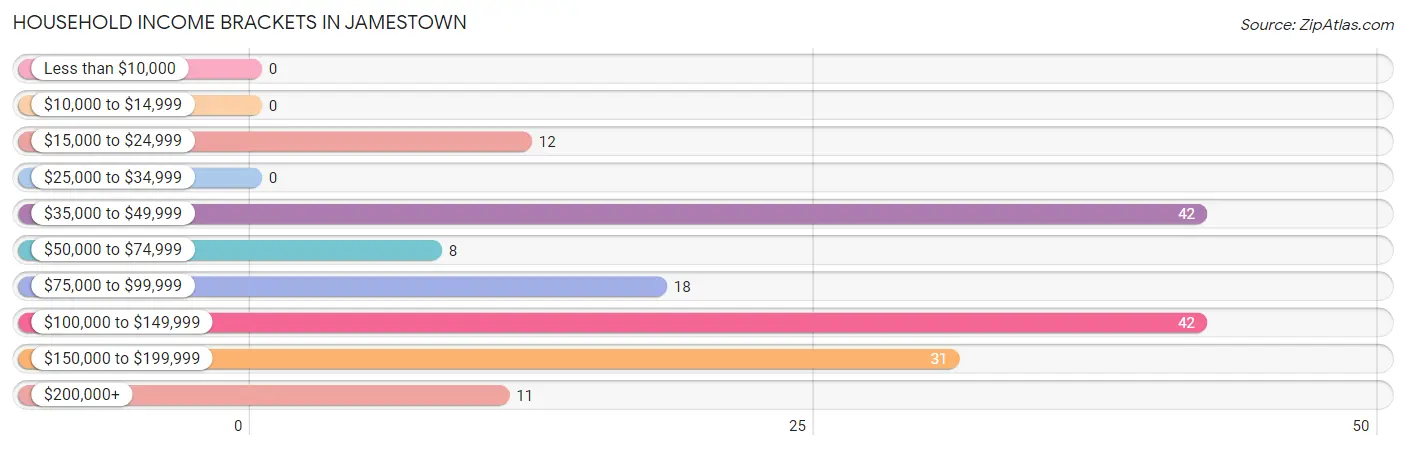
| Income Bracket | # Households | % Households |
| Less than $10,000 | 0 | 0.0% |
| $10,000 to $14,999 | 0 | 0.0% |
| $15,000 to $24,999 | 12 | 7.3% |
| $25,000 to $34,999 | 0 | 0.0% |
| $35,000 to $49,999 | 42 | 25.6% |
| $50,000 to $74,999 | 8 | 4.9% |
| $75,000 to $99,999 | 18 | 11.0% |
| $100,000 to $149,999 | 42 | 25.6% |
| $150,000 to $199,999 | 31 | 18.9% |
| $200,000+ | 11 | 6.7% |
Household Income by Householder Age in Jamestown
The median household income in Jamestown is $100,625, with the highest median household income of $109,792 found in the 45 to 64 years age bracket for the primary householder. A total of 30 households (18.3%) fall into this category.
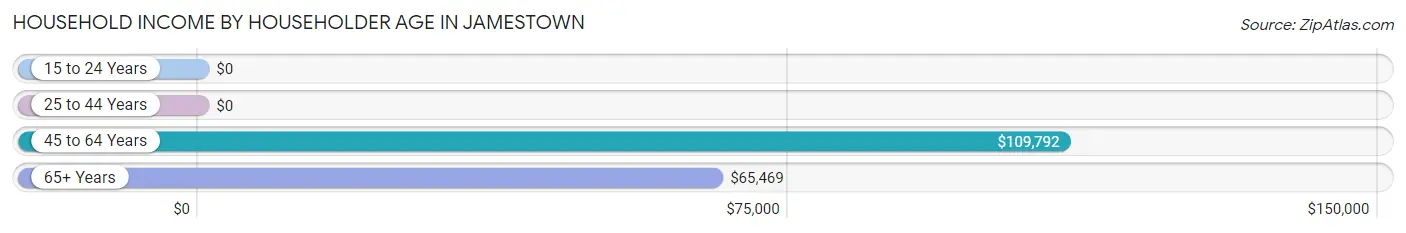
| Income Bracket | # Households | Median Income |
| 15 to 24 Years | 0 (0.0%) | $0 |
| 25 to 44 Years | 31 (18.9%) | $0 |
| 45 to 64 Years | 30 (18.3%) | $109,792 |
| 65+ Years | 103 (62.8%) | $65,469 |
| Total | 164 (100.0%) | $100,625 |
Poverty in Jamestown
Income Below Poverty by Sex and Age in Jamestown
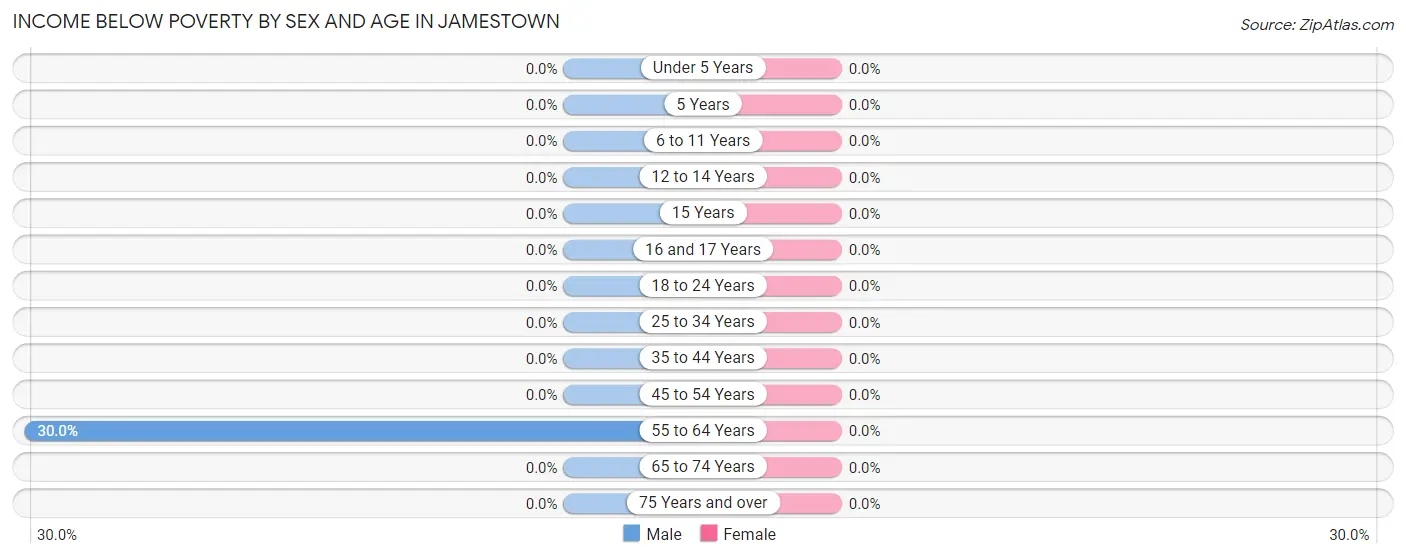
| Age Bracket | Male | Female |
| Under 5 Years | 0 (0.0%) | 0 (0.0%) |
| 5 Years | 0 (0.0%) | 0 (0.0%) |
| 6 to 11 Years | 0 (0.0%) | 0 (0.0%) |
| 12 to 14 Years | 0 (0.0%) | 0 (0.0%) |
| 15 Years | 0 (0.0%) | 0 (0.0%) |
| 16 and 17 Years | 0 (0.0%) | 0 (0.0%) |
| 18 to 24 Years | 0 (0.0%) | 0 (0.0%) |
| 25 to 34 Years | 0 (0.0%) | 0 (0.0%) |
| 35 to 44 Years | 0 (0.0%) | 0 (0.0%) |
| 45 to 54 Years | 0 (0.0%) | 0 (0.0%) |
| 55 to 64 Years | 12 (30.0%) | 0 (0.0%) |
| 65 to 74 Years | 0 (0.0%) | 0 (0.0%) |
| 75 Years and over | 0 (0.0%) | 0 (0.0%) |
| Total | 12 (9.0%) | 0 (0.0%) |
Income Above Poverty by Sex and Age in Jamestown
According to the poverty statistics in Jamestown, males aged 35 to 44 years and females aged 5 years are the age groups that are most secure financially, with 100.0% of males and 100.0% of females in these age groups living above the poverty line.
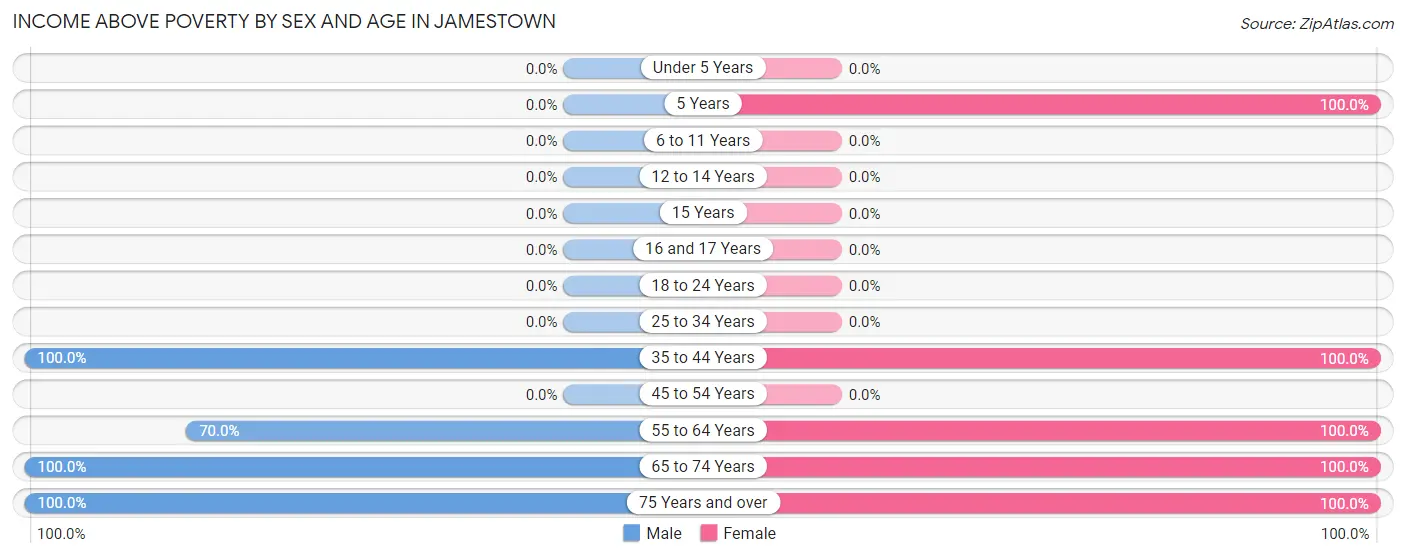
| Age Bracket | Male | Female |
| Under 5 Years | 0 (0.0%) | 0 (0.0%) |
| 5 Years | 0 (0.0%) | 28 (100.0%) |
| 6 to 11 Years | 0 (0.0%) | 0 (0.0%) |
| 12 to 14 Years | 0 (0.0%) | 0 (0.0%) |
| 15 Years | 0 (0.0%) | 0 (0.0%) |
| 16 and 17 Years | 0 (0.0%) | 0 (0.0%) |
| 18 to 24 Years | 0 (0.0%) | 0 (0.0%) |
| 25 to 34 Years | 0 (0.0%) | 0 (0.0%) |
| 35 to 44 Years | 35 (100.0%) | 31 (100.0%) |
| 45 to 54 Years | 0 (0.0%) | 0 (0.0%) |
| 55 to 64 Years | 28 (70.0%) | 41 (100.0%) |
| 65 to 74 Years | 31 (100.0%) | 46 (100.0%) |
| 75 Years and over | 28 (100.0%) | 46 (100.0%) |
| Total | 122 (91.0%) | 192 (100.0%) |
Income Below Poverty Among Married-Couple Families in Jamestown
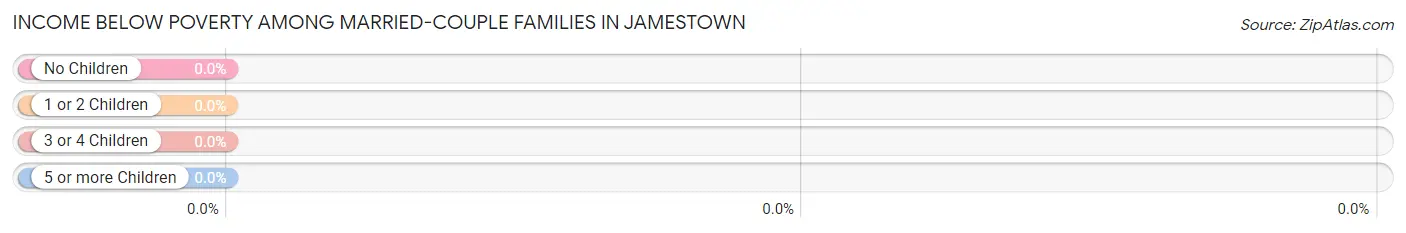
| Children | Above Poverty | Below Poverty |
| No Children | 65 (100.0%) | 0 (0.0%) |
| 1 or 2 Children | 31 (100.0%) | 0 (0.0%) |
| 3 or 4 Children | 0 (0.0%) | 0 (0.0%) |
| 5 or more Children | 0 (0.0%) | 0 (0.0%) |
| Total | 96 (100.0%) | 0 (0.0%) |
Income Below Poverty Among Single-Parent Households in Jamestown
| Children | Single Father | Single Mother |
| No Children | 0 (0.0%) | 0 (0.0%) |
| 1 or 2 Children | 0 (0.0%) | 0 (0.0%) |
| 3 or 4 Children | 0 (0.0%) | 0 (0.0%) |
| 5 or more Children | 0 (0.0%) | 0 (0.0%) |
| Total | 0 (0.0%) | 0 (0.0%) |
Income Below Poverty Among Married-Couple vs Single-Parent Households in Jamestown
| Children | Married-Couple Families | Single-Parent Households |
| No Children | 0 (0.0%) | 0 (0.0%) |
| 1 or 2 Children | 0 (0.0%) | 0 (0.0%) |
| 3 or 4 Children | 0 (0.0%) | 0 (0.0%) |
| 5 or more Children | 0 (0.0%) | 0 (0.0%) |
| Total | 0 (0.0%) | 0 (0.0%) |
Race in Jamestown
The most populous races in Jamestown are White / Caucasian (290 | 89.0%), Native / Alaskan (24 | 7.4%), and Two or more Races (6 | 1.8%).
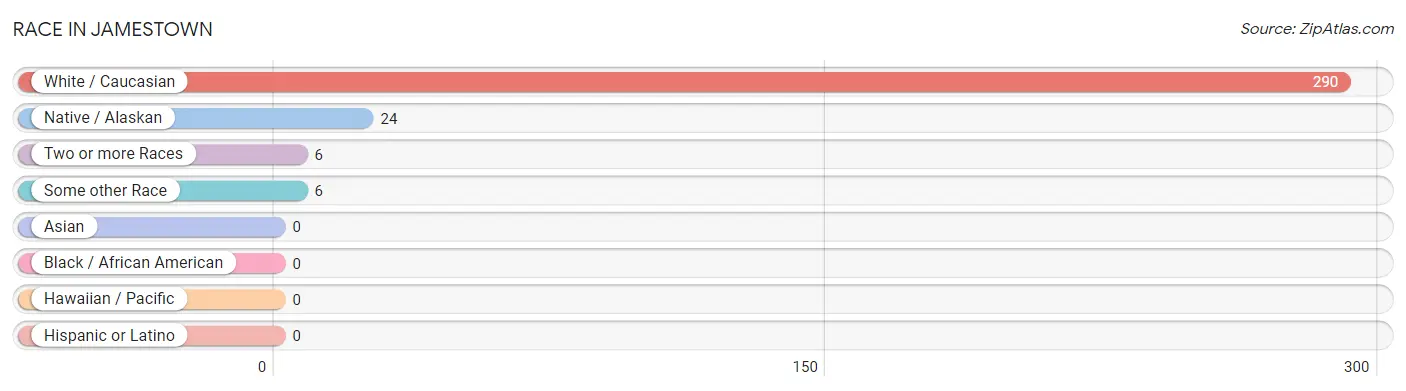
| Race | # Population | % Population |
| Asian | 0 | 0.0% |
| Black / African American | 0 | 0.0% |
| Hawaiian / Pacific | 0 | 0.0% |
| Hispanic or Latino | 0 | 0.0% |
| Native / Alaskan | 24 | 7.4% |
| White / Caucasian | 290 | 89.0% |
| Two or more Races | 6 | 1.8% |
| Some other Race | 6 | 1.8% |
| Total | 326 | 100.0% |
Ancestry in Jamestown
The most populous ancestries reported in Jamestown are Irish (113 | 34.7%), French (59 | 18.1%), German (46 | 14.1%), American (33 | 10.1%), and Czech (24 | 7.4%), together accounting for 84.4% of all Jamestown residents.
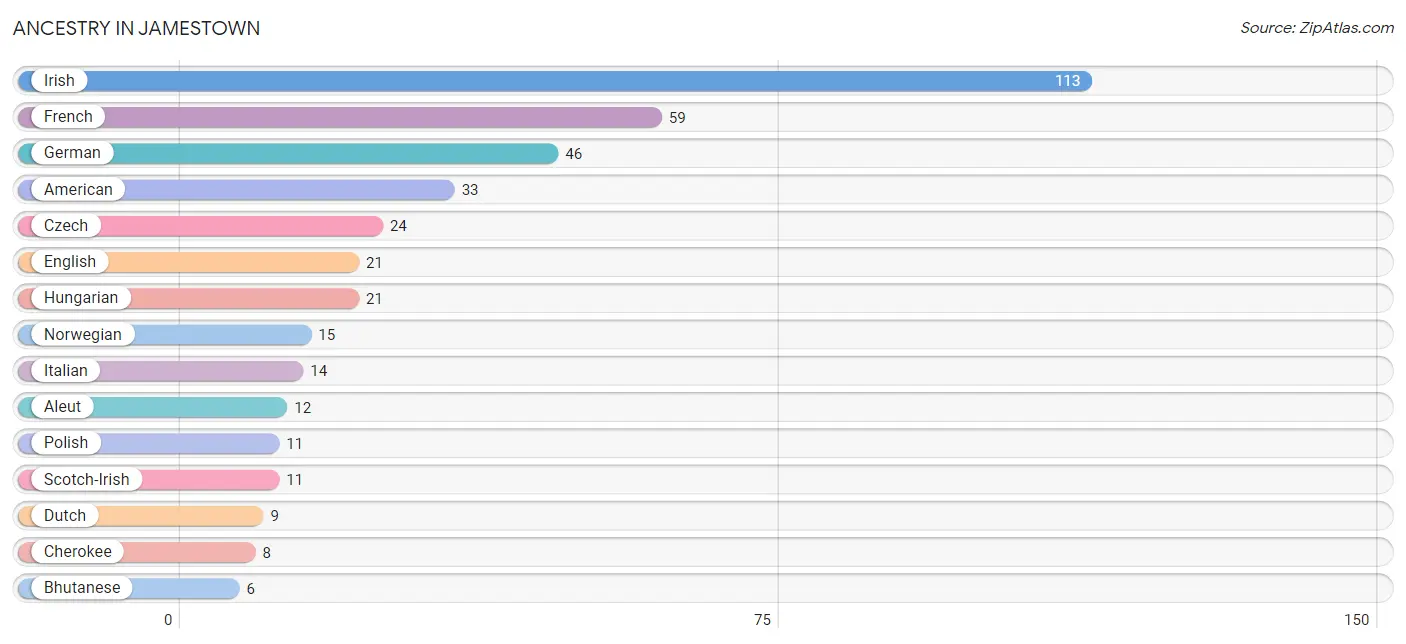
| Ancestry | # Population | % Population |
| Aleut | 12 | 3.7% |
| American | 33 | 10.1% |
| Bhutanese | 6 | 1.8% |
| Cherokee | 8 | 2.5% |
| Czech | 24 | 7.4% |
| Dutch | 9 | 2.8% |
| English | 21 | 6.4% |
| European | 3 | 0.9% |
| French | 59 | 18.1% |
| German | 46 | 14.1% |
| Hungarian | 21 | 6.4% |
| Irish | 113 | 34.7% |
| Italian | 14 | 4.3% |
| Native Hawaiian | 6 | 1.8% |
| Norwegian | 15 | 4.6% |
| Polish | 11 | 3.4% |
| Scotch-Irish | 11 | 3.4% | View All 17 Rows |
Immigrants in Jamestown

| Immigration Origin | # Population | % Population | View All 0 Rows |
Sex and Age in Jamestown
Sex and Age in Jamestown
The most populous age groups in Jamestown are 35 to 39 Years (35 | 26.1%) for men and 65 to 69 Years (40 | 20.8%) for women.
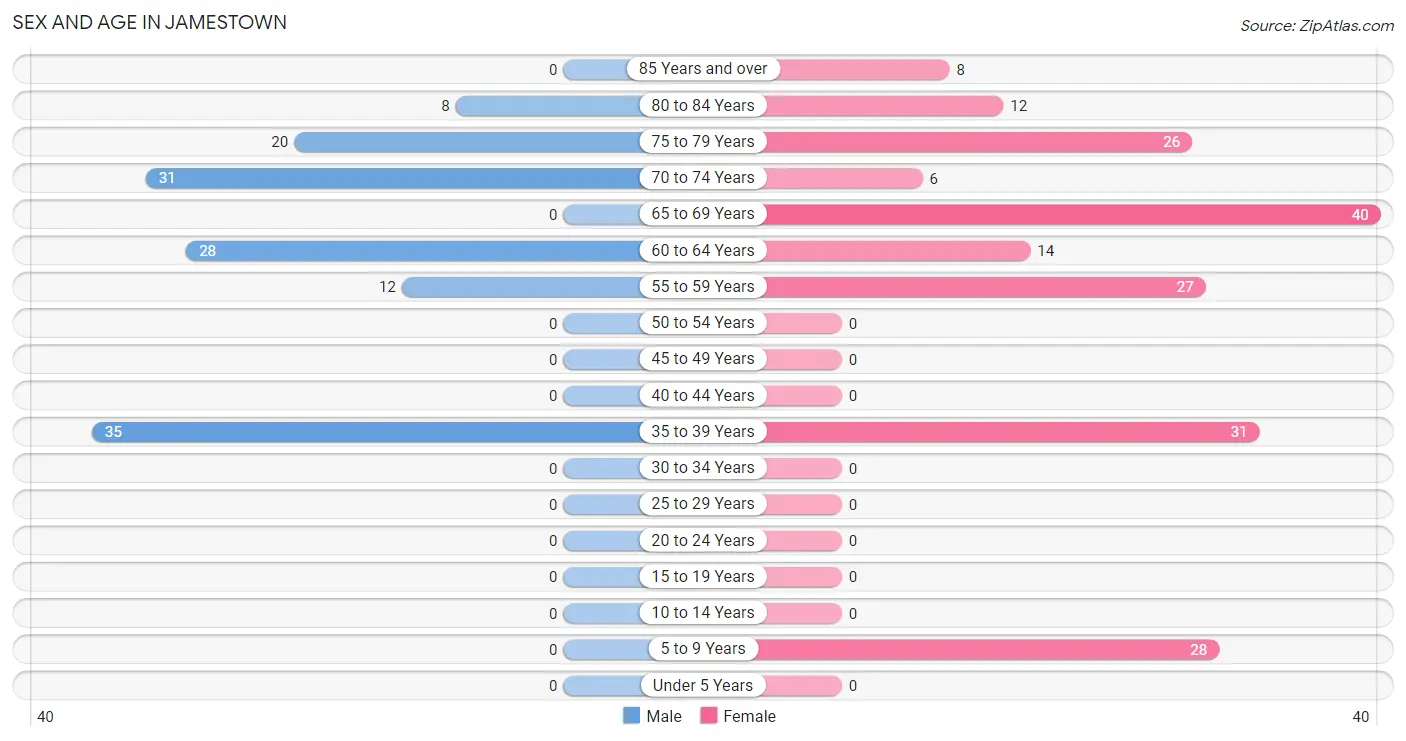
| Age Bracket | Male | Female |
| Under 5 Years | 0 (0.0%) | 0 (0.0%) |
| 5 to 9 Years | 0 (0.0%) | 28 (14.6%) |
| 10 to 14 Years | 0 (0.0%) | 0 (0.0%) |
| 15 to 19 Years | 0 (0.0%) | 0 (0.0%) |
| 20 to 24 Years | 0 (0.0%) | 0 (0.0%) |
| 25 to 29 Years | 0 (0.0%) | 0 (0.0%) |
| 30 to 34 Years | 0 (0.0%) | 0 (0.0%) |
| 35 to 39 Years | 35 (26.1%) | 31 (16.2%) |
| 40 to 44 Years | 0 (0.0%) | 0 (0.0%) |
| 45 to 49 Years | 0 (0.0%) | 0 (0.0%) |
| 50 to 54 Years | 0 (0.0%) | 0 (0.0%) |
| 55 to 59 Years | 12 (9.0%) | 27 (14.1%) |
| 60 to 64 Years | 28 (20.9%) | 14 (7.3%) |
| 65 to 69 Years | 0 (0.0%) | 40 (20.8%) |
| 70 to 74 Years | 31 (23.1%) | 6 (3.1%) |
| 75 to 79 Years | 20 (14.9%) | 26 (13.5%) |
| 80 to 84 Years | 8 (6.0%) | 12 (6.2%) |
| 85 Years and over | 0 (0.0%) | 8 (4.2%) |
| Total | 134 (100.0%) | 192 (100.0%) |
Families and Households in Jamestown
Median Family Size in Jamestown
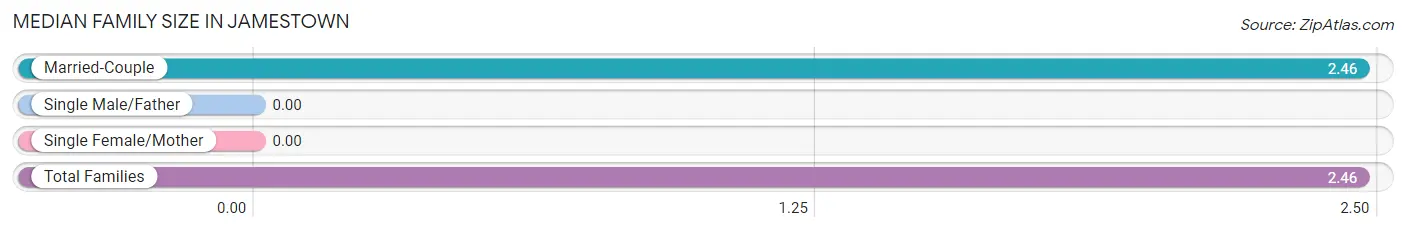
| Family Type | # Families | Family Size |
| Married-Couple | 96 (100.0%) | 2.46 |
| Single Male/Father | 0 (0.0%) | - |
| Single Female/Mother | 0 (0.0%) | - |
| Total Families | 96 (100.0%) | 2.46 |
Median Household Size in Jamestown
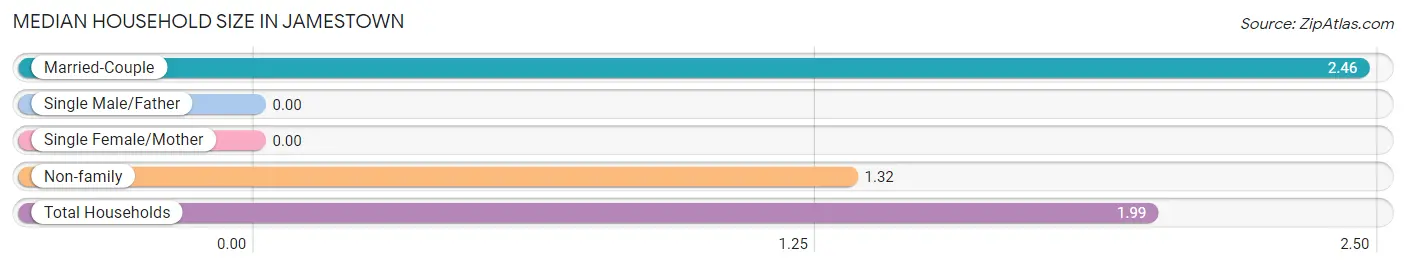
| Household Type | # Households | Household Size |
| Married-Couple | 96 (58.5%) | 2.46 |
| Single Male/Father | 0 (0.0%) | - |
| Single Female/Mother | 0 (0.0%) | - |
| Non-family | 68 (41.5%) | 1.32 |
| Total Households | 164 (100.0%) | 1.99 |
Household Size by Marriage Status in Jamestown
Out of a total of 164 households in Jamestown, 96 (58.5%) are family households, while 68 (41.5%) are nonfamily households. The most numerous type of family households are 2-person households, comprising 53, and the most common type of nonfamily households are 1-person households, comprising 48.
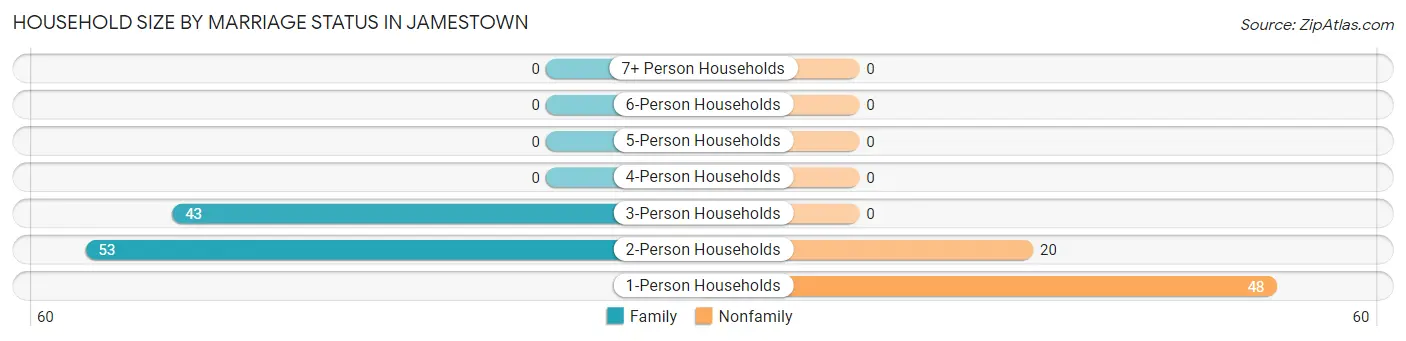
| Household Size | Family Households | Nonfamily Households |
| 1-Person Households | - | 48 (29.3%) |
| 2-Person Households | 53 (32.3%) | 20 (12.2%) |
| 3-Person Households | 43 (26.2%) | 0 (0.0%) |
| 4-Person Households | 0 (0.0%) | 0 (0.0%) |
| 5-Person Households | 0 (0.0%) | 0 (0.0%) |
| 6-Person Households | 0 (0.0%) | 0 (0.0%) |
| 7+ Person Households | 0 (0.0%) | 0 (0.0%) |
| Total | 96 (58.5%) | 68 (41.5%) |
Female Fertility in Jamestown
Fertility by Age in Jamestown
| Age Bracket | Women with Births | Births / 1,000 Women |
| 15 to 19 years | 0 (0.0%) | 0.0 |
| 20 to 34 years | 0 (0.0%) | 0.0 |
| 35 to 50 years | 0 (0.0%) | 0.0 |
| Total | 0 (0.0%) | 0.0 |
Fertility by Age by Marriage Status in Jamestown
| Age Bracket | Married | Unmarried |
| 15 to 19 years | 0 (0.0%) | 0 (0.0%) |
| 20 to 34 years | 0 (0.0%) | 0 (0.0%) |
| 35 to 50 years | 0 (0.0%) | 0 (0.0%) |
| Total | 0 (0.0%) | 0 (0.0%) |
Fertility by Education in Jamestown
| Educational Attainment | Women with Births | Births / 1,000 Women |
| Less than High School | 0 (0.0%) | 0.0 |
| High School Diploma | 0 (0.0%) | 0.0 |
| College or Associate's Degree | 0 (0.0%) | 0.0 |
| Bachelor's Degree | 0 (0.0%) | 0.0 |
| Graduate Degree | 0 (0.0%) | 0.0 |
| Total | 0 (0.0%) | 0.0 |
Fertility by Education by Marriage Status in Jamestown
| Educational Attainment | Married | Unmarried |
| Less than High School | 0 (0.0%) | 0 (0.0%) |
| High School Diploma | 0 (0.0%) | 0 (0.0%) |
| College or Associate's Degree | 0 (0.0%) | 0 (0.0%) |
| Bachelor's Degree | 0 (0.0%) | 0 (0.0%) |
| Graduate Degree | 0 (0.0%) | 0 (0.0%) |
| Total | 0 (0.0%) | 0 (0.0%) |
Employment Characteristics in Jamestown
Employment by Class of Employer in Jamestown
Among the 102 employed individuals in Jamestown, state government employees (66 | 64.7%), private company employees (24 | 23.5%), and self-employed (incorporated) (9 | 8.8%) make up the most common classes of employment.
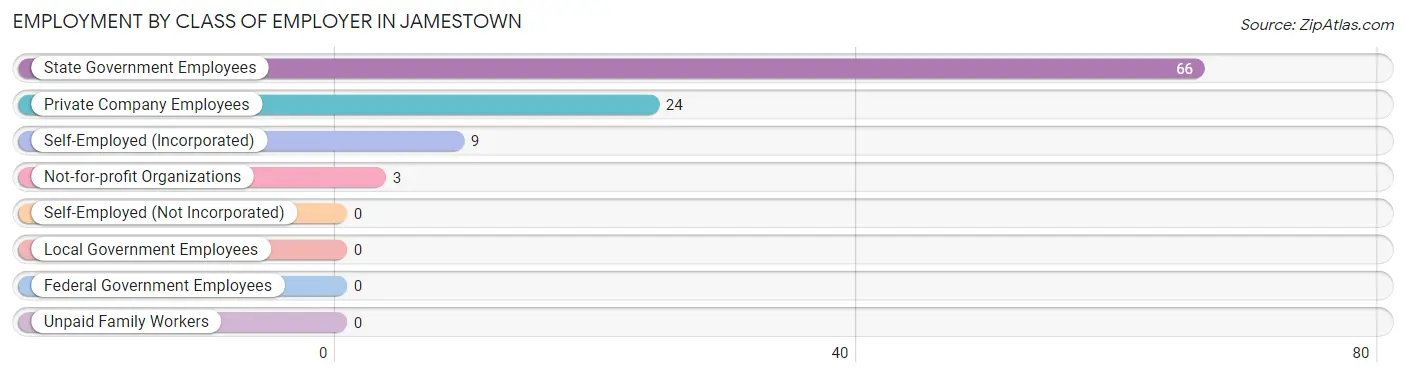
| Employer Class | # Employees | % Employees |
| Private Company Employees | 24 | 23.5% |
| Self-Employed (Incorporated) | 9 | 8.8% |
| Self-Employed (Not Incorporated) | 0 | 0.0% |
| Not-for-profit Organizations | 3 | 2.9% |
| Local Government Employees | 0 | 0.0% |
| State Government Employees | 66 | 64.7% |
| Federal Government Employees | 0 | 0.0% |
| Unpaid Family Workers | 0 | 0.0% |
| Total | 102 | 100.0% |
Employment Status by Age in Jamestown
According to the labor force statistics for Jamestown, out of the total population over 16 years of age (298), 38.6% or 115 individuals are in the labor force, with 11.3% or 13 of them unemployed. The age group with the highest labor force participation rate is 35 to 44 years, with 100.0% or 66 individuals in the labor force. Within the labor force, the 60 to 64 years age range has the highest percentage of unemployed individuals, with 81.3% or 13 of them being unemployed.
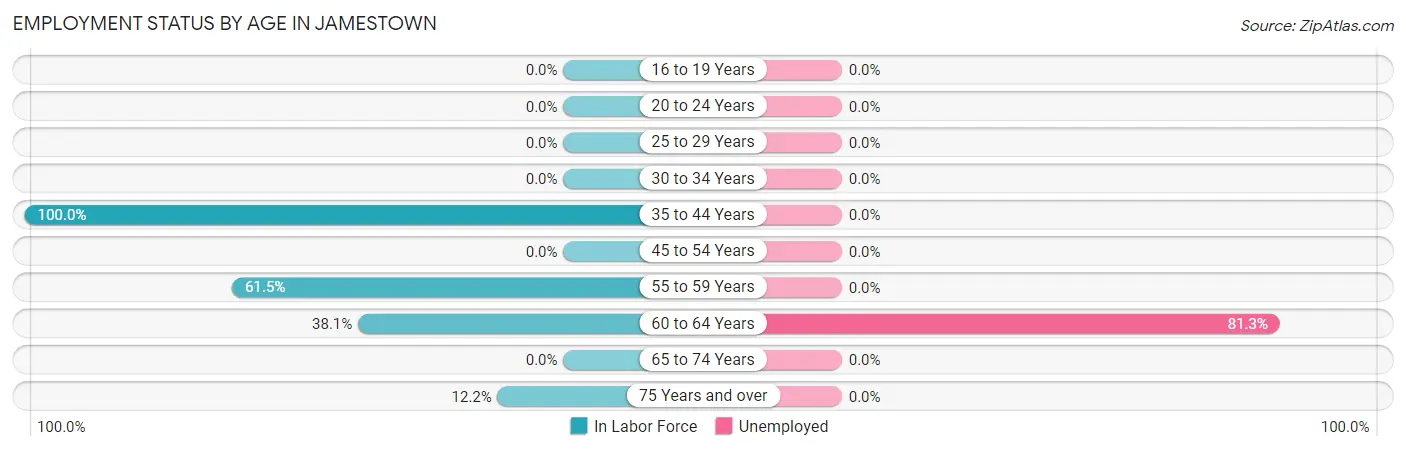
| Age Bracket | In Labor Force | Unemployed |
| 16 to 19 Years | 0 (0.0%) | 0 (0.0%) |
| 20 to 24 Years | 0 (0.0%) | 0 (0.0%) |
| 25 to 29 Years | 0 (0.0%) | 0 (0.0%) |
| 30 to 34 Years | 0 (0.0%) | 0 (0.0%) |
| 35 to 44 Years | 66 (100.0%) | 0 (0.0%) |
| 45 to 54 Years | 0 (0.0%) | 0 (0.0%) |
| 55 to 59 Years | 24 (61.5%) | 0 (0.0%) |
| 60 to 64 Years | 16 (38.1%) | 13 (81.3%) |
| 65 to 74 Years | 0 (0.0%) | 0 (0.0%) |
| 75 Years and over | 9 (12.2%) | 0 (0.0%) |
| Total | 115 (38.6%) | 13 (11.3%) |
Employment Status by Educational Attainment in Jamestown
According to labor force statistics for Jamestown, 72.1% of individuals (106) out of the total population between 25 and 64 years of age (147) are in the labor force, with 12.3% or 13 of them being unemployed. The group with the highest labor force participation rate are those with the educational attainment of high school diploma, with 100.0% or 13 individuals in the labor force. Within the labor force, individuals with high school diploma education have the highest percentage of unemployment, with 100.0% or 13 of them being unemployed.
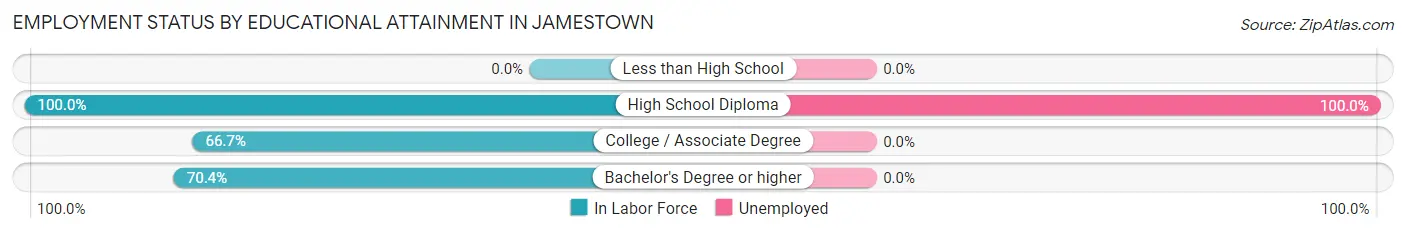
| Educational Attainment | In Labor Force | Unemployed |
| Less than High School | 0 (0.0%) | 0 (0.0%) |
| High School Diploma | 13 (100.0%) | 13 (100.0%) |
| College / Associate Degree | 24 (66.7%) | 0 (0.0%) |
| Bachelor's Degree or higher | 69 (70.4%) | 0 (0.0%) |
| Total | 106 (72.1%) | 18 (12.3%) |
Employment Occupations by Sex in Jamestown
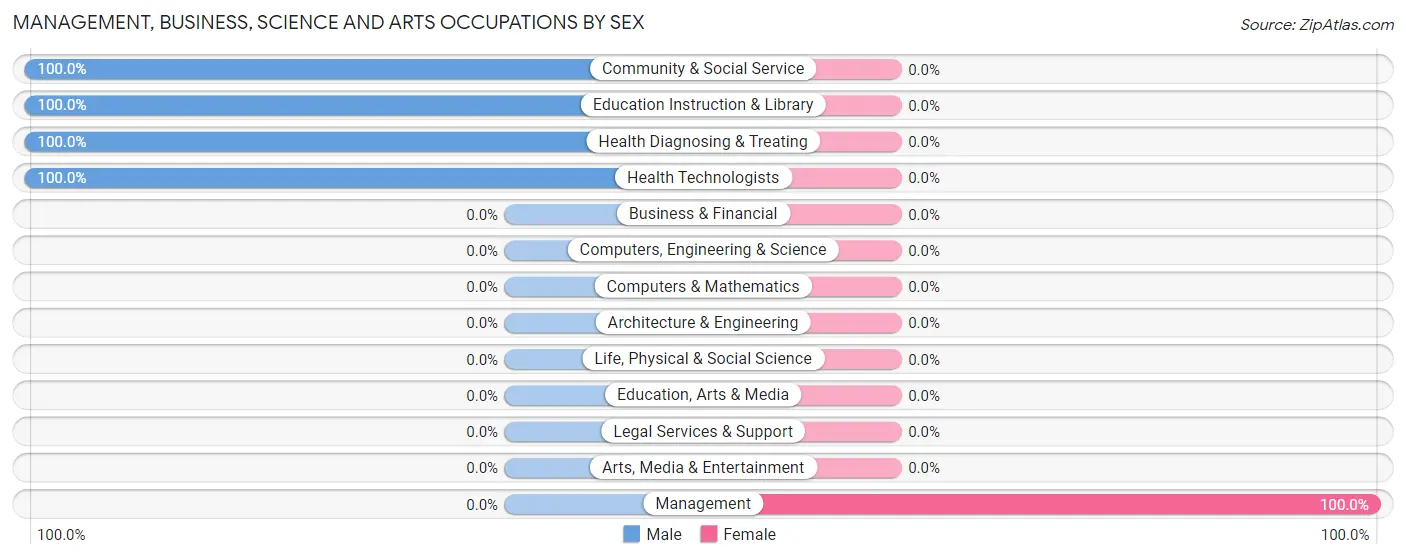
Management, Business, Science and Arts Occupations
The most common Management, Business, Science and Arts occupations in Jamestown are Management (40 | 39.2%), Community & Social Service (35 | 34.3%), Education Instruction & Library (35 | 34.3%), Health Diagnosing & Treating (3 | 2.9%), and Health Technologists (3 | 2.9%).
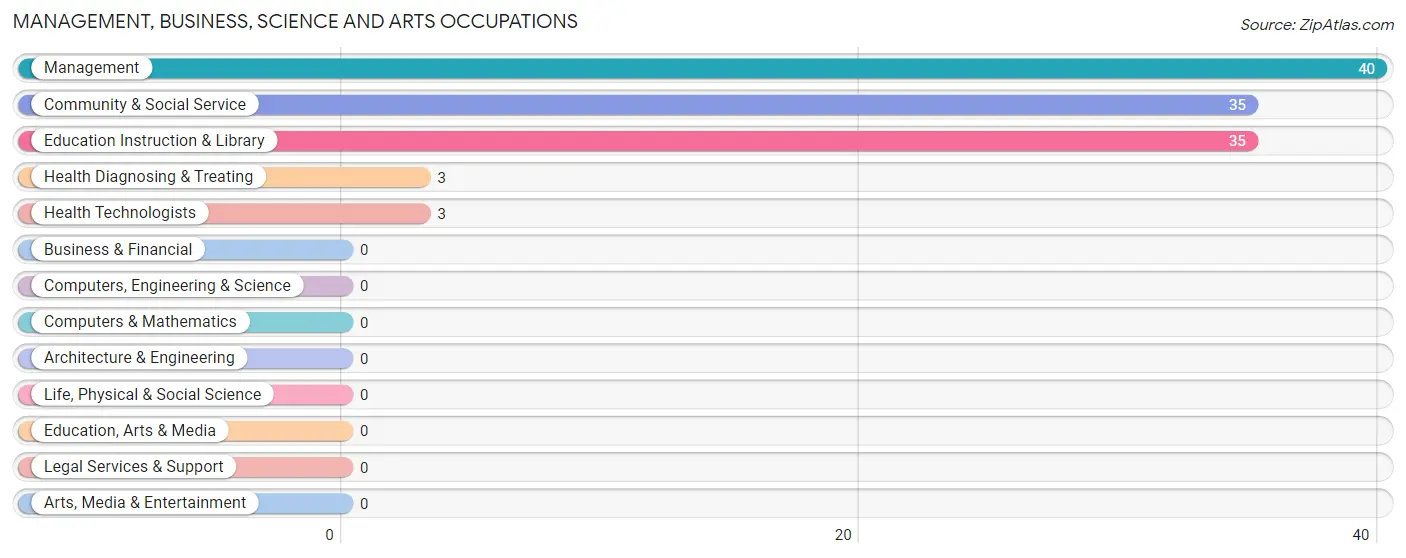
Management, Business, Science and Arts Occupations by Sex
| Occupation | Male | Female |
| Management | 0 (0.0%) | 40 (100.0%) |
| Business & Financial | 0 (0.0%) | 0 (0.0%) |
| Computers, Engineering & Science | 0 (0.0%) | 0 (0.0%) |
| Computers & Mathematics | 0 (0.0%) | 0 (0.0%) |
| Architecture & Engineering | 0 (0.0%) | 0 (0.0%) |
| Life, Physical & Social Science | 0 (0.0%) | 0 (0.0%) |
| Community & Social Service | 35 (100.0%) | 0 (0.0%) |
| Education, Arts & Media | 0 (0.0%) | 0 (0.0%) |
| Legal Services & Support | 0 (0.0%) | 0 (0.0%) |
| Education Instruction & Library | 35 (100.0%) | 0 (0.0%) |
| Arts, Media & Entertainment | 0 (0.0%) | 0 (0.0%) |
| Health Diagnosing & Treating | 3 (100.0%) | 0 (0.0%) |
| Health Technologists | 3 (100.0%) | 0 (0.0%) |
| Total (Category) | 38 (48.7%) | 40 (51.3%) |
| Total (Overall) | 50 (49.0%) | 52 (51.0%) |
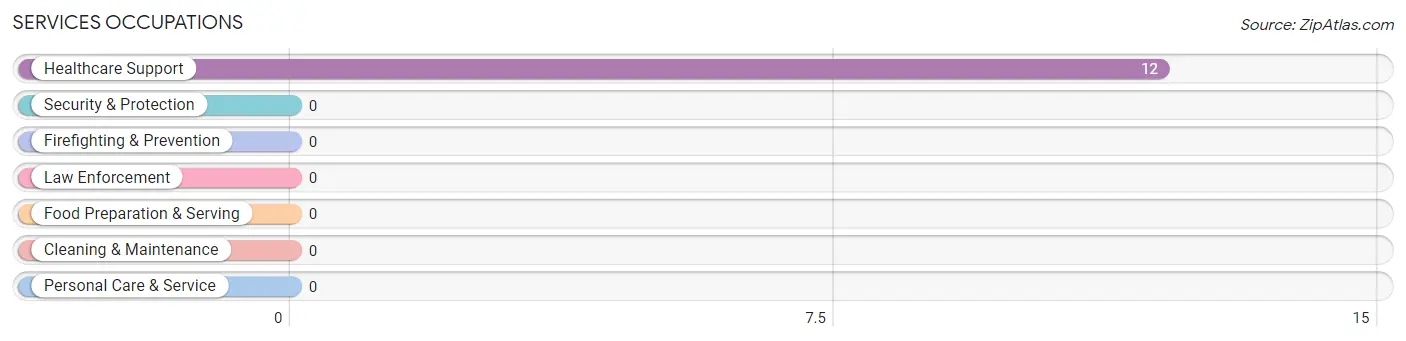
Services Occupations
The most common Services occupations in Jamestown are , and Healthcare Support (12 | 11.8%).
Services Occupations by Sex
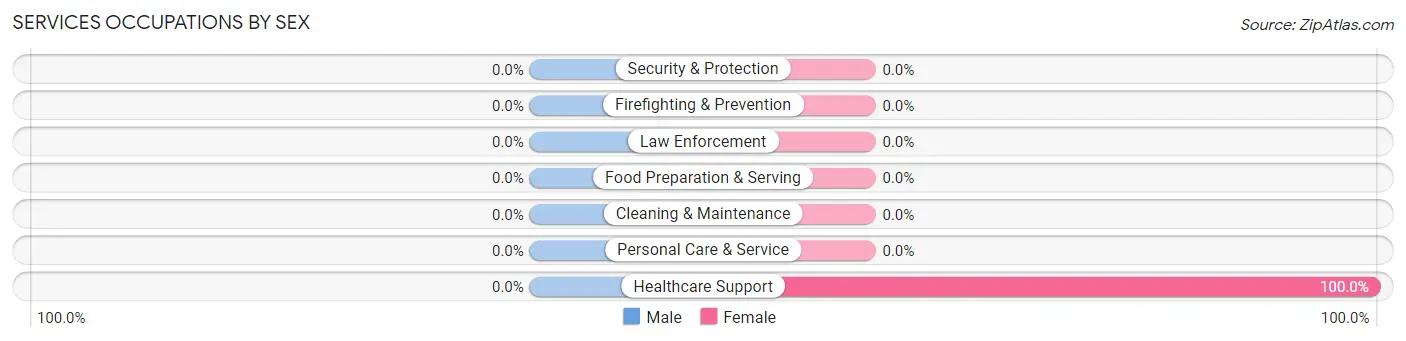
| Occupation | Male | Female |
| Healthcare Support | 0 (0.0%) | 12 (100.0%) |
| Security & Protection | 0 (0.0%) | 0 (0.0%) |
| Firefighting & Prevention | 0 (0.0%) | 0 (0.0%) |
| Law Enforcement | 0 (0.0%) | 0 (0.0%) |
| Food Preparation & Serving | 0 (0.0%) | 0 (0.0%) |
| Cleaning & Maintenance | 0 (0.0%) | 0 (0.0%) |
| Personal Care & Service | 0 (0.0%) | 0 (0.0%) |
| Total (Category) | 0 (0.0%) | 12 (100.0%) |
| Total (Overall) | 50 (49.0%) | 52 (51.0%) |
Sales and Office Occupations
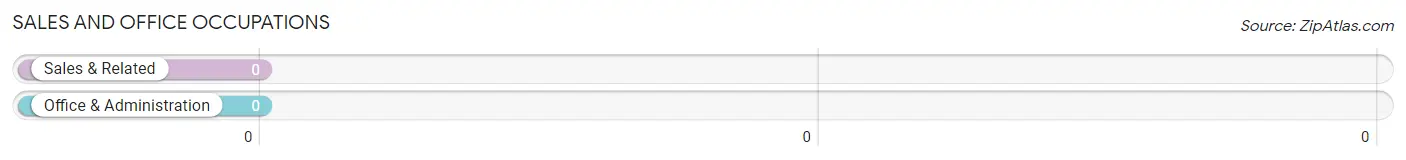
Sales and Office Occupations by Sex
| Occupation | Male | Female |
| Sales & Related | 0 (0.0%) | 0 (0.0%) |
| Office & Administration | 0 (0.0%) | 0 (0.0%) |
| Total (Category) | 0 (0.0%) | 0 (0.0%) |
| Total (Overall) | 50 (49.0%) | 52 (51.0%) |
Natural Resources, Construction and Maintenance Occupations
The most common Natural Resources, Construction and Maintenance occupations in Jamestown are , and Construction & Extraction (12 | 11.8%).
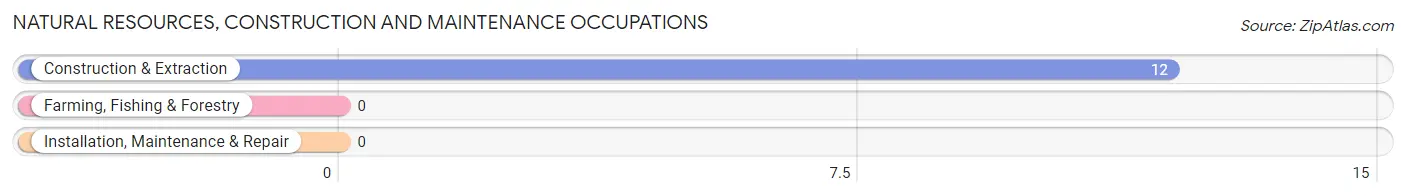
Natural Resources, Construction and Maintenance Occupations by Sex
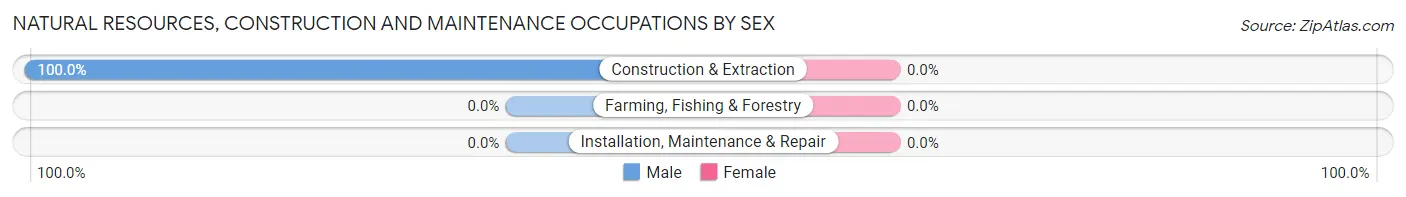
| Occupation | Male | Female |
| Farming, Fishing & Forestry | 0 (0.0%) | 0 (0.0%) |
| Construction & Extraction | 12 (100.0%) | 0 (0.0%) |
| Installation, Maintenance & Repair | 0 (0.0%) | 0 (0.0%) |
| Total (Category) | 12 (100.0%) | 0 (0.0%) |
| Total (Overall) | 50 (49.0%) | 52 (51.0%) |
Production, Transportation and Moving Occupations
Production, Transportation and Moving Occupations by Sex
| Occupation | Male | Female |
| Production | 0 (0.0%) | 0 (0.0%) |
| Transportation | 0 (0.0%) | 0 (0.0%) |
| Material Moving | 0 (0.0%) | 0 (0.0%) |
| Total (Category) | 0 (0.0%) | 0 (0.0%) |
| Total (Overall) | 50 (49.0%) | 52 (51.0%) |
Employment Industries by Sex in Jamestown
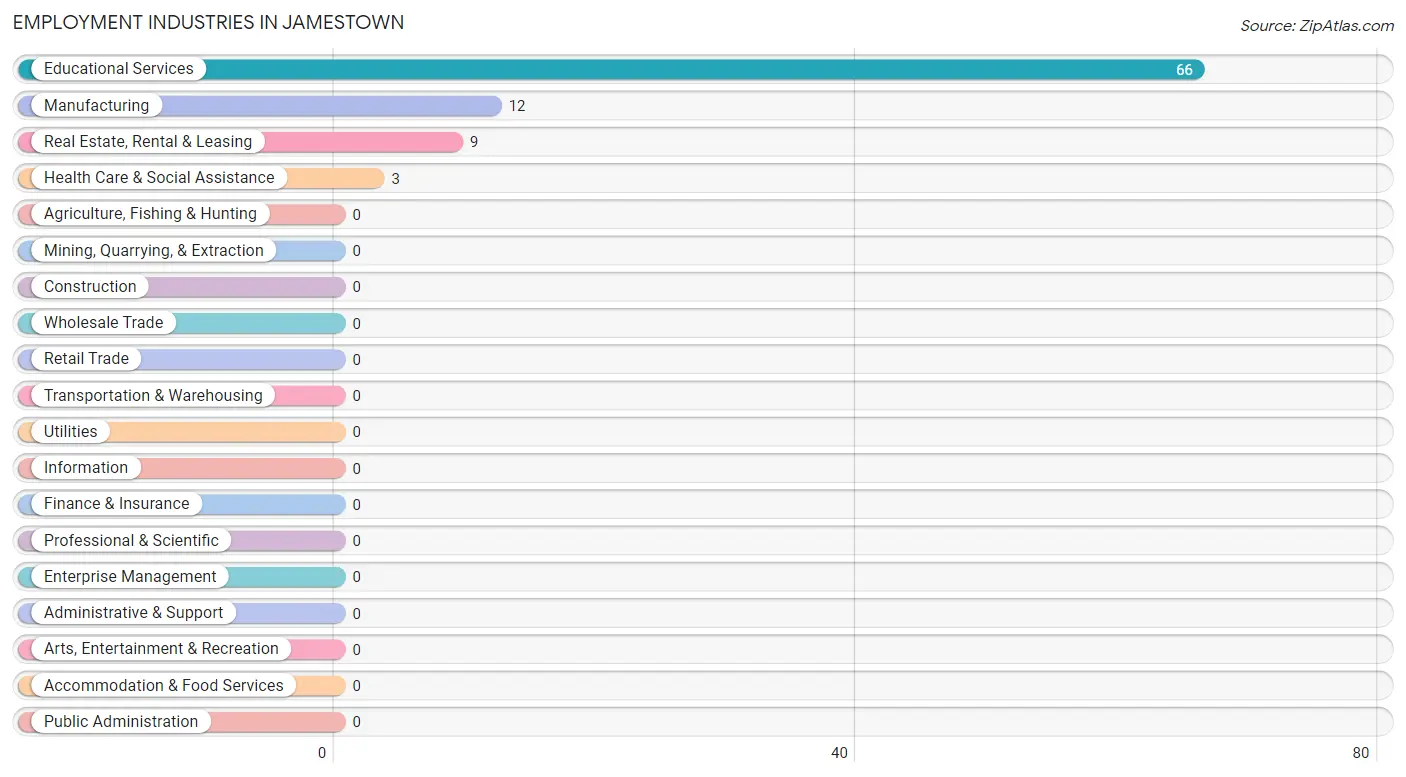
Employment Industries in Jamestown
The major employment industries in Jamestown include Educational Services (66 | 64.7%), Manufacturing (12 | 11.8%), Real Estate, Rental & Leasing (9 | 8.8%), and Health Care & Social Assistance (3 | 2.9%).
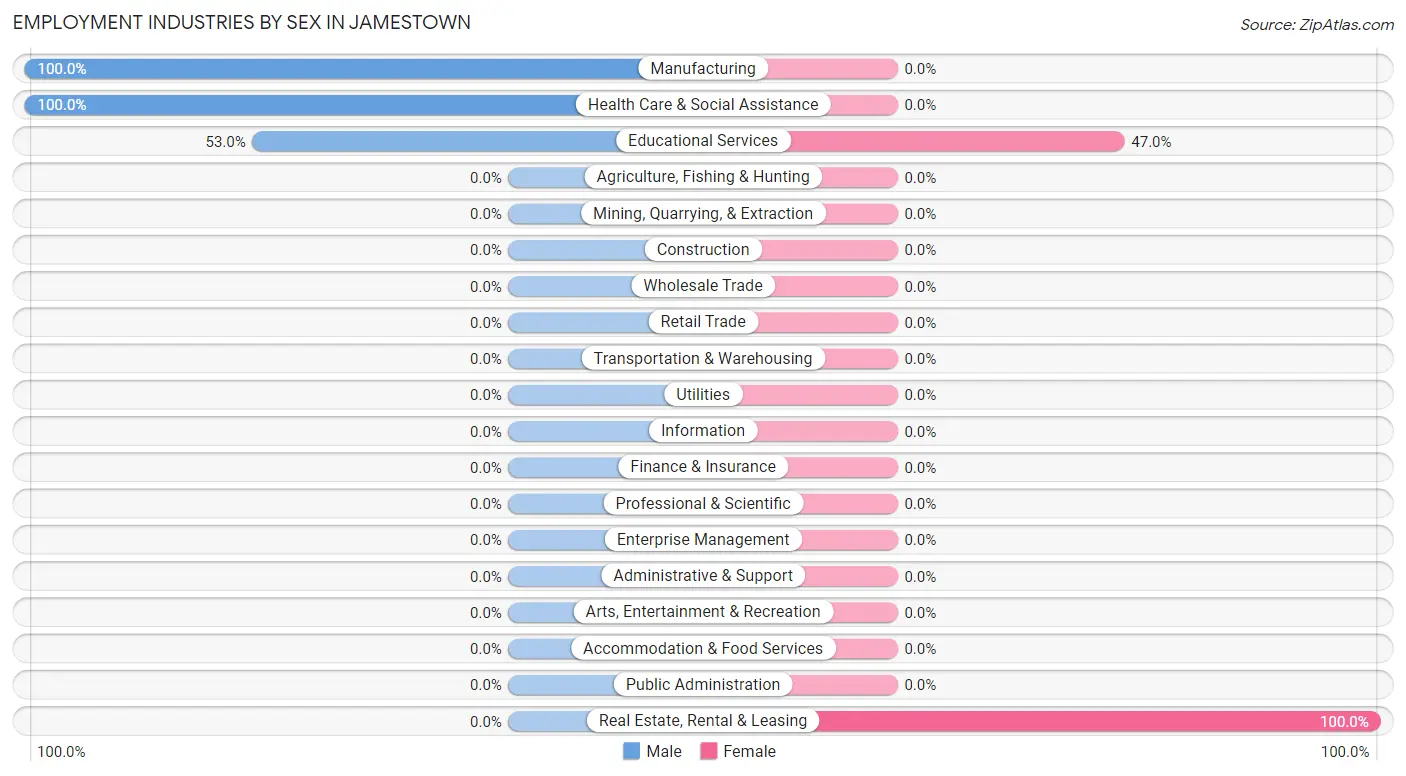
Employment Industries by Sex in Jamestown
The Jamestown industries that see more men than women are Manufacturing (100.0%), Health Care & Social Assistance (100.0%), and Educational Services (53.0%), whereas the industries that tend to have a higher number of women are Real Estate, Rental & Leasing (100.0%), and Educational Services (47.0%).
| Industry | Male | Female |
| Agriculture, Fishing & Hunting | 0 (0.0%) | 0 (0.0%) |
| Mining, Quarrying, & Extraction | 0 (0.0%) | 0 (0.0%) |
| Construction | 0 (0.0%) | 0 (0.0%) |
| Manufacturing | 12 (100.0%) | 0 (0.0%) |
| Wholesale Trade | 0 (0.0%) | 0 (0.0%) |
| Retail Trade | 0 (0.0%) | 0 (0.0%) |
| Transportation & Warehousing | 0 (0.0%) | 0 (0.0%) |
| Utilities | 0 (0.0%) | 0 (0.0%) |
| Information | 0 (0.0%) | 0 (0.0%) |
| Finance & Insurance | 0 (0.0%) | 0 (0.0%) |
| Real Estate, Rental & Leasing | 0 (0.0%) | 9 (100.0%) |
| Professional & Scientific | 0 (0.0%) | 0 (0.0%) |
| Enterprise Management | 0 (0.0%) | 0 (0.0%) |
| Administrative & Support | 0 (0.0%) | 0 (0.0%) |
| Educational Services | 35 (53.0%) | 31 (47.0%) |
| Health Care & Social Assistance | 3 (100.0%) | 0 (0.0%) |
| Arts, Entertainment & Recreation | 0 (0.0%) | 0 (0.0%) |
| Accommodation & Food Services | 0 (0.0%) | 0 (0.0%) |
| Public Administration | 0 (0.0%) | 0 (0.0%) |
| Total | 50 (49.0%) | 52 (51.0%) |
Education in Jamestown
School Enrollment in Jamestown
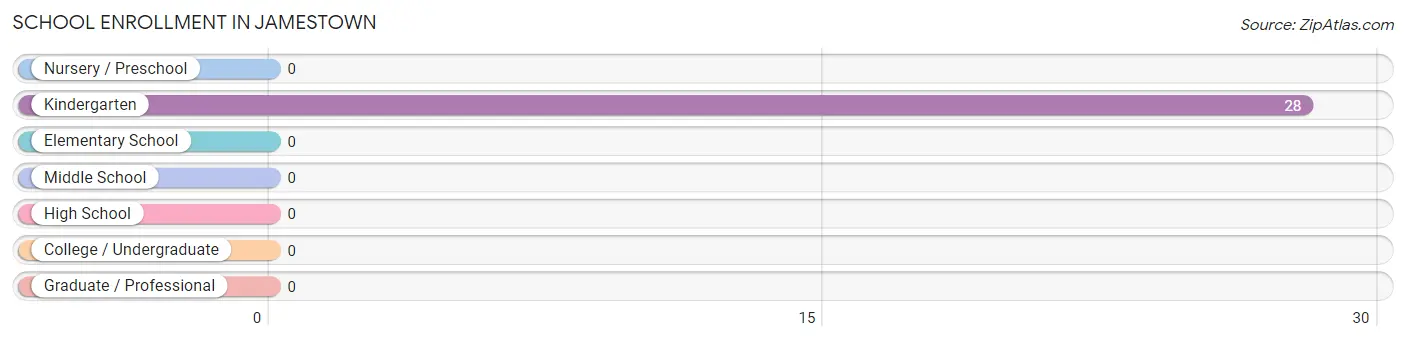
| School Level | # Students | % Students |
| Nursery / Preschool | 0 | 0.0% |
| Kindergarten | 28 | 100.0% |
| Elementary School | 0 | 0.0% |
| Middle School | 0 | 0.0% |
| High School | 0 | 0.0% |
| College / Undergraduate | 0 | 0.0% |
| Graduate / Professional | 0 | 0.0% |
| Total | 28 | 100.0% |
School Enrollment by Age by Funding Source in Jamestown

| Age Bracket | Public School | Private School |
| 3 to 4 Year Olds | 0 (0.0%) | 0 (0.0%) |
| 5 to 9 Year Old | 0 (0.0%) | 28 (100.0%) |
| 10 to 14 Year Olds | 0 (0.0%) | 0 (0.0%) |
| 15 to 17 Year Olds | 0 (0.0%) | 0 (0.0%) |
| 18 to 19 Year Olds | 0 (0.0%) | 0 (0.0%) |
| 20 to 24 Year Olds | 0 (0.0%) | 0 (0.0%) |
| 25 to 34 Year Olds | 0 (0.0%) | 0 (0.0%) |
| 35 Years and over | 0 (0.0%) | 0 (0.0%) |
| Total | 0 (0.0%) | 28 (100.0%) |
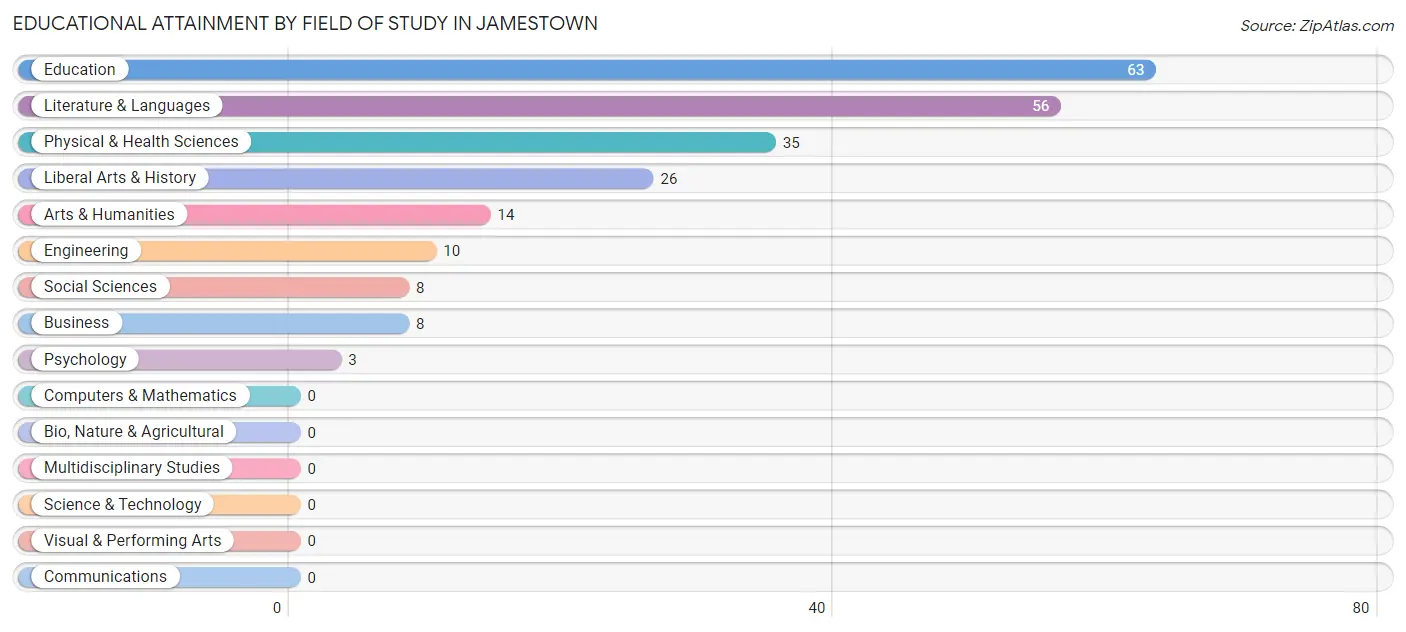
Educational Attainment by Field of Study in Jamestown
Education (63 | 28.2%), literature & languages (56 | 25.1%), physical & health sciences (35 | 15.7%), liberal arts & history (26 | 11.7%), and arts & humanities (14 | 6.3%) are the most common fields of study among 223 individuals in Jamestown who have obtained a bachelor's degree or higher.
| Field of Study | # Graduates | % Graduates |
| Computers & Mathematics | 0 | 0.0% |
| Bio, Nature & Agricultural | 0 | 0.0% |
| Physical & Health Sciences | 35 | 15.7% |
| Psychology | 3 | 1.3% |
| Social Sciences | 8 | 3.6% |
| Engineering | 10 | 4.5% |
| Multidisciplinary Studies | 0 | 0.0% |
| Science & Technology | 0 | 0.0% |
| Business | 8 | 3.6% |
| Education | 63 | 28.2% |
| Literature & Languages | 56 | 25.1% |
| Liberal Arts & History | 26 | 11.7% |
| Visual & Performing Arts | 0 | 0.0% |
| Communications | 0 | 0.0% |
| Arts & Humanities | 14 | 6.3% |
| Total | 223 | 100.0% |
Transportation & Commute in Jamestown
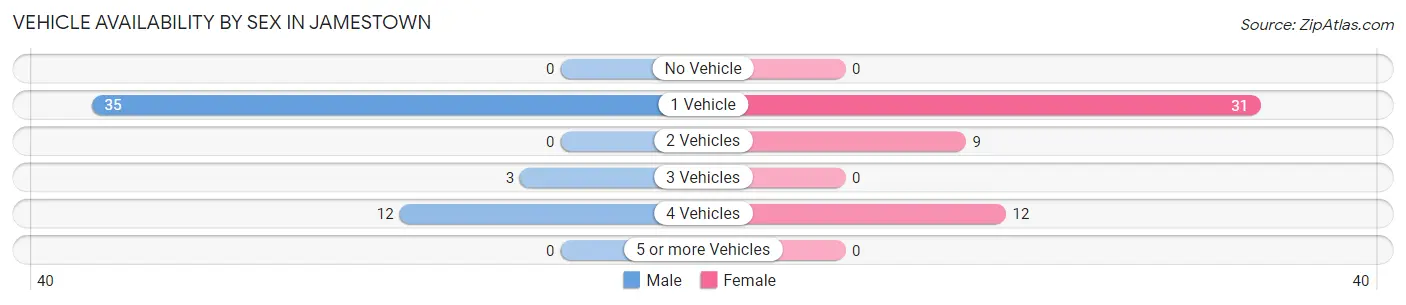
Vehicle Availability by Sex in Jamestown
The most prevalent vehicle ownership categories in Jamestown are males with 1 vehicle (35, accounting for 70.0%) and females with 1 vehicle (31, making up 67.3%).
| Vehicles Available | Male | Female |
| No Vehicle | 0 (0.0%) | 0 (0.0%) |
| 1 Vehicle | 35 (70.0%) | 31 (59.6%) |
| 2 Vehicles | 0 (0.0%) | 9 (17.3%) |
| 3 Vehicles | 3 (6.0%) | 0 (0.0%) |
| 4 Vehicles | 12 (24.0%) | 12 (23.1%) |
| 5 or more Vehicles | 0 (0.0%) | 0 (0.0%) |
| Total | 50 (100.0%) | 52 (100.0%) |
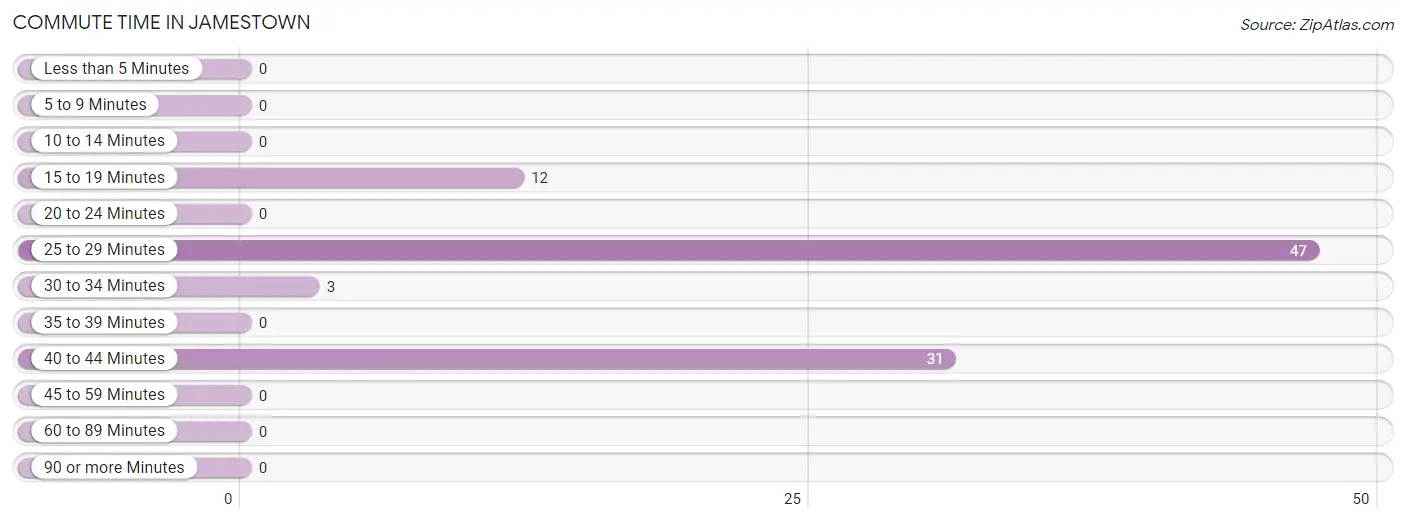
Commute Time in Jamestown
The most frequently occuring commute durations in Jamestown are 25 to 29 minutes (47 commuters, 50.5%), 40 to 44 minutes (31 commuters, 33.3%), and 15 to 19 minutes (12 commuters, 12.9%).
| Commute Time | # Commuters | % Commuters |
| Less than 5 Minutes | 0 | 0.0% |
| 5 to 9 Minutes | 0 | 0.0% |
| 10 to 14 Minutes | 0 | 0.0% |
| 15 to 19 Minutes | 12 | 12.9% |
| 20 to 24 Minutes | 0 | 0.0% |
| 25 to 29 Minutes | 47 | 50.5% |
| 30 to 34 Minutes | 3 | 3.2% |
| 35 to 39 Minutes | 0 | 0.0% |
| 40 to 44 Minutes | 31 | 33.3% |
| 45 to 59 Minutes | 0 | 0.0% |
| 60 to 89 Minutes | 0 | 0.0% |
| 90 or more Minutes | 0 | 0.0% |
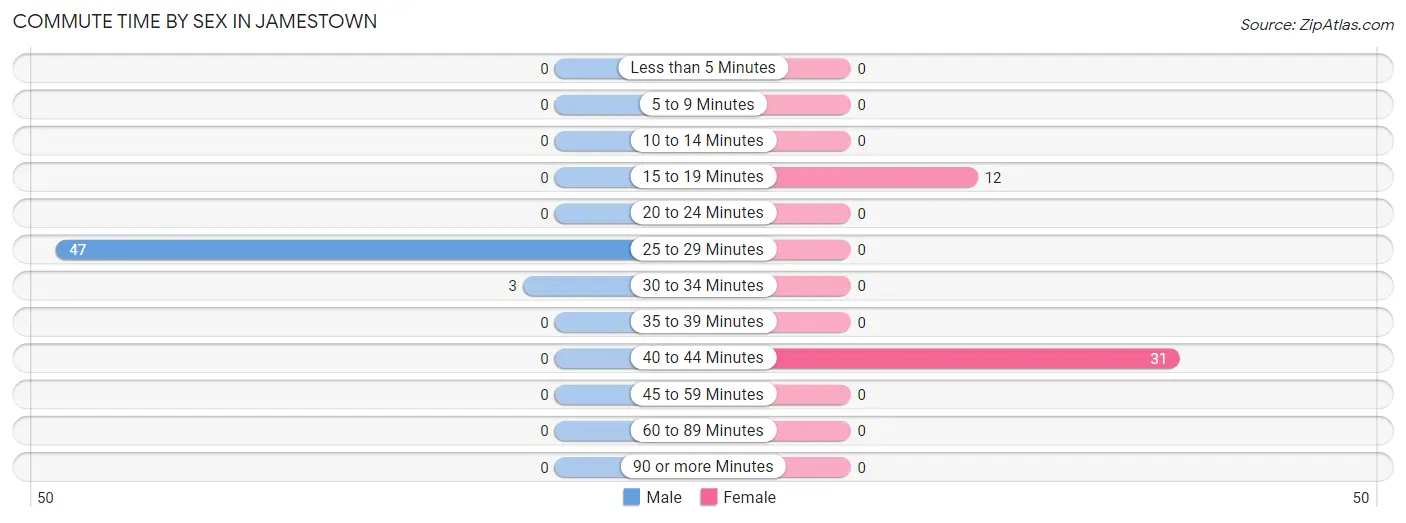
Commute Time by Sex in Jamestown
The most common commute times in Jamestown are 25 to 29 minutes (47 commuters, 94.0%) for males and 40 to 44 minutes (31 commuters, 72.1%) for females.
| Commute Time | Male | Female |
| Less than 5 Minutes | 0 (0.0%) | 0 (0.0%) |
| 5 to 9 Minutes | 0 (0.0%) | 0 (0.0%) |
| 10 to 14 Minutes | 0 (0.0%) | 0 (0.0%) |
| 15 to 19 Minutes | 0 (0.0%) | 12 (27.9%) |
| 20 to 24 Minutes | 0 (0.0%) | 0 (0.0%) |
| 25 to 29 Minutes | 47 (94.0%) | 0 (0.0%) |
| 30 to 34 Minutes | 3 (6.0%) | 0 (0.0%) |
| 35 to 39 Minutes | 0 (0.0%) | 0 (0.0%) |
| 40 to 44 Minutes | 0 (0.0%) | 31 (72.1%) |
| 45 to 59 Minutes | 0 (0.0%) | 0 (0.0%) |
| 60 to 89 Minutes | 0 (0.0%) | 0 (0.0%) |
| 90 or more Minutes | 0 (0.0%) | 0 (0.0%) |
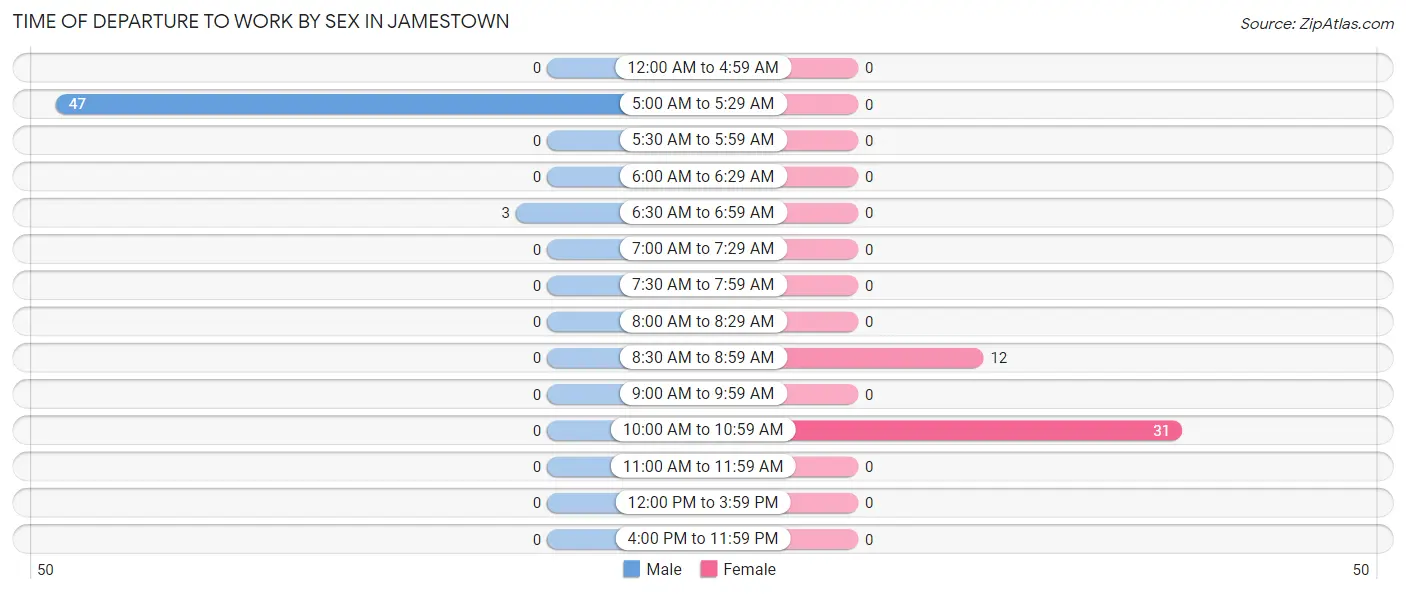
Time of Departure to Work by Sex in Jamestown
The most frequent times of departure to work in Jamestown are 5:00 AM to 5:29 AM (47, 94.0%) for males and 10:00 AM to 10:59 AM (31, 72.1%) for females.
| Time of Departure | Male | Female |
| 12:00 AM to 4:59 AM | 0 (0.0%) | 0 (0.0%) |
| 5:00 AM to 5:29 AM | 47 (94.0%) | 0 (0.0%) |
| 5:30 AM to 5:59 AM | 0 (0.0%) | 0 (0.0%) |
| 6:00 AM to 6:29 AM | 0 (0.0%) | 0 (0.0%) |
| 6:30 AM to 6:59 AM | 3 (6.0%) | 0 (0.0%) |
| 7:00 AM to 7:29 AM | 0 (0.0%) | 0 (0.0%) |
| 7:30 AM to 7:59 AM | 0 (0.0%) | 0 (0.0%) |
| 8:00 AM to 8:29 AM | 0 (0.0%) | 0 (0.0%) |
| 8:30 AM to 8:59 AM | 0 (0.0%) | 12 (27.9%) |
| 9:00 AM to 9:59 AM | 0 (0.0%) | 0 (0.0%) |
| 10:00 AM to 10:59 AM | 0 (0.0%) | 31 (72.1%) |
| 11:00 AM to 11:59 AM | 0 (0.0%) | 0 (0.0%) |
| 12:00 PM to 3:59 PM | 0 (0.0%) | 0 (0.0%) |
| 4:00 PM to 11:59 PM | 0 (0.0%) | 0 (0.0%) |
| Total | 50 (100.0%) | 43 (100.0%) |
Housing Occupancy in Jamestown
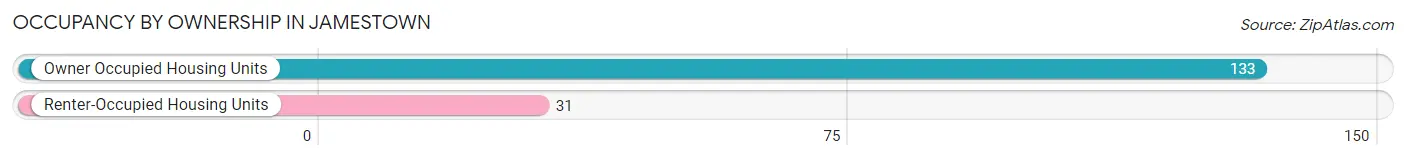
Occupancy by Ownership in Jamestown
Of the total 164 dwellings in Jamestown, owner-occupied units account for 133 (81.1%), while renter-occupied units make up 31 (18.9%).
| Occupancy | # Housing Units | % Housing Units |
| Owner Occupied Housing Units | 133 | 81.1% |
| Renter-Occupied Housing Units | 31 | 18.9% |
| Total Occupied Housing Units | 164 | 100.0% |
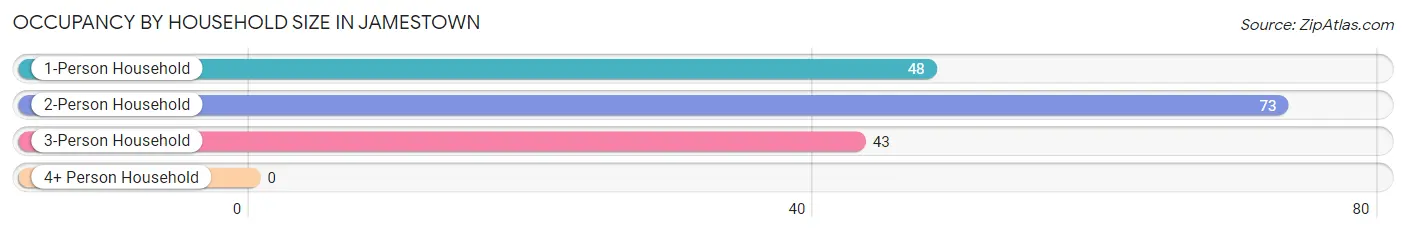
Occupancy by Household Size in Jamestown
| Household Size | # Housing Units | % Housing Units |
| 1-Person Household | 48 | 29.3% |
| 2-Person Household | 73 | 44.5% |
| 3-Person Household | 43 | 26.2% |
| 4+ Person Household | 0 | 0.0% |
| Total Housing Units | 164 | 100.0% |
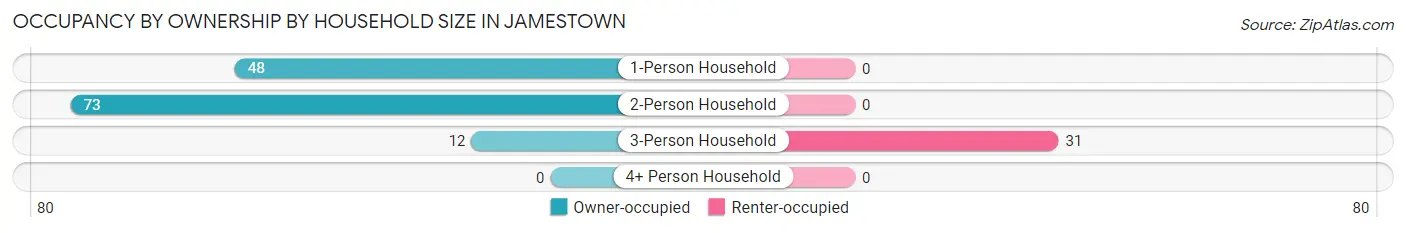
Occupancy by Ownership by Household Size in Jamestown
| Household Size | Owner-occupied | Renter-occupied |
| 1-Person Household | 48 (100.0%) | 0 (0.0%) |
| 2-Person Household | 73 (100.0%) | 0 (0.0%) |
| 3-Person Household | 12 (27.9%) | 31 (72.1%) |
| 4+ Person Household | 0 (0.0%) | 0 (0.0%) |
| Total Housing Units | 133 (81.1%) | 31 (18.9%) |
Occupancy by Educational Attainment in Jamestown
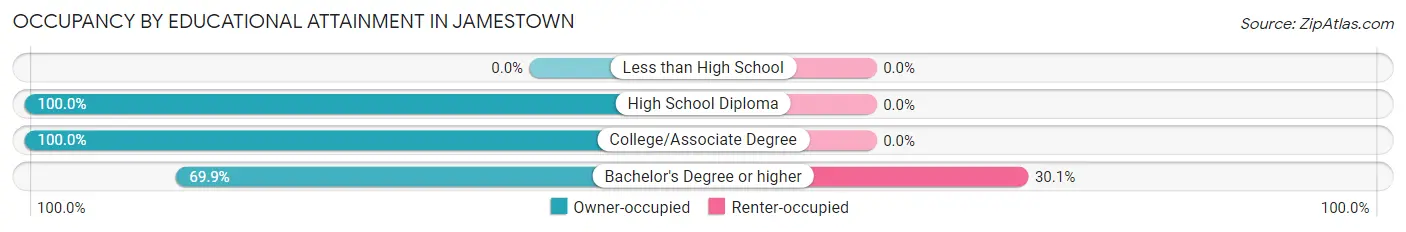
| Household Size | Owner-occupied | Renter-occupied |
| Less than High School | 0 (0.0%) | 0 (0.0%) |
| High School Diploma | 12 (100.0%) | 0 (0.0%) |
| College/Associate Degree | 49 (100.0%) | 0 (0.0%) |
| Bachelor's Degree or higher | 72 (69.9%) | 31 (30.1%) |
Occupancy by Age of Householder in Jamestown
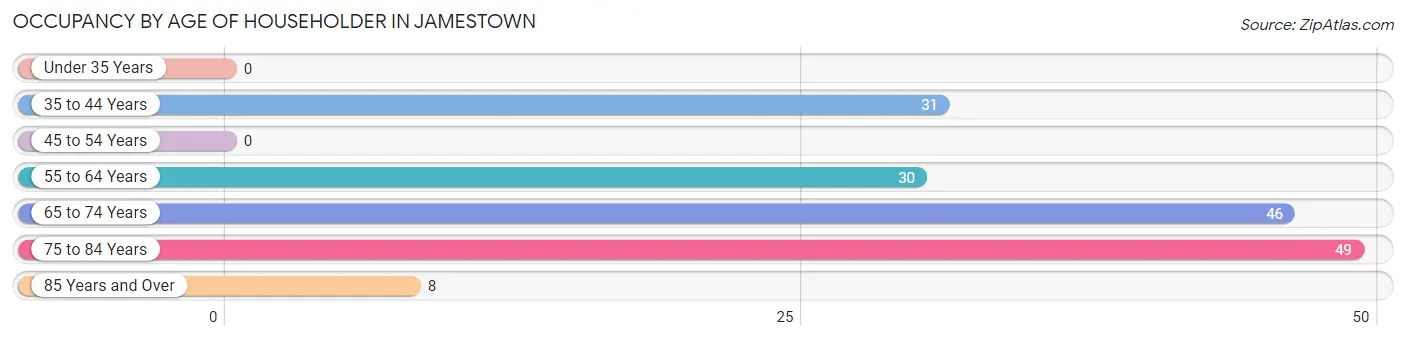
| Age Bracket | # Households | % Households |
| Under 35 Years | 0 | 0.0% |
| 35 to 44 Years | 31 | 18.9% |
| 45 to 54 Years | 0 | 0.0% |
| 55 to 64 Years | 30 | 18.3% |
| 65 to 74 Years | 46 | 28.1% |
| 75 to 84 Years | 49 | 29.9% |
| 85 Years and Over | 8 | 4.9% |
| Total | 164 | 100.0% |
Housing Finances in Jamestown
Median Income by Occupancy in Jamestown
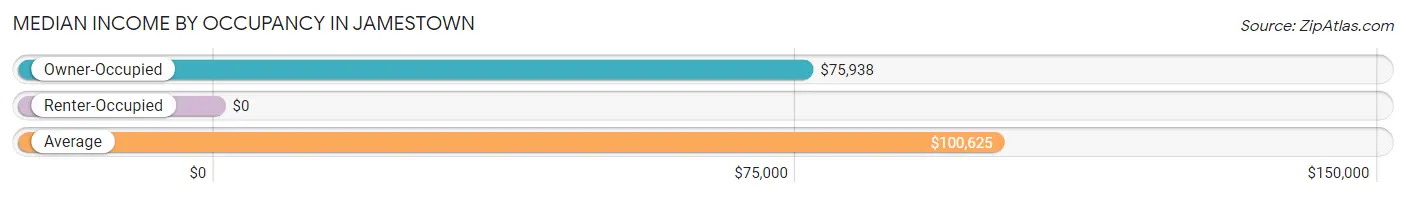
| Occupancy Type | # Households | Median Income |
| Owner-Occupied | 133 (81.1%) | $75,938 |
| Renter-Occupied | 31 (18.9%) | $0 |
| Average | 164 (100.0%) | $100,625 |
Occupancy by Householder Income Bracket in Jamestown
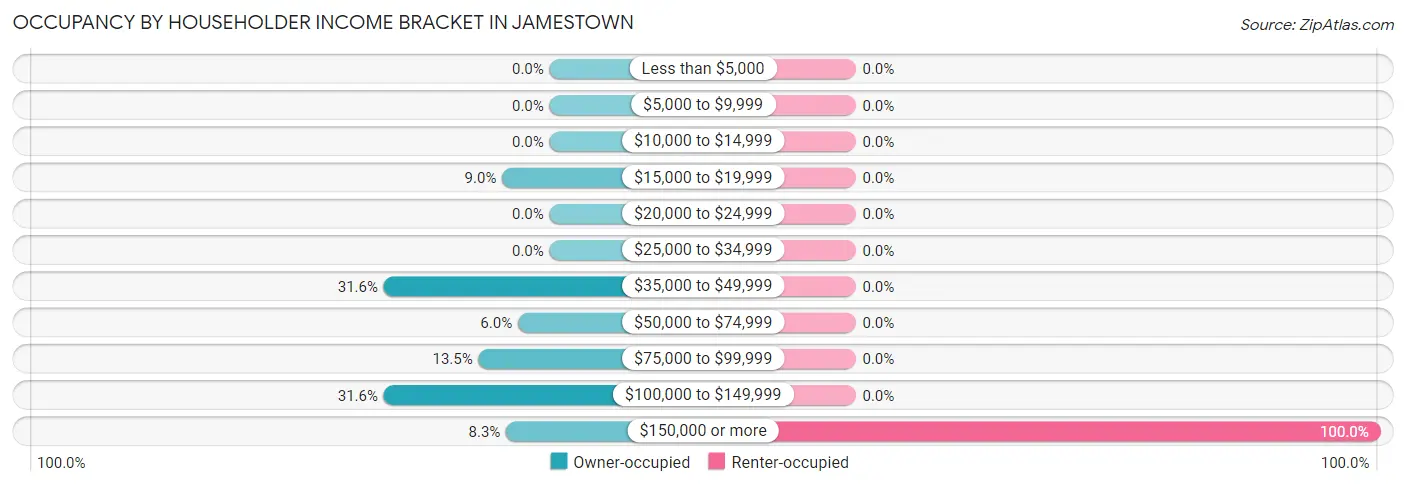
| Income Bracket | Owner-occupied | Renter-occupied |
| Less than $5,000 | 0 (0.0%) | 0 (0.0%) |
| $5,000 to $9,999 | 0 (0.0%) | 0 (0.0%) |
| $10,000 to $14,999 | 0 (0.0%) | 0 (0.0%) |
| $15,000 to $19,999 | 12 (9.0%) | 0 (0.0%) |
| $20,000 to $24,999 | 0 (0.0%) | 0 (0.0%) |
| $25,000 to $34,999 | 0 (0.0%) | 0 (0.0%) |
| $35,000 to $49,999 | 42 (31.6%) | 0 (0.0%) |
| $50,000 to $74,999 | 8 (6.0%) | 0 (0.0%) |
| $75,000 to $99,999 | 18 (13.5%) | 0 (0.0%) |
| $100,000 to $149,999 | 42 (31.6%) | 0 (0.0%) |
| $150,000 or more | 11 (8.3%) | 31 (100.0%) |
| Total | 133 (100.0%) | 31 (100.0%) |
Monthly Housing Cost Tiers in Jamestown
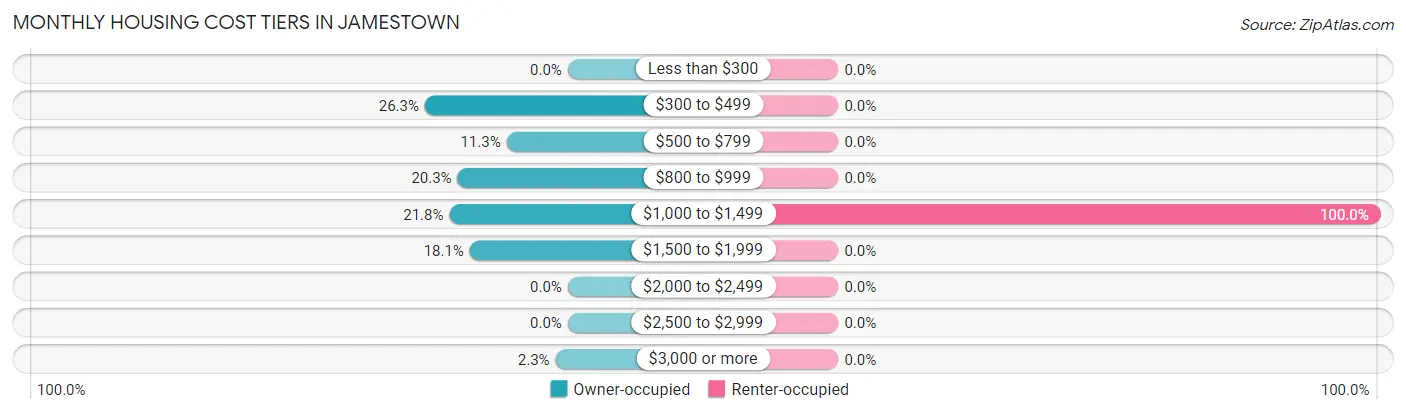
| Monthly Cost | Owner-occupied | Renter-occupied |
| Less than $300 | 0 (0.0%) | 0 (0.0%) |
| $300 to $499 | 35 (26.3%) | 0 (0.0%) |
| $500 to $799 | 15 (11.3%) | 0 (0.0%) |
| $800 to $999 | 27 (20.3%) | 0 (0.0%) |
| $1,000 to $1,499 | 29 (21.8%) | 31 (100.0%) |
| $1,500 to $1,999 | 24 (18.0%) | 0 (0.0%) |
| $2,000 to $2,499 | 0 (0.0%) | 0 (0.0%) |
| $2,500 to $2,999 | 0 (0.0%) | 0 (0.0%) |
| $3,000 or more | 3 (2.3%) | 0 (0.0%) |
| Total | 133 (100.0%) | 31 (100.0%) |
Physical Housing Characteristics in Jamestown
Housing Structures in Jamestown
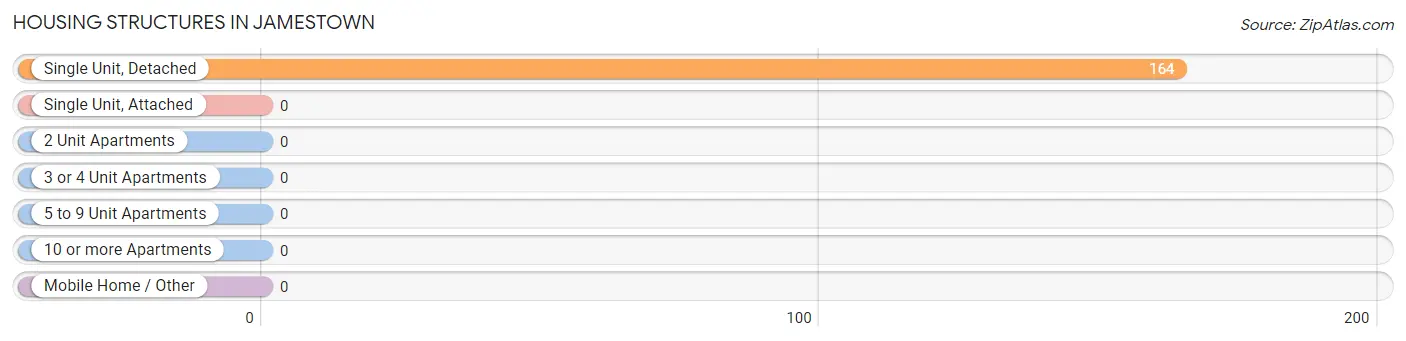
| Structure Type | # Housing Units | % Housing Units |
| Single Unit, Detached | 164 | 100.0% |
| Single Unit, Attached | 0 | 0.0% |
| 2 Unit Apartments | 0 | 0.0% |
| 3 or 4 Unit Apartments | 0 | 0.0% |
| 5 to 9 Unit Apartments | 0 | 0.0% |
| 10 or more Apartments | 0 | 0.0% |
| Mobile Home / Other | 0 | 0.0% |
| Total | 164 | 100.0% |
Housing Structures by Occupancy in Jamestown
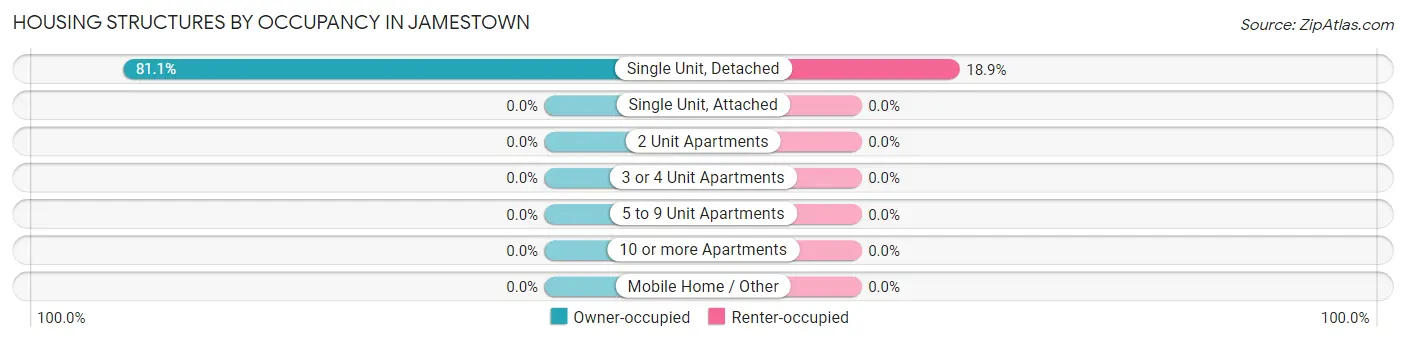
| Structure Type | Owner-occupied | Renter-occupied |
| Single Unit, Detached | 133 (81.1%) | 31 (18.9%) |
| Single Unit, Attached | 0 (0.0%) | 0 (0.0%) |
| 2 Unit Apartments | 0 (0.0%) | 0 (0.0%) |
| 3 or 4 Unit Apartments | 0 (0.0%) | 0 (0.0%) |
| 5 to 9 Unit Apartments | 0 (0.0%) | 0 (0.0%) |
| 10 or more Apartments | 0 (0.0%) | 0 (0.0%) |
| Mobile Home / Other | 0 (0.0%) | 0 (0.0%) |
| Total | 133 (81.1%) | 31 (18.9%) |
Housing Structures by Number of Rooms in Jamestown
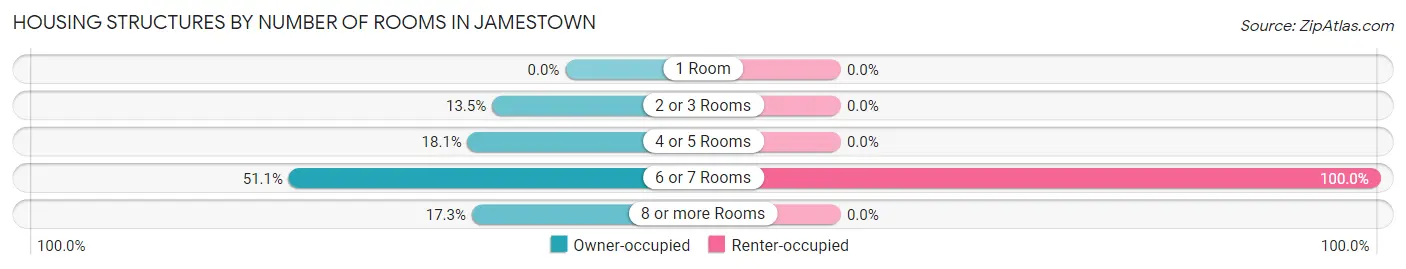
| Number of Rooms | Owner-occupied | Renter-occupied |
| 1 Room | 0 (0.0%) | 0 (0.0%) |
| 2 or 3 Rooms | 18 (13.5%) | 0 (0.0%) |
| 4 or 5 Rooms | 24 (18.0%) | 0 (0.0%) |
| 6 or 7 Rooms | 68 (51.1%) | 31 (100.0%) |
| 8 or more Rooms | 23 (17.3%) | 0 (0.0%) |
| Total | 133 (100.0%) | 31 (100.0%) |
Housing Structure by Heating Type in Jamestown
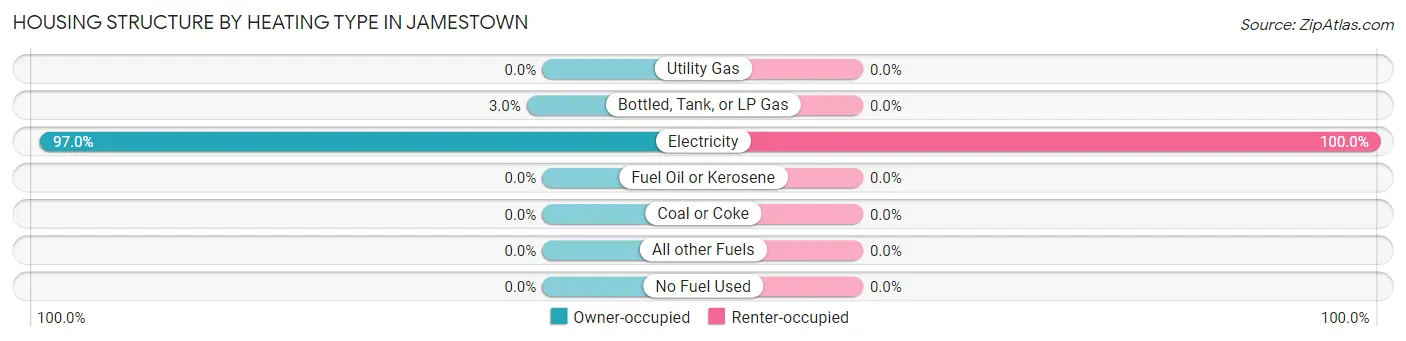
| Heating Type | Owner-occupied | Renter-occupied |
| Utility Gas | 0 (0.0%) | 0 (0.0%) |
| Bottled, Tank, or LP Gas | 4 (3.0%) | 0 (0.0%) |
| Electricity | 129 (97.0%) | 31 (100.0%) |
| Fuel Oil or Kerosene | 0 (0.0%) | 0 (0.0%) |
| Coal or Coke | 0 (0.0%) | 0 (0.0%) |
| All other Fuels | 0 (0.0%) | 0 (0.0%) |
| No Fuel Used | 0 (0.0%) | 0 (0.0%) |
| Total | 133 (100.0%) | 31 (100.0%) |
Household Vehicle Usage in Jamestown
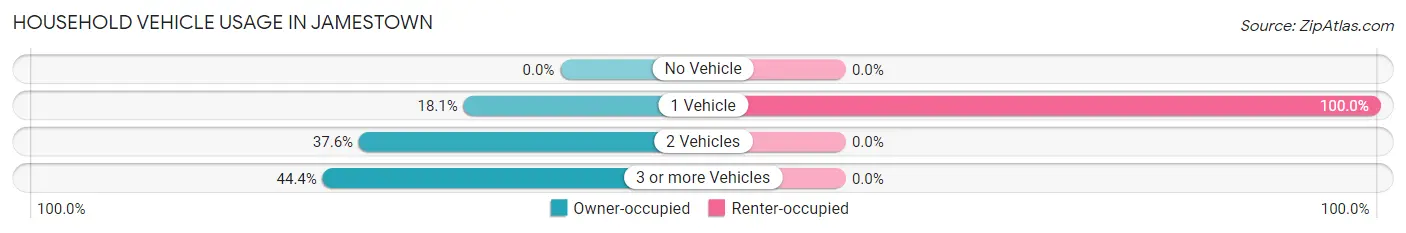
| Vehicles per Household | Owner-occupied | Renter-occupied |
| No Vehicle | 0 (0.0%) | 0 (0.0%) |
| 1 Vehicle | 24 (18.0%) | 31 (100.0%) |
| 2 Vehicles | 50 (37.6%) | 0 (0.0%) |
| 3 or more Vehicles | 59 (44.4%) | 0 (0.0%) |
| Total | 133 (100.0%) | 31 (100.0%) |
Real Estate & Mortgages in Jamestown
Real Estate and Mortgage Overview in Jamestown
| Characteristic | Without Mortgage | With Mortgage |
| Housing Units | 81 | 52 |
| Median Property Value | $545,800 | $341,700 |
| Median Household Income | $81,458 | $3 |
| Monthly Housing Costs | $650 | $3 |
| Real Estate Taxes | $4,500 | $0 |
Property Value by Mortgage Status in Jamestown
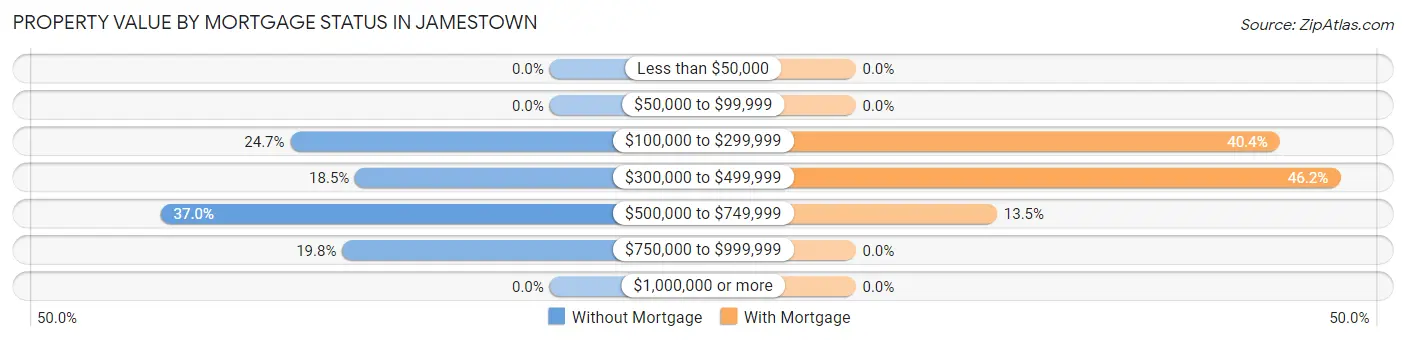
| Property Value | Without Mortgage | With Mortgage |
| Less than $50,000 | 0 (0.0%) | 0 (0.0%) |
| $50,000 to $99,999 | 0 (0.0%) | 0 (0.0%) |
| $100,000 to $299,999 | 20 (24.7%) | 21 (40.4%) |
| $300,000 to $499,999 | 15 (18.5%) | 24 (46.2%) |
| $500,000 to $749,999 | 30 (37.0%) | 7 (13.5%) |
| $750,000 to $999,999 | 16 (19.8%) | 0 (0.0%) |
| $1,000,000 or more | 0 (0.0%) | 0 (0.0%) |
| Total | 81 (100.0%) | 52 (100.0%) |
Household Income by Mortgage Status in Jamestown
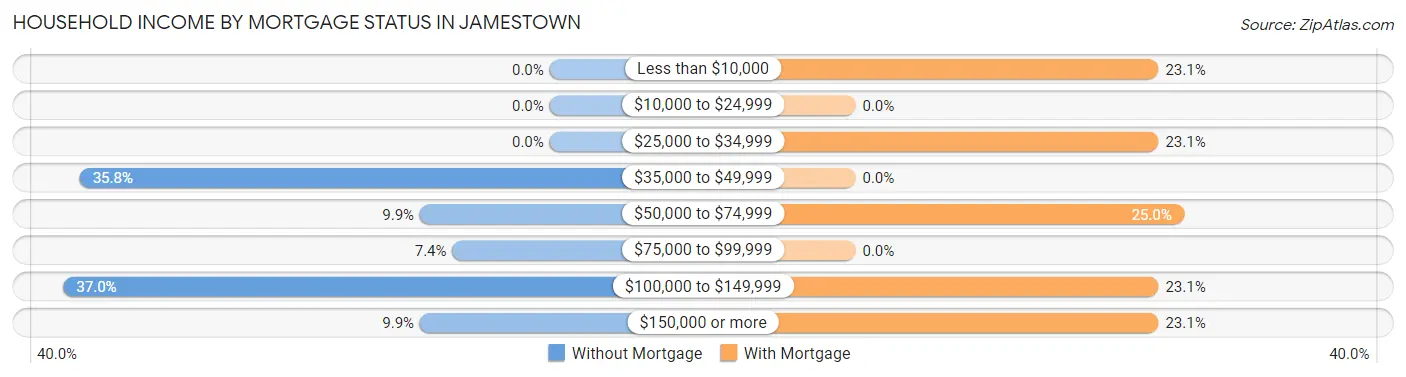
| Household Income | Without Mortgage | With Mortgage |
| Less than $10,000 | 0 (0.0%) | 12 (23.1%) |
| $10,000 to $24,999 | 0 (0.0%) | 0 (0.0%) |
| $25,000 to $34,999 | 0 (0.0%) | 12 (23.1%) |
| $35,000 to $49,999 | 29 (35.8%) | 0 (0.0%) |
| $50,000 to $74,999 | 8 (9.9%) | 13 (25.0%) |
| $75,000 to $99,999 | 6 (7.4%) | 0 (0.0%) |
| $100,000 to $149,999 | 30 (37.0%) | 12 (23.1%) |
| $150,000 or more | 8 (9.9%) | 12 (23.1%) |
| Total | 81 (100.0%) | 52 (100.0%) |
Property Value to Household Income Ratio in Jamestown
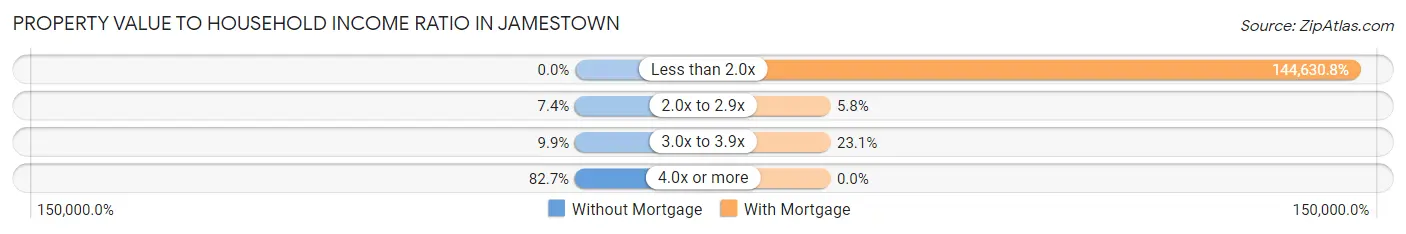
| Value-to-Income Ratio | Without Mortgage | With Mortgage |
| Less than 2.0x | 0 (0.0%) | 75,208 (144,630.8%) |
| 2.0x to 2.9x | 6 (7.4%) | 3 (5.8%) |
| 3.0x to 3.9x | 8 (9.9%) | 12 (23.1%) |
| 4.0x or more | 67 (82.7%) | 0 (0.0%) |
| Total | 81 (100.0%) | 52 (100.0%) |
Real Estate Taxes by Mortgage Status in Jamestown
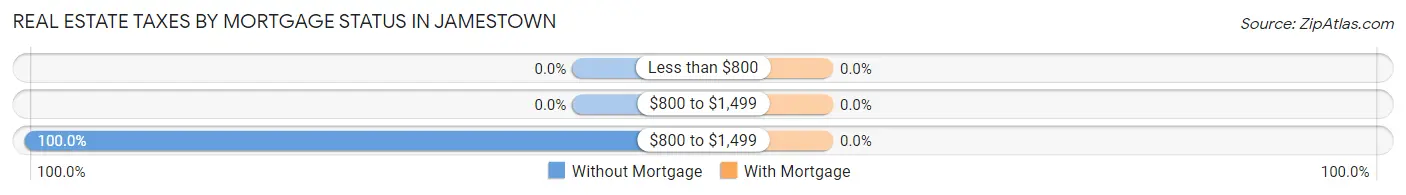
| Property Taxes | Without Mortgage | With Mortgage |
| Less than $800 | 0 (0.0%) | 0 (0.0%) |
| $800 to $1,499 | 0 (0.0%) | 0 (0.0%) |
| $800 to $1,499 | 81 (100.0%) | 0 (0.0%) |
| Total | 81 (100.0%) | 52 (100.0%) |
Health & Disability in Jamestown
Health Insurance Coverage by Age in Jamestown
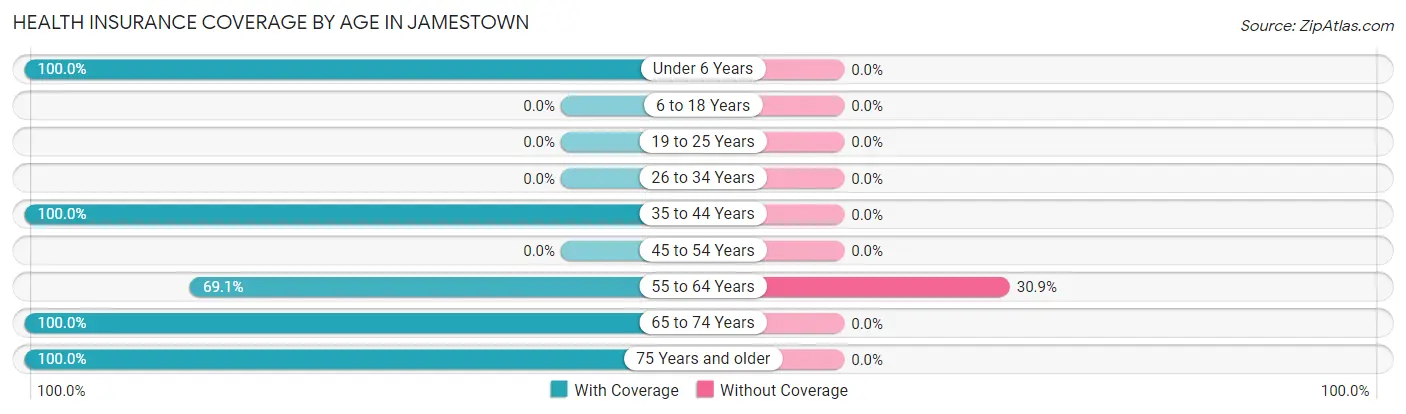
| Age Bracket | With Coverage | Without Coverage |
| Under 6 Years | 28 (100.0%) | 0 (0.0%) |
| 6 to 18 Years | 0 (0.0%) | 0 (0.0%) |
| 19 to 25 Years | 0 (0.0%) | 0 (0.0%) |
| 26 to 34 Years | 0 (0.0%) | 0 (0.0%) |
| 35 to 44 Years | 66 (100.0%) | 0 (0.0%) |
| 45 to 54 Years | 0 (0.0%) | 0 (0.0%) |
| 55 to 64 Years | 56 (69.1%) | 25 (30.9%) |
| 65 to 74 Years | 77 (100.0%) | 0 (0.0%) |
| 75 Years and older | 74 (100.0%) | 0 (0.0%) |
| Total | 301 (92.3%) | 25 (7.7%) |
Health Insurance Coverage by Citizenship Status in Jamestown
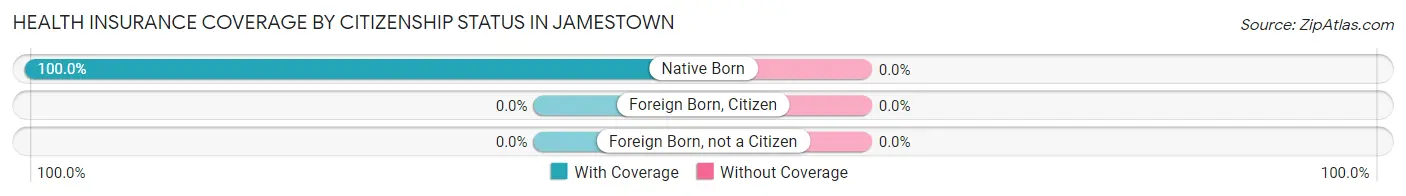
| Citizenship Status | With Coverage | Without Coverage |
| Native Born | 28 (100.0%) | 0 (0.0%) |
| Foreign Born, Citizen | 0 (0.0%) | 0 (0.0%) |
| Foreign Born, not a Citizen | 0 (0.0%) | 0 (0.0%) |
Health Insurance Coverage by Household Income in Jamestown
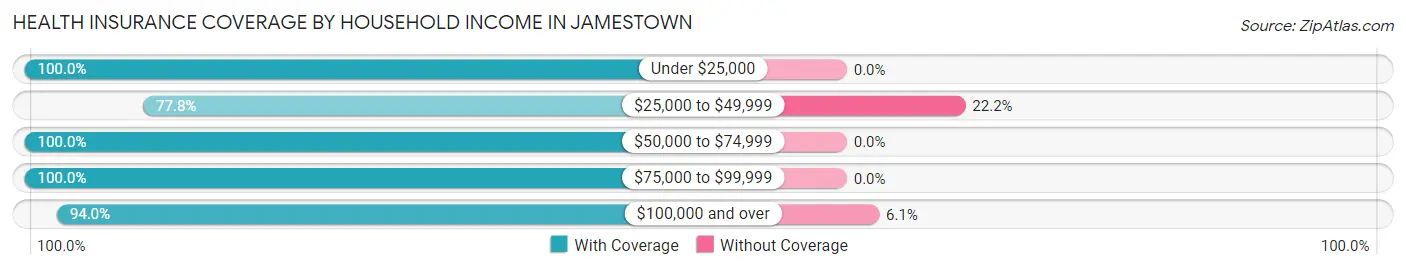
| Household Income | With Coverage | Without Coverage |
| Under $25,000 | 12 (100.0%) | 0 (0.0%) |
| $25,000 to $49,999 | 42 (77.8%) | 12 (22.2%) |
| $50,000 to $74,999 | 8 (100.0%) | 0 (0.0%) |
| $75,000 to $99,999 | 37 (100.0%) | 0 (0.0%) |
| $100,000 and over | 202 (94.0%) | 13 (6.0%) |
Public vs Private Health Insurance Coverage by Age in Jamestown
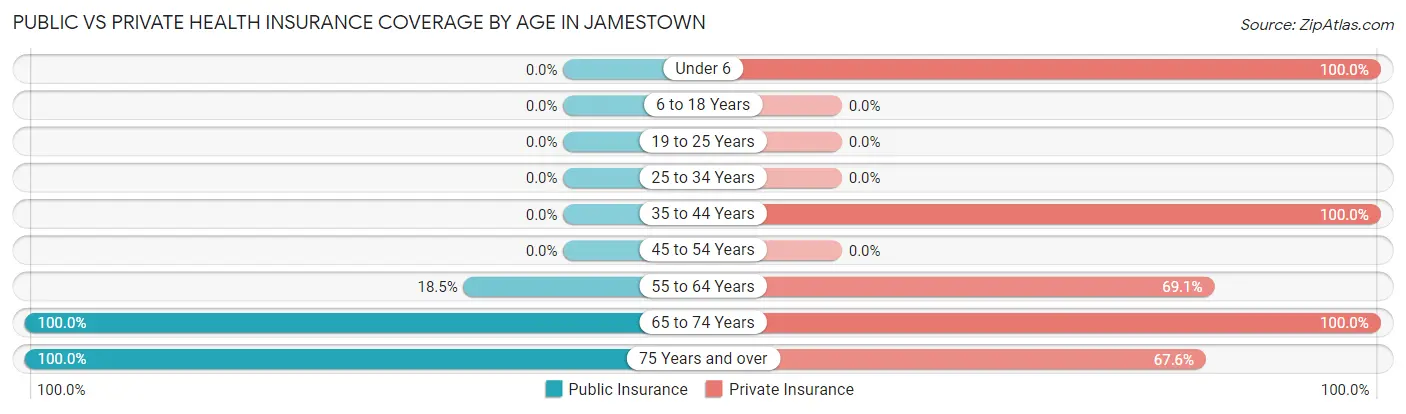
| Age Bracket | Public Insurance | Private Insurance |
| Under 6 | 0 (0.0%) | 28 (100.0%) |
| 6 to 18 Years | 0 (0.0%) | 0 (0.0%) |
| 19 to 25 Years | 0 (0.0%) | 0 (0.0%) |
| 25 to 34 Years | 0 (0.0%) | 0 (0.0%) |
| 35 to 44 Years | 0 (0.0%) | 66 (100.0%) |
| 45 to 54 Years | 0 (0.0%) | 0 (0.0%) |
| 55 to 64 Years | 15 (18.5%) | 56 (69.1%) |
| 65 to 74 Years | 77 (100.0%) | 77 (100.0%) |
| 75 Years and over | 74 (100.0%) | 50 (67.6%) |
| Total | 166 (50.9%) | 277 (85.0%) |
Disability Status by Sex by Age in Jamestown
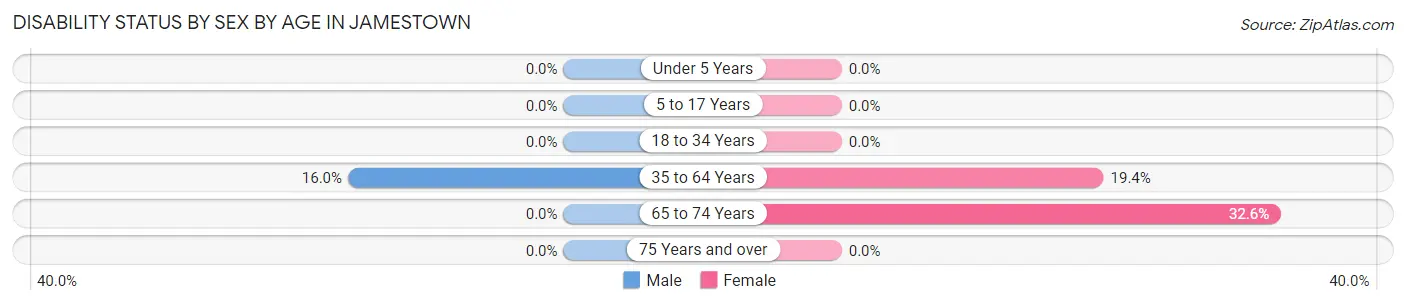
| Age Bracket | Male | Female |
| Under 5 Years | 0 (0.0%) | 0 (0.0%) |
| 5 to 17 Years | 0 (0.0%) | 0 (0.0%) |
| 18 to 34 Years | 0 (0.0%) | 0 (0.0%) |
| 35 to 64 Years | 12 (16.0%) | 14 (19.4%) |
| 65 to 74 Years | 0 (0.0%) | 15 (32.6%) |
| 75 Years and over | 0 (0.0%) | 0 (0.0%) |
Disability Class by Sex by Age in Jamestown
Disability Class: Hearing Difficulty
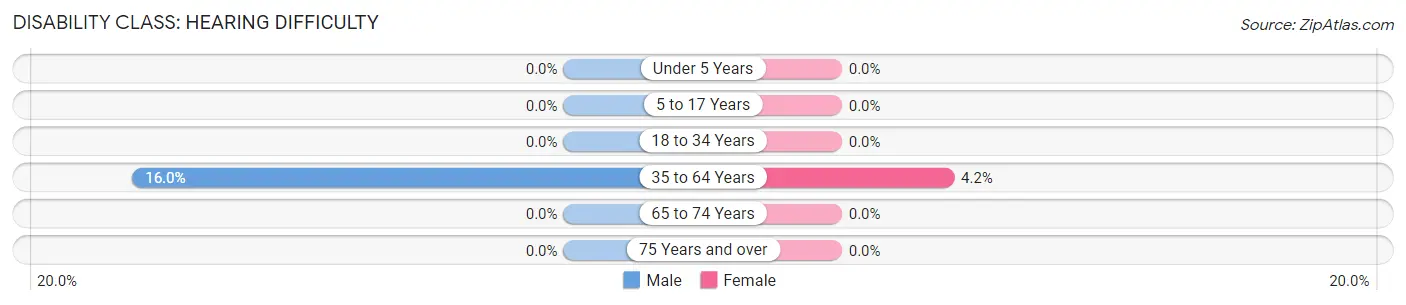
| Age Bracket | Male | Female |
| Under 5 Years | 0 (0.0%) | 0 (0.0%) |
| 5 to 17 Years | 0 (0.0%) | 0 (0.0%) |
| 18 to 34 Years | 0 (0.0%) | 0 (0.0%) |
| 35 to 64 Years | 12 (16.0%) | 3 (4.2%) |
| 65 to 74 Years | 0 (0.0%) | 0 (0.0%) |
| 75 Years and over | 0 (0.0%) | 0 (0.0%) |
Disability Class: Vision Difficulty
| Age Bracket | Male | Female |
| Under 5 Years | 0 (0.0%) | 0 (0.0%) |
| 5 to 17 Years | 0 (0.0%) | 0 (0.0%) |
| 18 to 34 Years | 0 (0.0%) | 0 (0.0%) |
| 35 to 64 Years | 0 (0.0%) | 0 (0.0%) |
| 65 to 74 Years | 0 (0.0%) | 0 (0.0%) |
| 75 Years and over | 0 (0.0%) | 0 (0.0%) |
Disability Class: Cognitive Difficulty
| Age Bracket | Male | Female |
| 5 to 17 Years | 0 (0.0%) | 0 (0.0%) |
| 18 to 34 Years | 0 (0.0%) | 0 (0.0%) |
| 35 to 64 Years | 0 (0.0%) | 0 (0.0%) |
| 65 to 74 Years | 0 (0.0%) | 0 (0.0%) |
| 75 Years and over | 0 (0.0%) | 0 (0.0%) |
Disability Class: Ambulatory Difficulty
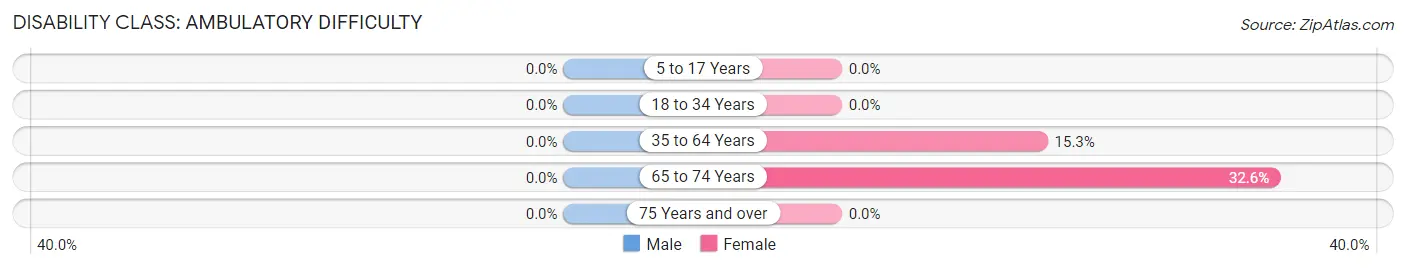
| Age Bracket | Male | Female |
| 5 to 17 Years | 0 (0.0%) | 0 (0.0%) |
| 18 to 34 Years | 0 (0.0%) | 0 (0.0%) |
| 35 to 64 Years | 0 (0.0%) | 11 (15.3%) |
| 65 to 74 Years | 0 (0.0%) | 15 (32.6%) |
| 75 Years and over | 0 (0.0%) | 0 (0.0%) |
Disability Class: Self-Care Difficulty
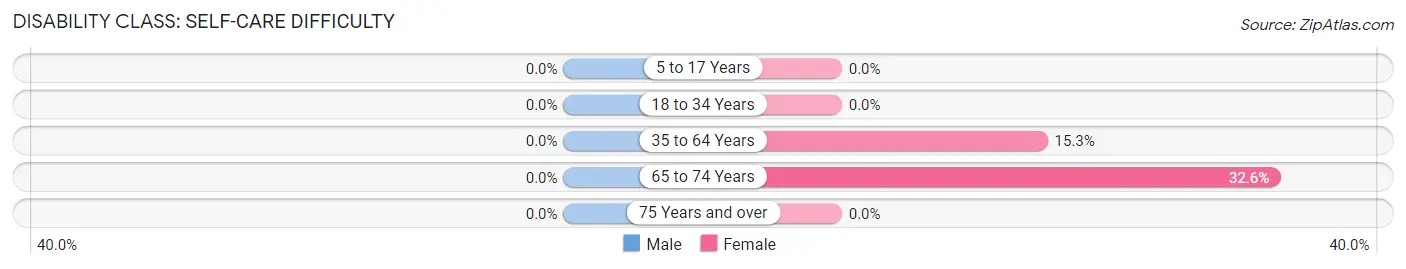
| Age Bracket | Male | Female |
| 5 to 17 Years | 0 (0.0%) | 0 (0.0%) |
| 18 to 34 Years | 0 (0.0%) | 0 (0.0%) |
| 35 to 64 Years | 0 (0.0%) | 11 (15.3%) |
| 65 to 74 Years | 0 (0.0%) | 15 (32.6%) |
| 75 Years and over | 0 (0.0%) | 0 (0.0%) |
Technology Access in Jamestown
Computing Device Access in Jamestown
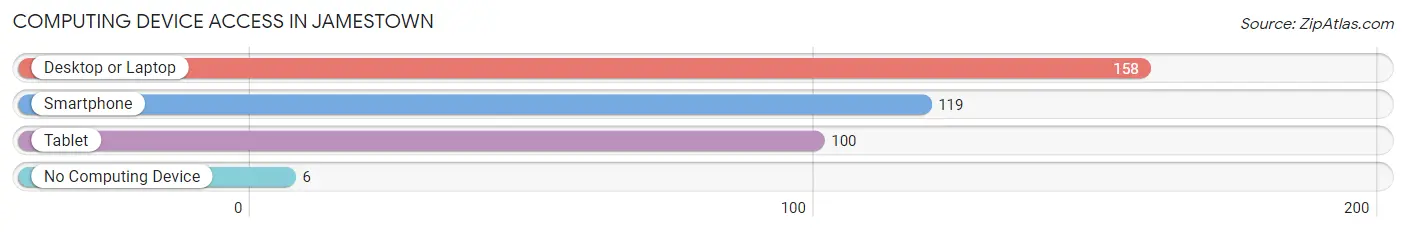
| Device Type | # Households | % Households |
| Desktop or Laptop | 158 | 96.3% |
| Smartphone | 119 | 72.6% |
| Tablet | 100 | 61.0% |
| No Computing Device | 6 | 3.7% |
| Total | 164 | 100.0% |
Internet Access in Jamestown
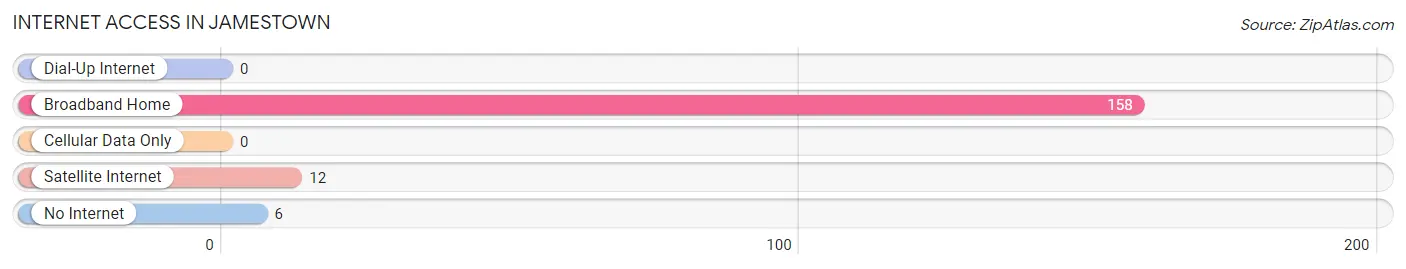
| Internet Type | # Households | % Households |
| Dial-Up Internet | 0 | 0.0% |
| Broadband Home | 158 | 96.3% |
| Cellular Data Only | 0 | 0.0% |
| Satellite Internet | 12 | 7.3% |
| No Internet | 6 | 3.7% |
| Total | 164 | 100.0% |
Jamestown Summary
Jamesown, Washington is a small city located in the northwest corner of the state, in the county of Jefferson. It is situated on the banks of the Columbia River, and is the county seat of Jefferson County. The city has a population of approximately 2,000 people, and is the largest city in the county.
History
The area that is now Jamesown was first inhabited by the Chinook Indians, who lived in the area for thousands of years before the arrival of Europeans. The first Europeans to explore the area were members of the Lewis and Clark Expedition, who arrived in 1805. The area was later explored by fur traders, who established trading posts in the area.
In 1845, the area was officially established as a town by the Washington Territorial Legislature. The town was named after James Town, a local settler who had arrived in the area in 1841. The town quickly grew, and by the late 1800s, it had become a major port for the shipping of lumber and other goods.
Geography
Jamesown is located in the northwest corner of Washington State, in the county of Jefferson. It is situated on the banks of the Columbia River, and is the county seat of Jefferson County. The city has a total area of 2.2 square miles, all of which is land. The city is located at an elevation of approximately 20 feet above sea level.
The climate in Jamesown is classified as a temperate oceanic climate, with mild winters and warm summers. The average annual temperature is around 50 degrees Fahrenheit, with an average high of around 70 degrees in the summer and an average low of around 30 degrees in the winter.
Economy
The economy of Jamesown is largely based on tourism and the timber industry. The city is home to several tourist attractions, including the Jamesown Historical Museum, the Jamesown Lighthouse, and the Jamesown Aquarium. The city is also home to several timber companies, which provide jobs for many of the city's residents.
In addition to these industries, Jamesown is also home to several small businesses, including restaurants, retail stores, and other services. The city is also home to several educational institutions, including a community college and a technical college.
Demographics
As of the 2010 census, the population of Jamesown was 2,000 people. The racial makeup of the city was 94.2% White, 0.7% African American, 0.3% Native American, 0.7% Asian, 0.1% Pacific Islander, 0.7% from other races, and 2.2% from two or more races. Hispanic or Latino of any race were 2.2% of the population.
The median income for a household in Jamesown was $37,500, and the median income for a family was $45,000. The per capita income for the city was $19,000. About 11.2% of families and 14.2% of the population were below the poverty line, including 18.2% of those under age 18 and 8.2% of those age 65 or over.
Common Questions
What is Per Capita Income in Jamestown?
Per Capita income in Jamestown is $55,843.
What is the Median Family Income in Jamestown?
Median Family Income in Jamestown is $143,636.
What is the Median Household income in Jamestown?
Median Household Income in Jamestown is $100,625.
What is Inequality or Gini Index in Jamestown?
Inequality or Gini Index in Jamestown is 0.37.
What is the Total Population of Jamestown?
Total Population of Jamestown is 326.
What is the Total Male Population of Jamestown?
Total Male Population of Jamestown is 134.
What is the Total Female Population of Jamestown?
Total Female Population of Jamestown is 192.
What is the Ratio of Males per 100 Females in Jamestown?
There are 69.79 Males per 100 Females in Jamestown.
What is the Ratio of Females per 100 Males in Jamestown?
There are 143.28 Females per 100 Males in Jamestown.
What is the Median Population Age in Jamestown?
Median Population Age in Jamestown is 63.5 Years.
What is the Average Family Size in Jamestown
Average Family Size in Jamestown is 2.5 People.
What is the Average Household Size in Jamestown
Average Household Size in Jamestown is 2.0 People.
How Large is the Labor Force in Jamestown?
There are 115 People in the Labor Forcein in Jamestown.
What is the Percentage of People in the Labor Force in Jamestown?
38.6% of People are in the Labor Force in Jamestown.
What is the Unemployment Rate in Jamestown?
Unemployment Rate in Jamestown is 11.3%.