Zip Codes with the Highest Percentage of Population with a Degree in Liberal Arts and History in Puyallup, WA
RELATED REPORTS & OPTIONS
Liberal Arts and History
Puyallup
Compare Zip Codes
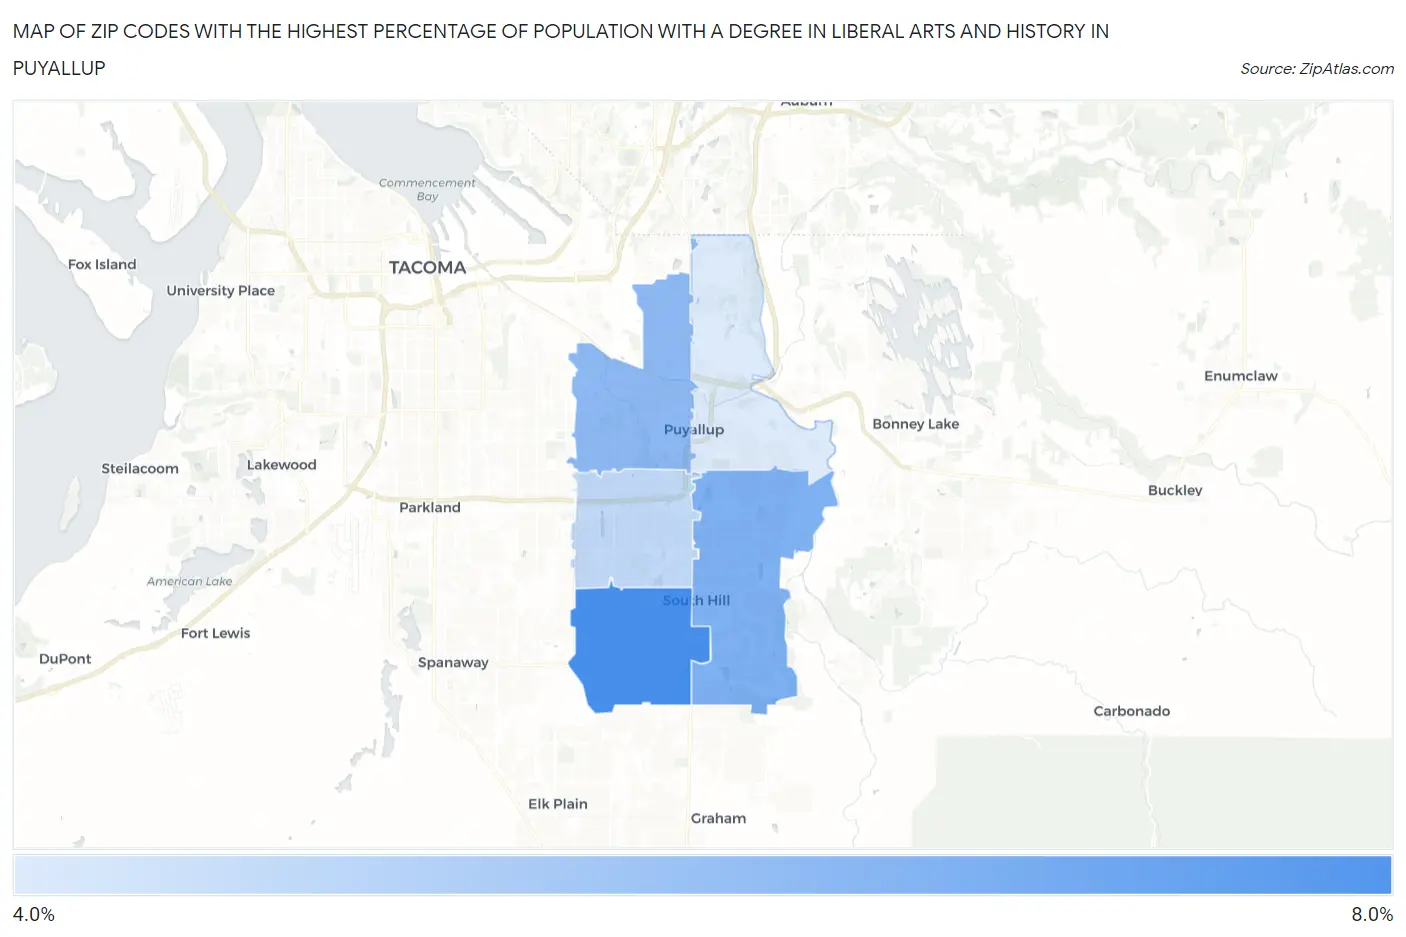
Map of Zip Codes with the Highest Percentage of Population with a Degree in Liberal Arts and History in Puyallup
4.2%
7.2%
Zip Codes with the Highest Percentage of Population with a Degree in Liberal Arts and History in Puyallup, WA
| Zip Code | % Graduates | vs State | vs National | |
| 1. | 98375 | 7.2% | 5.1%(+2.06)#118 | 4.9%(+2.34)#6,032 |
| 2. | 98374 | 6.1% | 5.1%(+0.934)#187 | 4.9%(+1.21)#8,311 |
| 3. | 98371 | 5.8% | 5.1%(+0.670)#199 | 4.9%(+0.946)#8,995 |
| 4. | 98373 | 4.7% | 5.1%(-0.421)#274 | 4.9%(-0.145)#12,234 |
| 5. | 98372 | 4.2% | 5.1%(-0.952)#317 | 4.9%(-0.676)#14,022 |
1
Common Questions
What are the Top 3 Zip Codes with the Highest Percentage of Population with a Degree in Liberal Arts and History in Puyallup, WA?
Top 3 Zip Codes with the Highest Percentage of Population with a Degree in Liberal Arts and History in Puyallup, WA are:
What zip code has the Highest Percentage of Population with a Degree in Liberal Arts and History in Puyallup, WA?
98375 has the Highest Percentage of Population with a Degree in Liberal Arts and History in Puyallup, WA with 7.2%.
What is the Percentage of Population with a Degree in Liberal Arts and History in Puyallup, WA?
Percentage of Population with a Degree in Liberal Arts and History in Puyallup is 5.8%.
What is the Percentage of Population with a Degree in Liberal Arts and History in Washington?
Percentage of Population with a Degree in Liberal Arts and History in Washington is 5.1%.
What is the Percentage of Population with a Degree in Liberal Arts and History in the United States?
Percentage of Population with a Degree in Liberal Arts and History in the United States is 4.9%.