Brady, WA Map & Demographics
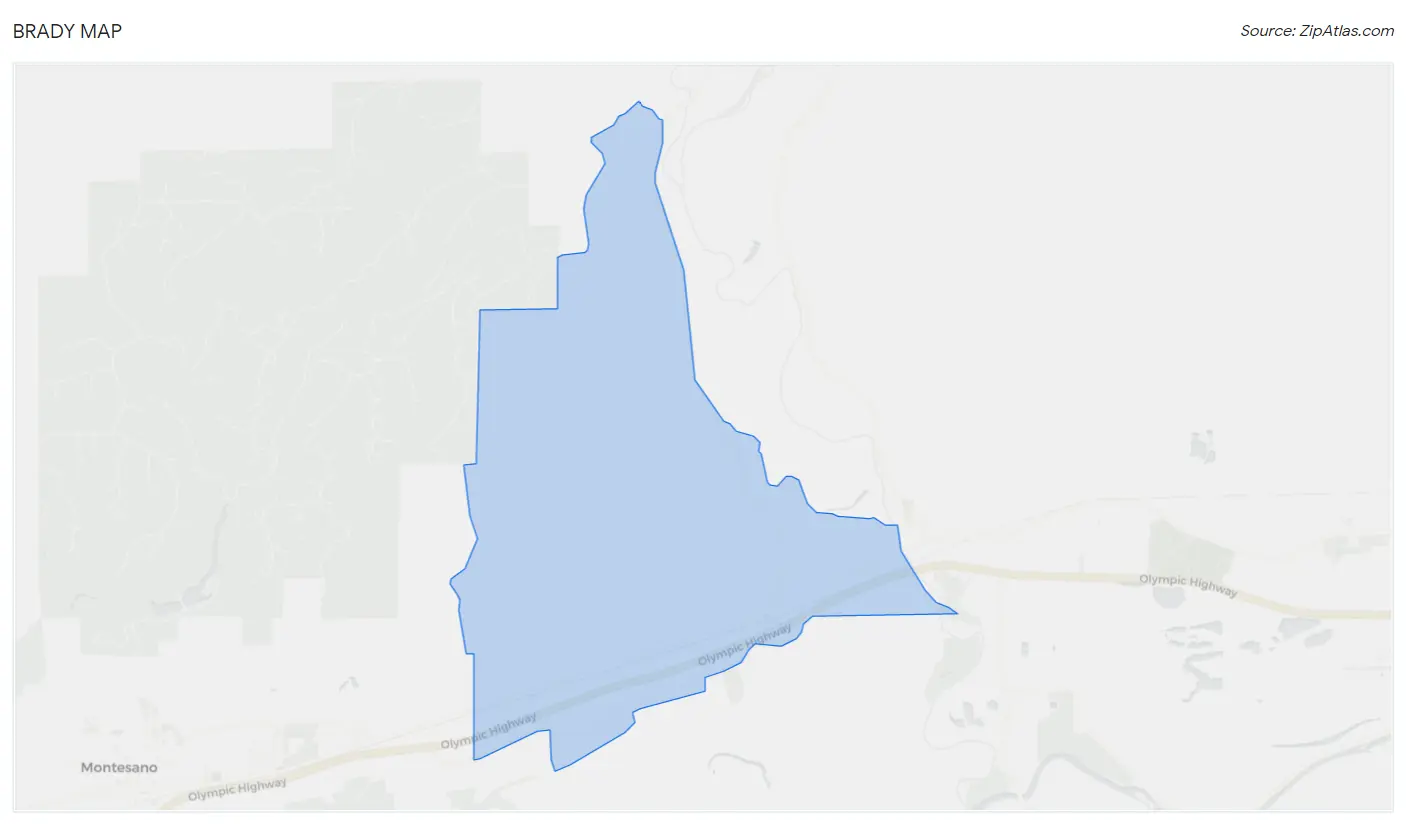
Brady Map
Brady Overview
$29,196
PER CAPITA INCOME
$74,667
AVG FAMILY INCOME
$74,667
AVG HOUSEHOLD INCOME
0.30
INEQUALITY / GINI INDEX
962
TOTAL POPULATION
489
MALE POPULATION
473
FEMALE POPULATION
103.38
MALES / 100 FEMALES
96.73
FEMALES / 100 MALES
50.8
MEDIAN AGE
3.0
AVG FAMILY SIZE
2.9
AVG HOUSEHOLD SIZE
275
LABOR FORCE [ PEOPLE ]
35.4%
PERCENT IN LABOR FORCE
3.3%
UNEMPLOYMENT RATE
Income in Brady
Income Overview in Brady
Per Capita Income in Brady is $29,196, while median incomes of families and households are $74,667 and $74,667 respectively.
| Characteristic | Number | Measure |
| Per Capita Income | 962 | $29,196 |
| Median Family Income | 306 | $74,667 |
| Mean Family Income | 306 | $88,506 |
| Median Household Income | 336 | $74,667 |
| Mean Household Income | 336 | $86,053 |
| Income Deficit | 306 | $0 |
| Wage / Income Gap (%) | 962 | 0.00% |
| Wage / Income Gap ($) | 962 | 100.00¢ per $1 |
| Gini / Inequality Index | 962 | 0.30 |
Earnings by Sex in Brady
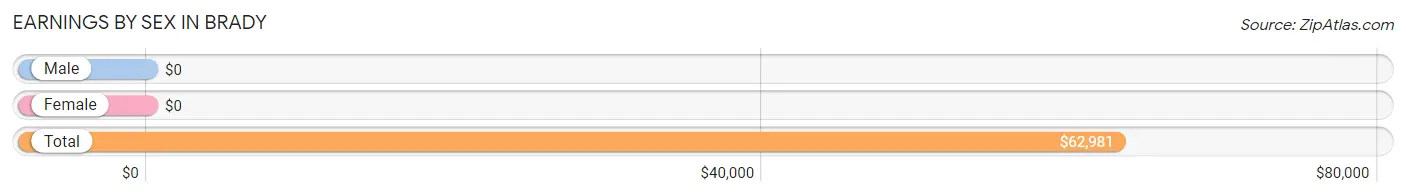
| Sex | Number | Average Earnings |
| Male | 140 (50.9%) | $0 |
| Female | 135 (49.1%) | $0 |
| Total | 275 (100.0%) | $62,981 |
Earnings by Sex by Income Bracket in Brady
The most common earnings brackets in Brady are $100,000+ for men (75 | 53.6%) and $30,000 to $34,999 for women (58 | 43.0%).
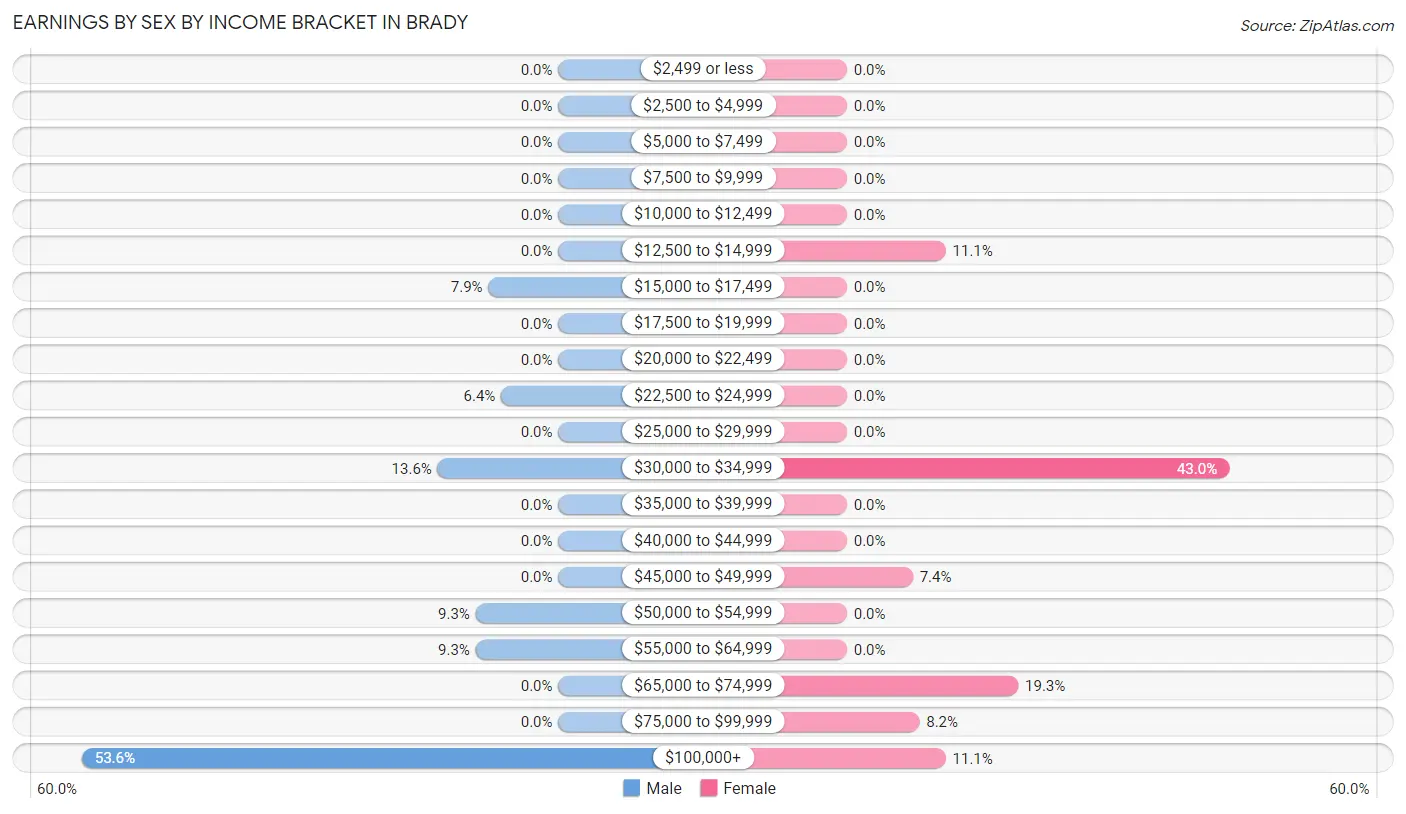
| Income | Male | Female |
| $2,499 or less | 0 (0.0%) | 0 (0.0%) |
| $2,500 to $4,999 | 0 (0.0%) | 0 (0.0%) |
| $5,000 to $7,499 | 0 (0.0%) | 0 (0.0%) |
| $7,500 to $9,999 | 0 (0.0%) | 0 (0.0%) |
| $10,000 to $12,499 | 0 (0.0%) | 0 (0.0%) |
| $12,500 to $14,999 | 0 (0.0%) | 15 (11.1%) |
| $15,000 to $17,499 | 11 (7.9%) | 0 (0.0%) |
| $17,500 to $19,999 | 0 (0.0%) | 0 (0.0%) |
| $20,000 to $22,499 | 0 (0.0%) | 0 (0.0%) |
| $22,500 to $24,999 | 9 (6.4%) | 0 (0.0%) |
| $25,000 to $29,999 | 0 (0.0%) | 0 (0.0%) |
| $30,000 to $34,999 | 19 (13.6%) | 58 (43.0%) |
| $35,000 to $39,999 | 0 (0.0%) | 0 (0.0%) |
| $40,000 to $44,999 | 0 (0.0%) | 0 (0.0%) |
| $45,000 to $49,999 | 0 (0.0%) | 10 (7.4%) |
| $50,000 to $54,999 | 13 (9.3%) | 0 (0.0%) |
| $55,000 to $64,999 | 13 (9.3%) | 0 (0.0%) |
| $65,000 to $74,999 | 0 (0.0%) | 26 (19.3%) |
| $75,000 to $99,999 | 0 (0.0%) | 11 (8.2%) |
| $100,000+ | 75 (53.6%) | 15 (11.1%) |
| Total | 140 (100.0%) | 135 (100.0%) |
Earnings by Sex by Educational Attainment in Brady
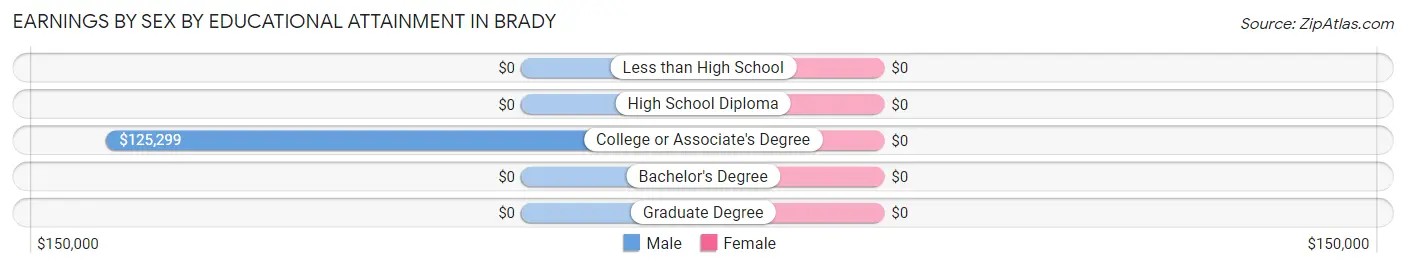
| Educational Attainment | Male Income | Female Income |
| Less than High School | - | - |
| High School Diploma | - | - |
| College or Associate's Degree | $125,299 | $0 |
| Bachelor's Degree | - | - |
| Graduate Degree | - | - |
| Total | - | - |
Family Income in Brady
Family Income Brackets in Brady
According to the Brady family income data, there are 85 families falling into the $35,000 to $49,999 income range, which is the most common income bracket and makes up 27.8% of all families.
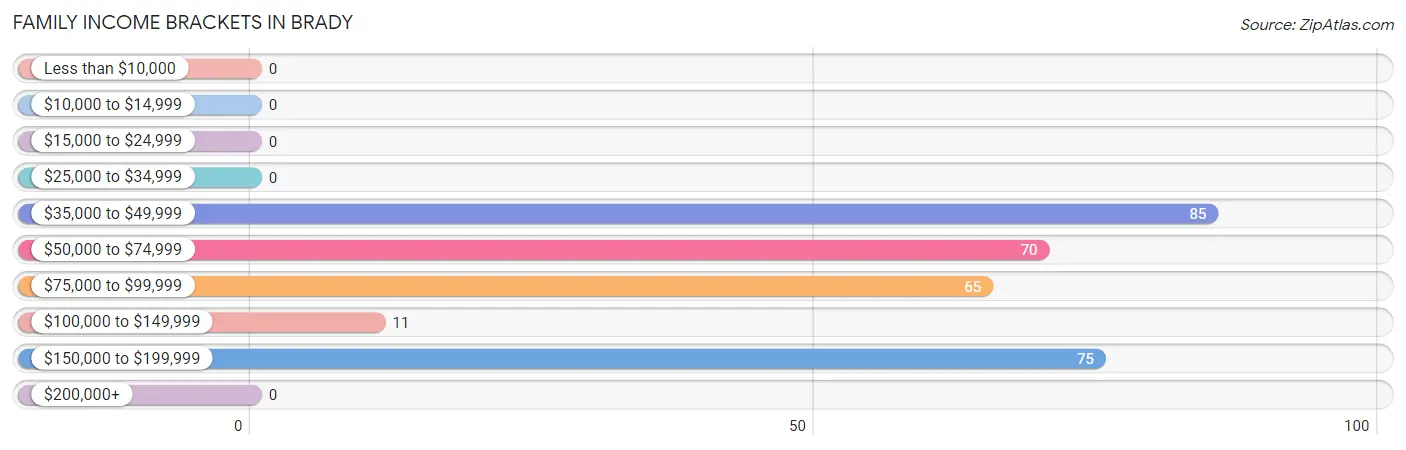
| Income Bracket | # Families | % Families |
| Less than $10,000 | 0 | 0.0% |
| $10,000 to $14,999 | 0 | 0.0% |
| $15,000 to $24,999 | 0 | 0.0% |
| $25,000 to $34,999 | 0 | 0.0% |
| $35,000 to $49,999 | 85 | 27.8% |
| $50,000 to $74,999 | 70 | 22.9% |
| $75,000 to $99,999 | 65 | 21.2% |
| $100,000 to $149,999 | 11 | 3.6% |
| $150,000 to $199,999 | 75 | 24.5% |
| $200,000+ | 0 | 0.0% |
Family Income by Famaliy Size in Brady
2-person families (105 | 34.3%) account for the highest median family income in Brady with $71,490 per family, while 2-person families (105 | 34.3%) have the highest median income of $35,745 per family member.
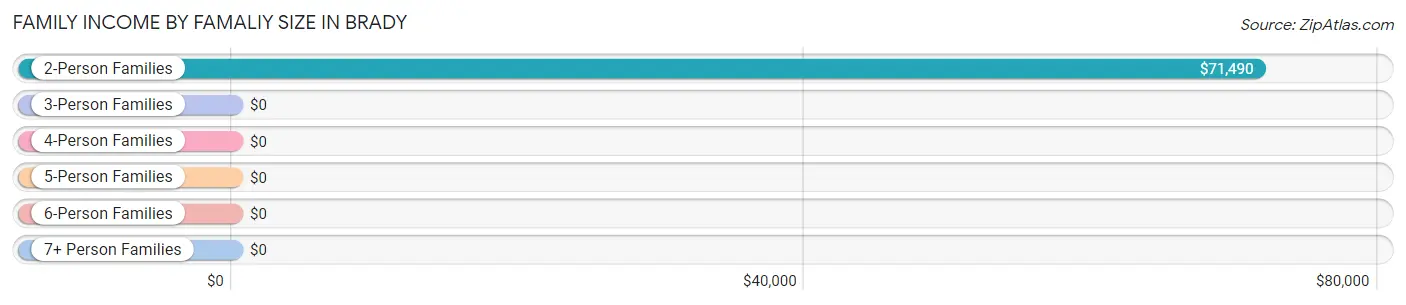
| Income Bracket | # Families | Median Income |
| 2-Person Families | 105 (34.3%) | $71,490 |
| 3-Person Families | 158 (51.6%) | $0 |
| 4-Person Families | 16 (5.2%) | $0 |
| 5-Person Families | 8 (2.6%) | $0 |
| 6-Person Families | 0 (0.0%) | $0 |
| 7+ Person Families | 19 (6.2%) | $0 |
| Total | 306 (100.0%) | $74,667 |
Family Income by Number of Earners in Brady
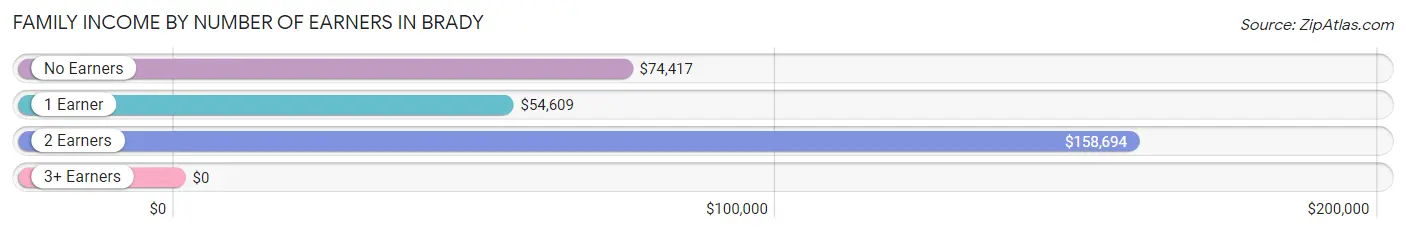
| Number of Earners | # Families | Median Income |
| No Earners | 137 (44.8%) | $74,417 |
| 1 Earner | 83 (27.1%) | $54,609 |
| 2 Earners | 86 (28.1%) | $158,694 |
| 3+ Earners | 0 (0.0%) | $0 |
| Total | 306 (100.0%) | $74,667 |
Household Income in Brady
Household Income Brackets in Brady
With 85 households falling in the category, the $35,000 to $49,999 income range is the most frequent in Brady, accounting for 25.3% of all households.
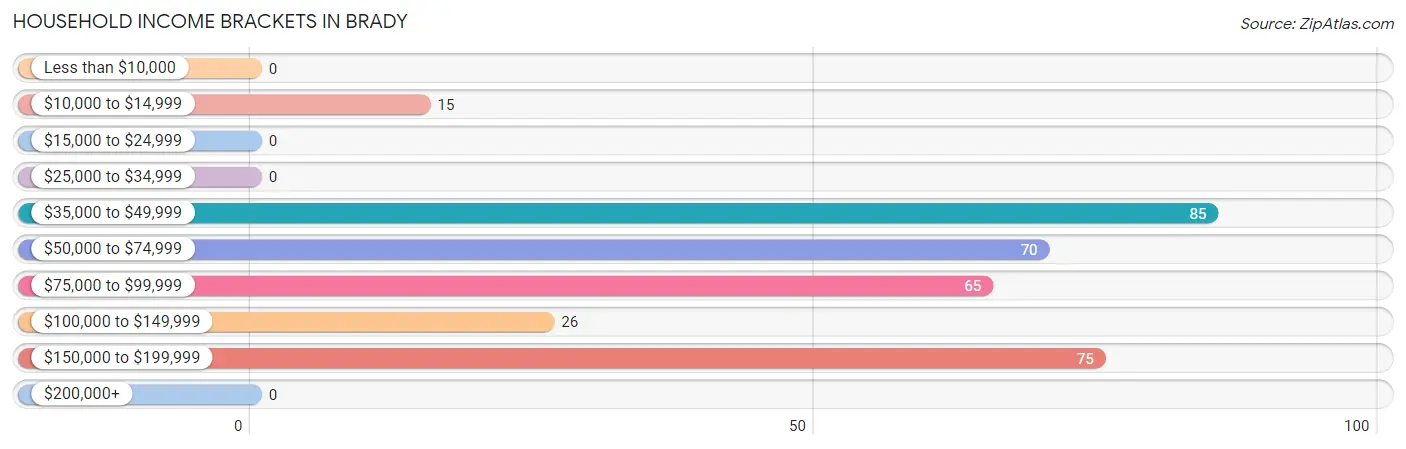
| Income Bracket | # Households | % Households |
| Less than $10,000 | 0 | 0.0% |
| $10,000 to $14,999 | 15 | 4.5% |
| $15,000 to $24,999 | 0 | 0.0% |
| $25,000 to $34,999 | 0 | 0.0% |
| $35,000 to $49,999 | 85 | 25.3% |
| $50,000 to $74,999 | 70 | 20.8% |
| $75,000 to $99,999 | 65 | 19.3% |
| $100,000 to $149,999 | 26 | 7.7% |
| $150,000 to $199,999 | 75 | 22.3% |
| $200,000+ | 0 | 0.0% |
Household Income by Householder Age in Brady
The median household income in Brady is $74,667, with the highest median household income of $112,614 found in the 45 to 64 years age bracket for the primary householder. A total of 155 households (46.1%) fall into this category.
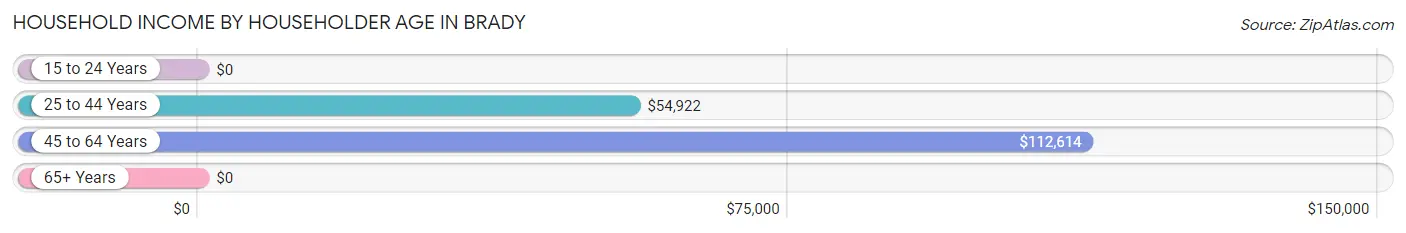
| Income Bracket | # Households | Median Income |
| 15 to 24 Years | 0 (0.0%) | $0 |
| 25 to 44 Years | 69 (20.5%) | $54,922 |
| 45 to 64 Years | 155 (46.1%) | $112,614 |
| 65+ Years | 112 (33.3%) | $0 |
| Total | 336 (100.0%) | $74,667 |
Poverty in Brady
Income Below Poverty by Sex and Age in Brady
With 15.5% poverty level for males and 18.4% for females among the residents of Brady, 12 to 14 year old males and under 5 year old females are the most vulnerable to poverty, with 19 males (100.0%) and 18 females (100.0%) in their respective age groups living below the poverty level.
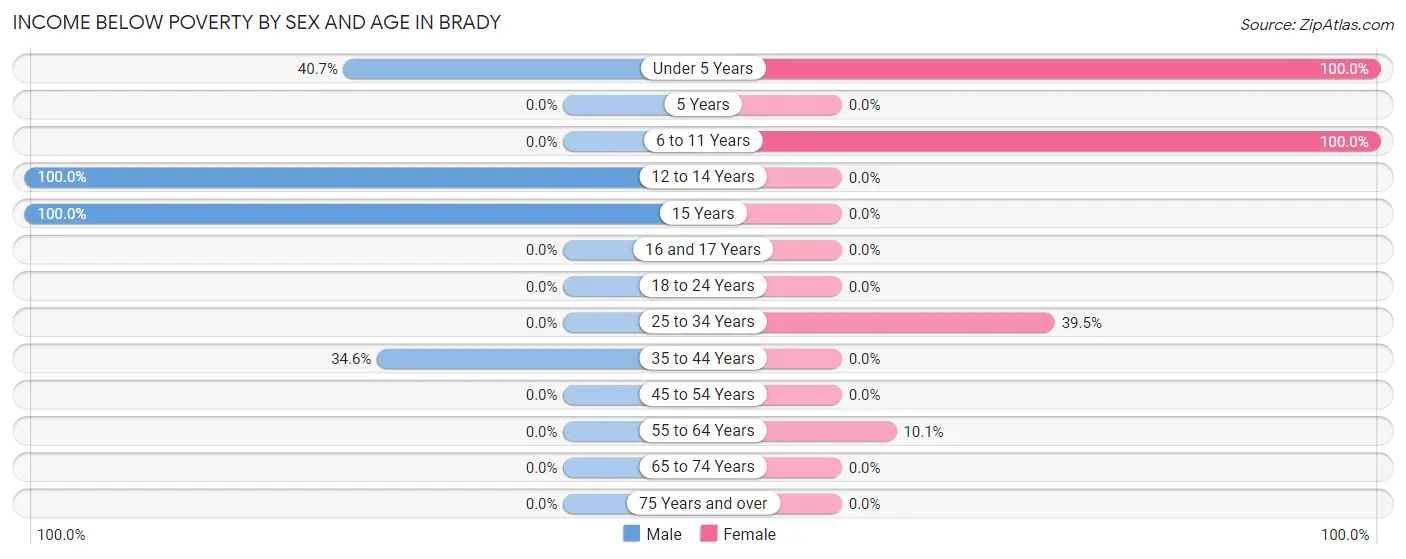
| Age Bracket | Male | Female |
| Under 5 Years | 22 (40.7%) | 18 (100.0%) |
| 5 Years | 0 (0.0%) | 0 (0.0%) |
| 6 to 11 Years | 0 (0.0%) | 37 (100.0%) |
| 12 to 14 Years | 19 (100.0%) | 0 (0.0%) |
| 15 Years | 16 (100.0%) | 0 (0.0%) |
| 16 and 17 Years | 0 (0.0%) | 0 (0.0%) |
| 18 to 24 Years | 0 (0.0%) | 0 (0.0%) |
| 25 to 34 Years | 0 (0.0%) | 17 (39.5%) |
| 35 to 44 Years | 19 (34.5%) | 0 (0.0%) |
| 45 to 54 Years | 0 (0.0%) | 0 (0.0%) |
| 55 to 64 Years | 0 (0.0%) | 15 (10.1%) |
| 65 to 74 Years | 0 (0.0%) | 0 (0.0%) |
| 75 Years and over | 0 (0.0%) | 0 (0.0%) |
| Total | 76 (15.5%) | 87 (18.4%) |
Income Above Poverty by Sex and Age in Brady
According to the poverty statistics in Brady, males aged 6 to 11 years and females aged 16 and 17 years are the age groups that are most secure financially, with 100.0% of males and 100.0% of females in these age groups living above the poverty line.
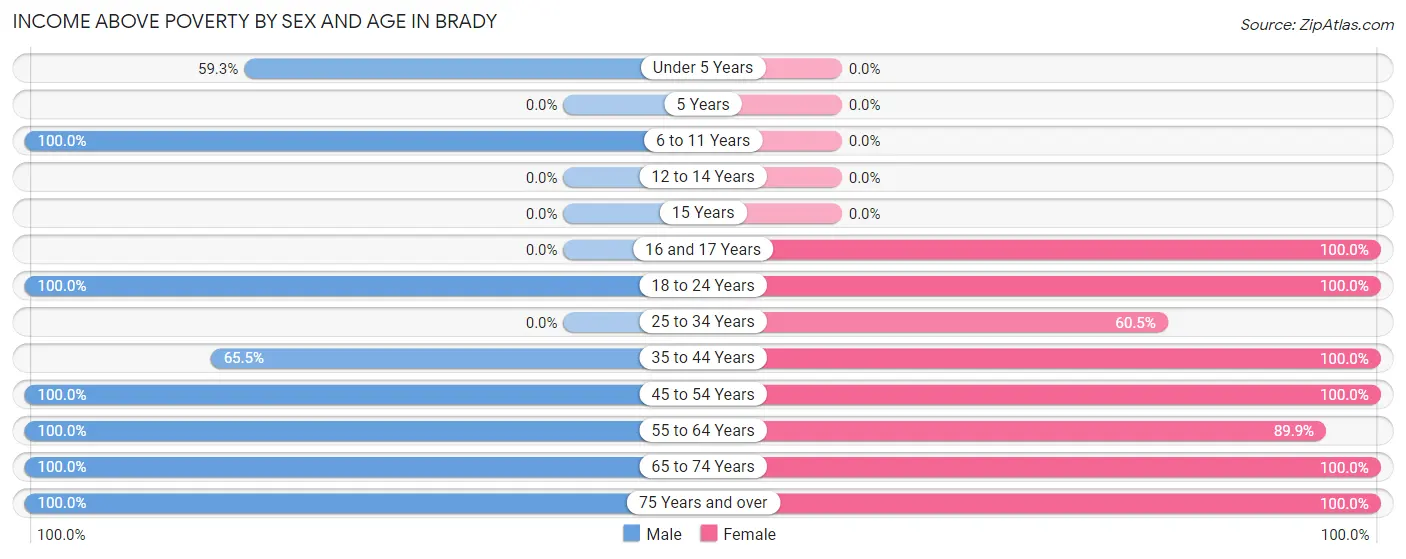
| Age Bracket | Male | Female |
| Under 5 Years | 32 (59.3%) | 0 (0.0%) |
| 5 Years | 0 (0.0%) | 0 (0.0%) |
| 6 to 11 Years | 41 (100.0%) | 0 (0.0%) |
| 12 to 14 Years | 0 (0.0%) | 0 (0.0%) |
| 15 Years | 0 (0.0%) | 0 (0.0%) |
| 16 and 17 Years | 0 (0.0%) | 19 (100.0%) |
| 18 to 24 Years | 91 (100.0%) | 18 (100.0%) |
| 25 to 34 Years | 0 (0.0%) | 26 (60.5%) |
| 35 to 44 Years | 36 (65.4%) | 26 (100.0%) |
| 45 to 54 Years | 67 (100.0%) | 54 (100.0%) |
| 55 to 64 Years | 34 (100.0%) | 133 (89.9%) |
| 65 to 74 Years | 55 (100.0%) | 56 (100.0%) |
| 75 Years and over | 57 (100.0%) | 54 (100.0%) |
| Total | 413 (84.5%) | 386 (81.6%) |
Income Below Poverty Among Married-Couple Families in Brady
The poverty statistics for married-couple families in Brady show that 6.8% or 19 of the total 280 families live below the poverty line. Families with 5 or more children have the highest poverty rate of 100.0%, comprising of 19 families. On the other hand, families with no children have the lowest poverty rate of 0.0%, which includes 0 families.
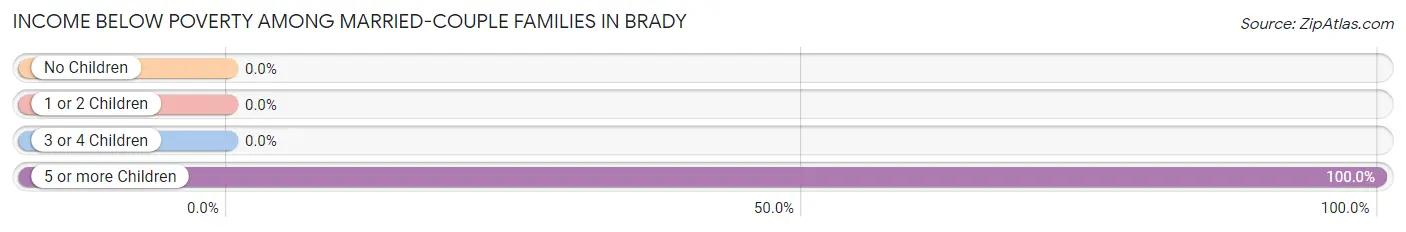
| Children | Above Poverty | Below Poverty |
| No Children | 226 (100.0%) | 0 (0.0%) |
| 1 or 2 Children | 27 (100.0%) | 0 (0.0%) |
| 3 or 4 Children | 8 (100.0%) | 0 (0.0%) |
| 5 or more Children | 0 (0.0%) | 19 (100.0%) |
| Total | 261 (93.2%) | 19 (6.8%) |
Income Below Poverty Among Single-Parent Households in Brady
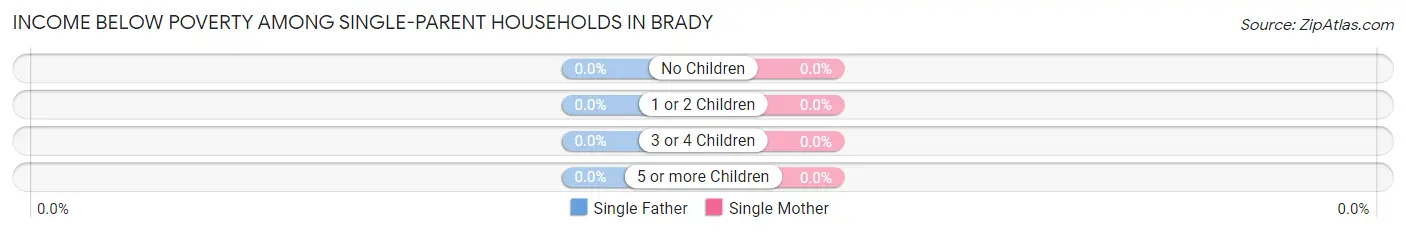
| Children | Single Father | Single Mother |
| No Children | 0 (0.0%) | 0 (0.0%) |
| 1 or 2 Children | 0 (0.0%) | 0 (0.0%) |
| 3 or 4 Children | 0 (0.0%) | 0 (0.0%) |
| 5 or more Children | 0 (0.0%) | 0 (0.0%) |
| Total | 0 (0.0%) | 0 (0.0%) |
Income Below Poverty Among Married-Couple vs Single-Parent Households in Brady
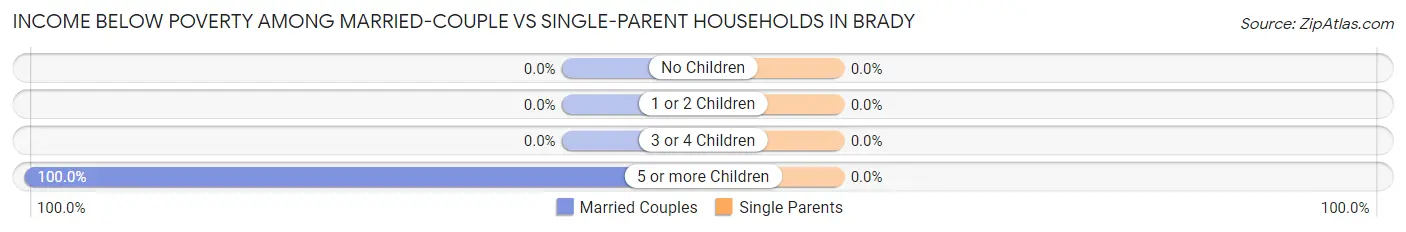
| Children | Married-Couple Families | Single-Parent Households |
| No Children | 0 (0.0%) | 0 (0.0%) |
| 1 or 2 Children | 0 (0.0%) | 0 (0.0%) |
| 3 or 4 Children | 0 (0.0%) | 0 (0.0%) |
| 5 or more Children | 19 (100.0%) | 0 (0.0%) |
| Total | 19 (6.8%) | 0 (0.0%) |
Race in Brady
The most populous races in Brady are White / Caucasian (962 | 100.0%), and Hispanic or Latino (68 | 7.1%).
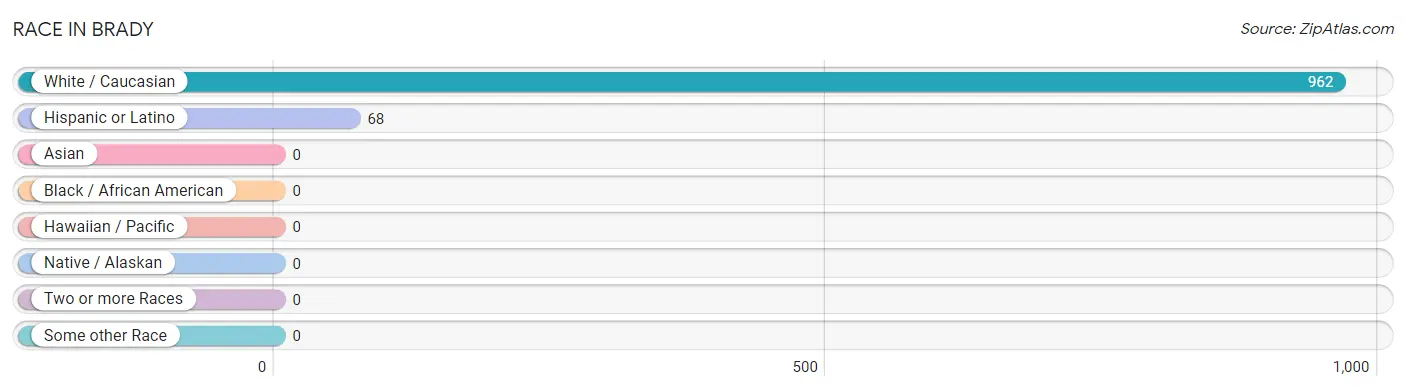
| Race | # Population | % Population |
| Asian | 0 | 0.0% |
| Black / African American | 0 | 0.0% |
| Hawaiian / Pacific | 0 | 0.0% |
| Hispanic or Latino | 68 | 7.1% |
| Native / Alaskan | 0 | 0.0% |
| White / Caucasian | 962 | 100.0% |
| Two or more Races | 0 | 0.0% |
| Some other Race | 0 | 0.0% |
| Total | 962 | 100.0% |
Ancestry in Brady
The most populous ancestries reported in Brady are German (347 | 36.1%), Irish (221 | 23.0%), English (66 | 6.9%), Swedish (64 | 6.7%), and Scottish (56 | 5.8%), together accounting for 78.4% of all Brady residents.
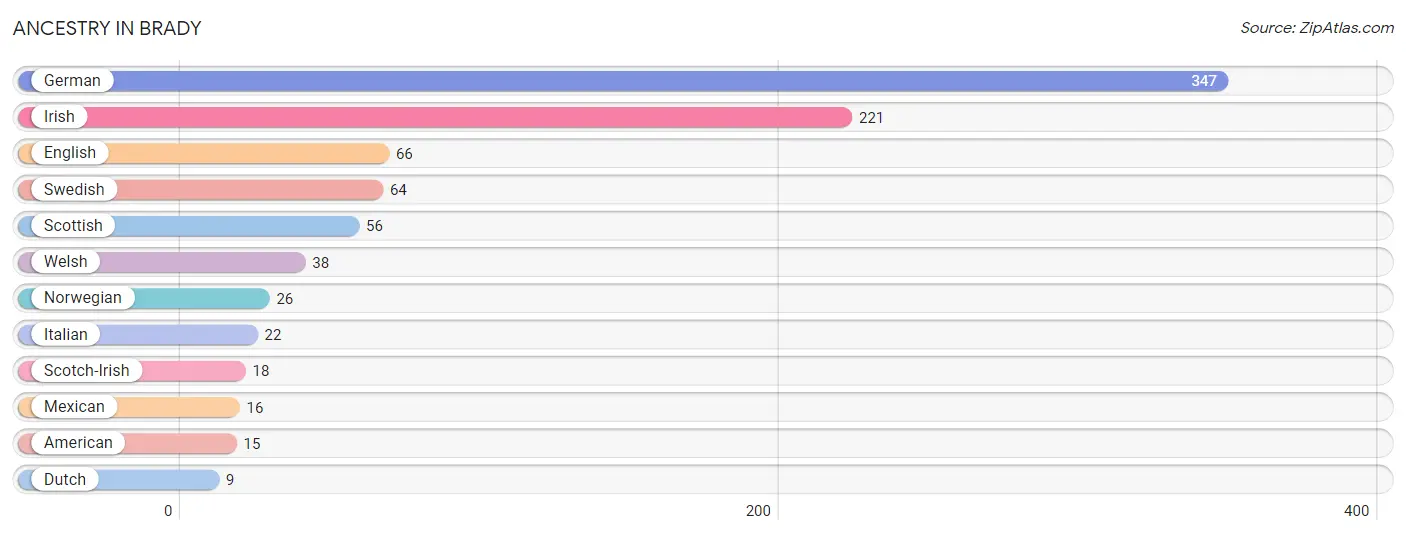
| Ancestry | # Population | % Population |
| American | 15 | 1.6% |
| Dutch | 9 | 0.9% |
| English | 66 | 6.9% |
| German | 347 | 36.1% |
| Irish | 221 | 23.0% |
| Italian | 22 | 2.3% |
| Mexican | 16 | 1.7% |
| Norwegian | 26 | 2.7% |
| Scotch-Irish | 18 | 1.9% |
| Scottish | 56 | 5.8% |
| Swedish | 64 | 6.7% |
| Welsh | 38 | 4.0% | View All 12 Rows |
Immigrants in Brady
The most numerous immigrant groups reported in Brady came from , and Canada (29 | 3.0%), together accounting for 3.0% of all Brady residents.

| Immigration Origin | # Population | % Population |
| Canada | 29 | 3.0% | View All 1 Rows |
Sex and Age in Brady
Sex and Age in Brady
The most populous age groups in Brady are 15 to 19 Years (107 | 21.9%) for men and 55 to 59 Years (126 | 26.6%) for women.
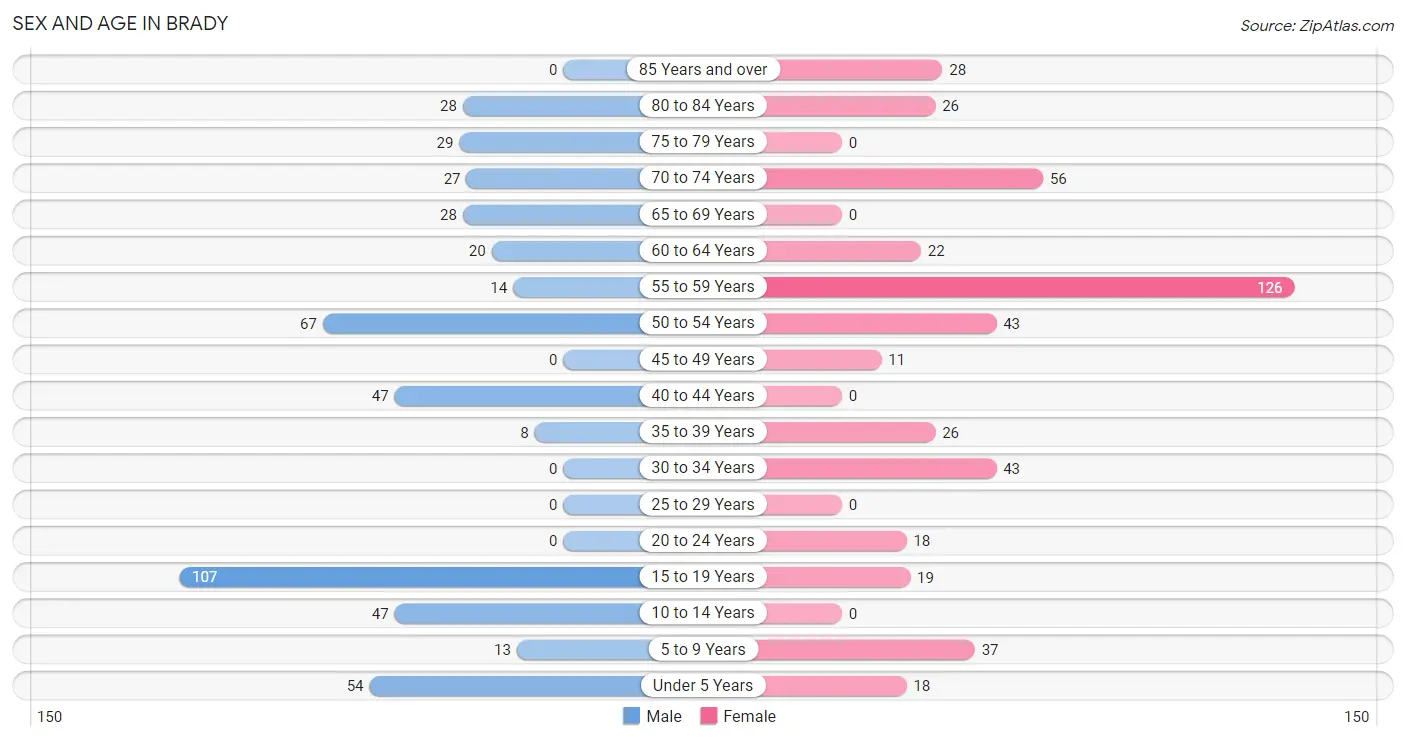
| Age Bracket | Male | Female |
| Under 5 Years | 54 (11.0%) | 18 (3.8%) |
| 5 to 9 Years | 13 (2.7%) | 37 (7.8%) |
| 10 to 14 Years | 47 (9.6%) | 0 (0.0%) |
| 15 to 19 Years | 107 (21.9%) | 19 (4.0%) |
| 20 to 24 Years | 0 (0.0%) | 18 (3.8%) |
| 25 to 29 Years | 0 (0.0%) | 0 (0.0%) |
| 30 to 34 Years | 0 (0.0%) | 43 (9.1%) |
| 35 to 39 Years | 8 (1.6%) | 26 (5.5%) |
| 40 to 44 Years | 47 (9.6%) | 0 (0.0%) |
| 45 to 49 Years | 0 (0.0%) | 11 (2.3%) |
| 50 to 54 Years | 67 (13.7%) | 43 (9.1%) |
| 55 to 59 Years | 14 (2.9%) | 126 (26.6%) |
| 60 to 64 Years | 20 (4.1%) | 22 (4.6%) |
| 65 to 69 Years | 28 (5.7%) | 0 (0.0%) |
| 70 to 74 Years | 27 (5.5%) | 56 (11.8%) |
| 75 to 79 Years | 29 (5.9%) | 0 (0.0%) |
| 80 to 84 Years | 28 (5.7%) | 26 (5.5%) |
| 85 Years and over | 0 (0.0%) | 28 (5.9%) |
| Total | 489 (100.0%) | 473 (100.0%) |
Families and Households in Brady
Median Family Size in Brady
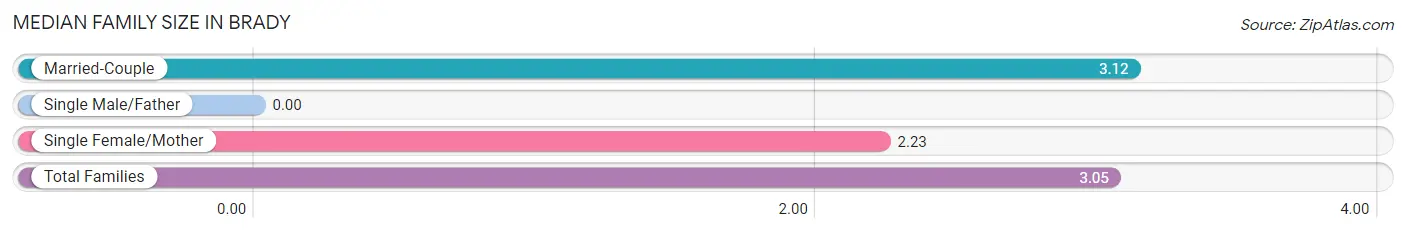
| Family Type | # Families | Family Size |
| Married-Couple | 280 (91.5%) | 3.12 |
| Single Male/Father | 0 (0.0%) | - |
| Single Female/Mother | 26 (8.5%) | 2.23 |
| Total Families | 306 (100.0%) | 3.05 |
Median Household Size in Brady
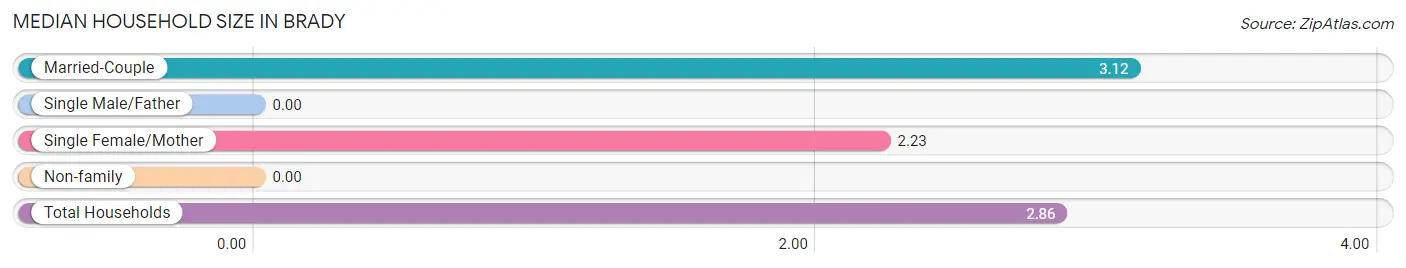
| Household Type | # Households | Household Size |
| Married-Couple | 280 (83.3%) | 3.12 |
| Single Male/Father | 0 (0.0%) | - |
| Single Female/Mother | 26 (7.7%) | 2.23 |
| Non-family | 30 (8.9%) | - |
| Total Households | 336 (100.0%) | 2.86 |
Household Size by Marriage Status in Brady
Out of a total of 336 households in Brady, 306 (91.1%) are family households, while 30 (8.9%) are nonfamily households. The most numerous type of family households are 3-person households, comprising 158, and the most common type of nonfamily households are 1-person households, comprising 30.
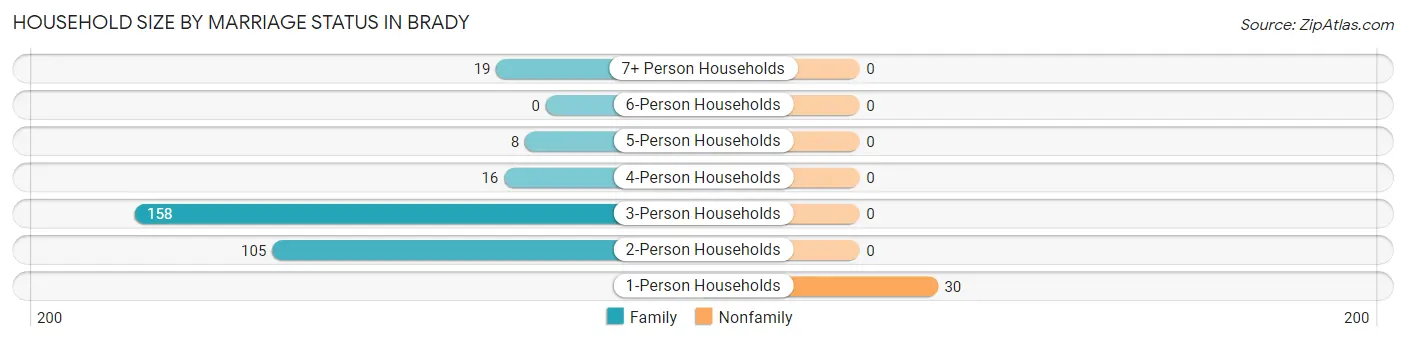
| Household Size | Family Households | Nonfamily Households |
| 1-Person Households | - | 30 (8.9%) |
| 2-Person Households | 105 (31.2%) | 0 (0.0%) |
| 3-Person Households | 158 (47.0%) | 0 (0.0%) |
| 4-Person Households | 16 (4.8%) | 0 (0.0%) |
| 5-Person Households | 8 (2.4%) | 0 (0.0%) |
| 6-Person Households | 0 (0.0%) | 0 (0.0%) |
| 7+ Person Households | 19 (5.7%) | 0 (0.0%) |
| Total | 306 (91.1%) | 30 (8.9%) |
Female Fertility in Brady
Fertility by Age in Brady
Average fertility rate in Brady is 106.0 births per 1,000 women. Women in the age bracket of 20 to 34 years have the highest fertility rate with 279.0 births per 1,000 women. Women in the age bracket of 20 to 34 years acount for 100.0% of all women with births.
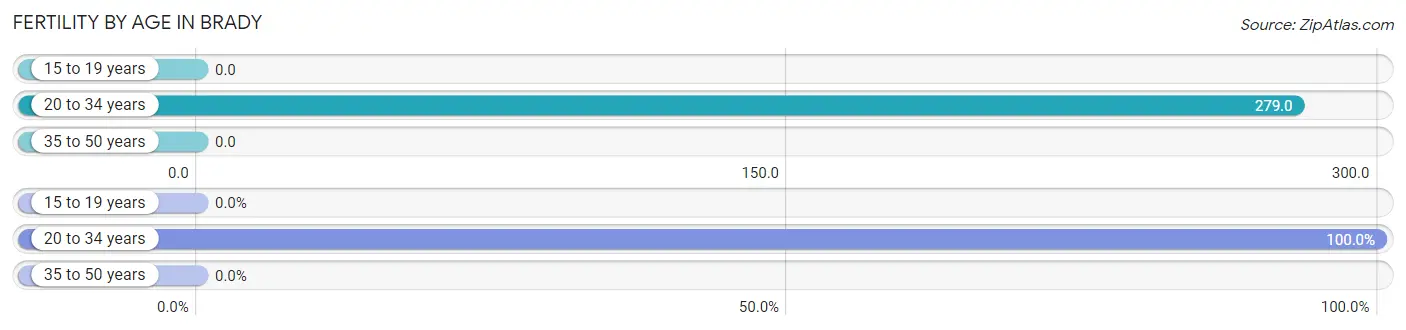
| Age Bracket | Women with Births | Births / 1,000 Women |
| 15 to 19 years | 0 (0.0%) | 0.0 |
| 20 to 34 years | 17 (100.0%) | 279.0 |
| 35 to 50 years | 0 (0.0%) | 0.0 |
| Total | 17 (100.0%) | 106.0 |
Fertility by Age by Marriage Status in Brady
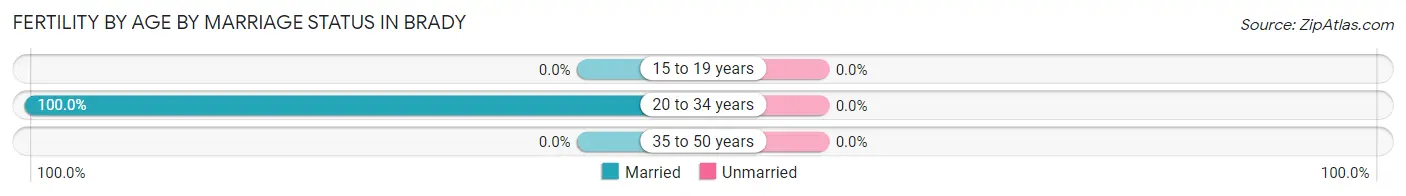
| Age Bracket | Married | Unmarried |
| 15 to 19 years | 0 (0.0%) | 0 (0.0%) |
| 20 to 34 years | 17 (100.0%) | 0 (0.0%) |
| 35 to 50 years | 0 (0.0%) | 0 (0.0%) |
| Total | 17 (100.0%) | 0 (0.0%) |
Fertility by Education in Brady
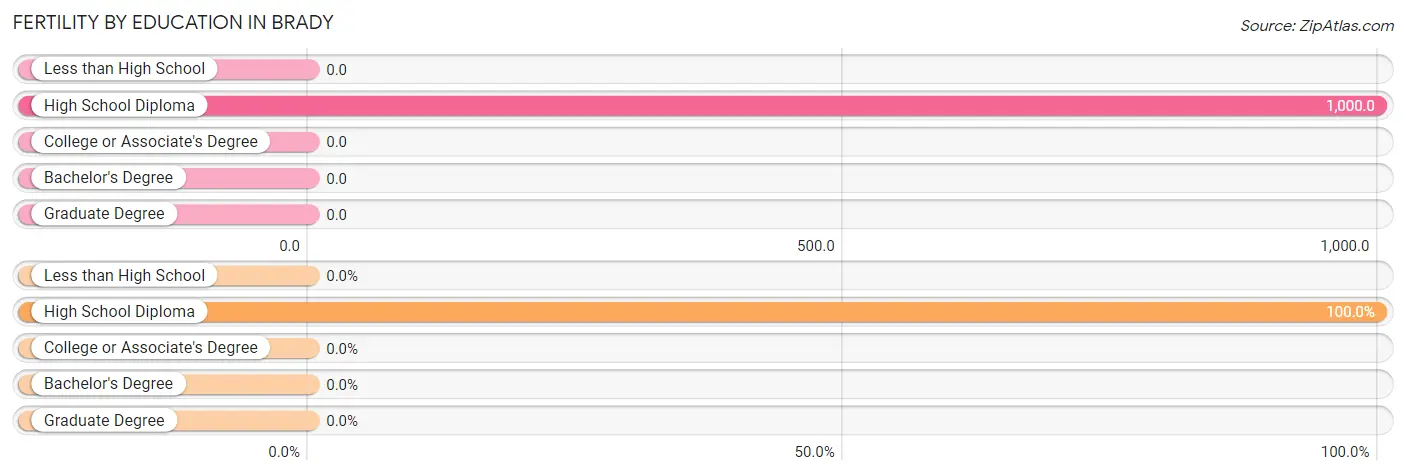
| Educational Attainment | Women with Births | Births / 1,000 Women |
| Less than High School | 0 (0.0%) | 0.0 |
| High School Diploma | 17 (100.0%) | 1,000.0 |
| College or Associate's Degree | 0 (0.0%) | 0.0 |
| Bachelor's Degree | 0 (0.0%) | 0.0 |
| Graduate Degree | 0 (0.0%) | 0.0 |
| Total | 17 (100.0%) | 106.0 |
Fertility by Education by Marriage Status in Brady
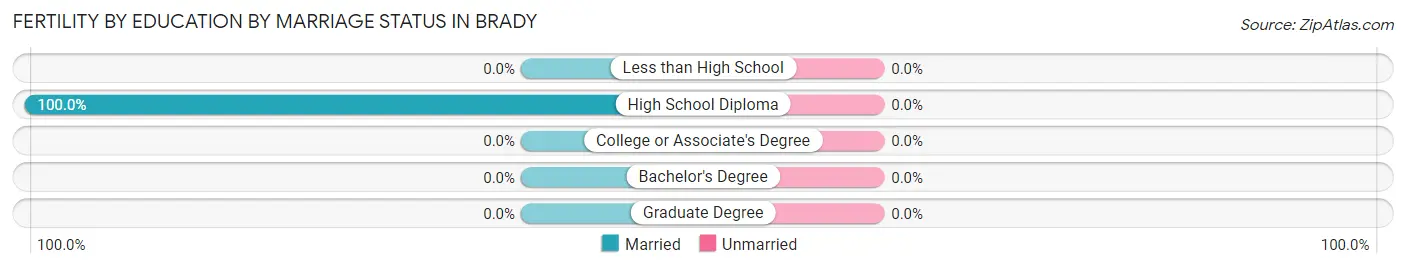
| Educational Attainment | Married | Unmarried |
| Less than High School | 0 (0.0%) | 0 (0.0%) |
| High School Diploma | 17 (100.0%) | 0 (0.0%) |
| College or Associate's Degree | 0 (0.0%) | 0 (0.0%) |
| Bachelor's Degree | 0 (0.0%) | 0 (0.0%) |
| Graduate Degree | 0 (0.0%) | 0 (0.0%) |
| Total | 17 (100.0%) | 0 (0.0%) |
Employment Characteristics in Brady
Employment by Class of Employer in Brady
Among the 266 employed individuals in Brady, state government employees (80 | 30.1%), federal government employees (67 | 25.2%), and self-employed (not incorporated) (45 | 16.9%) make up the most common classes of employment.
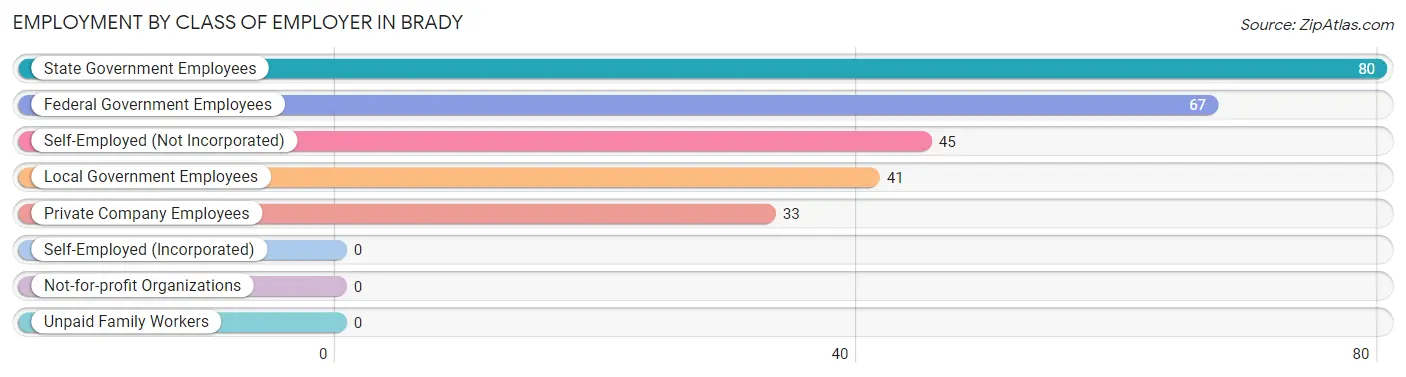
| Employer Class | # Employees | % Employees |
| Private Company Employees | 33 | 12.4% |
| Self-Employed (Incorporated) | 0 | 0.0% |
| Self-Employed (Not Incorporated) | 45 | 16.9% |
| Not-for-profit Organizations | 0 | 0.0% |
| Local Government Employees | 41 | 15.4% |
| State Government Employees | 80 | 30.1% |
| Federal Government Employees | 67 | 25.2% |
| Unpaid Family Workers | 0 | 0.0% |
| Total | 266 | 100.0% |
Employment Status by Age in Brady
According to the labor force statistics for Brady, out of the total population over 16 years of age (777), 35.4% or 275 individuals are in the labor force, with 3.3% or 9 of them unemployed. The age group with the highest labor force participation rate is 45 to 54 years, with 64.5% or 78 individuals in the labor force. Within the labor force, the 60 to 64 years age range has the highest percentage of unemployed individuals, with 45.0% or 9 of them being unemployed.
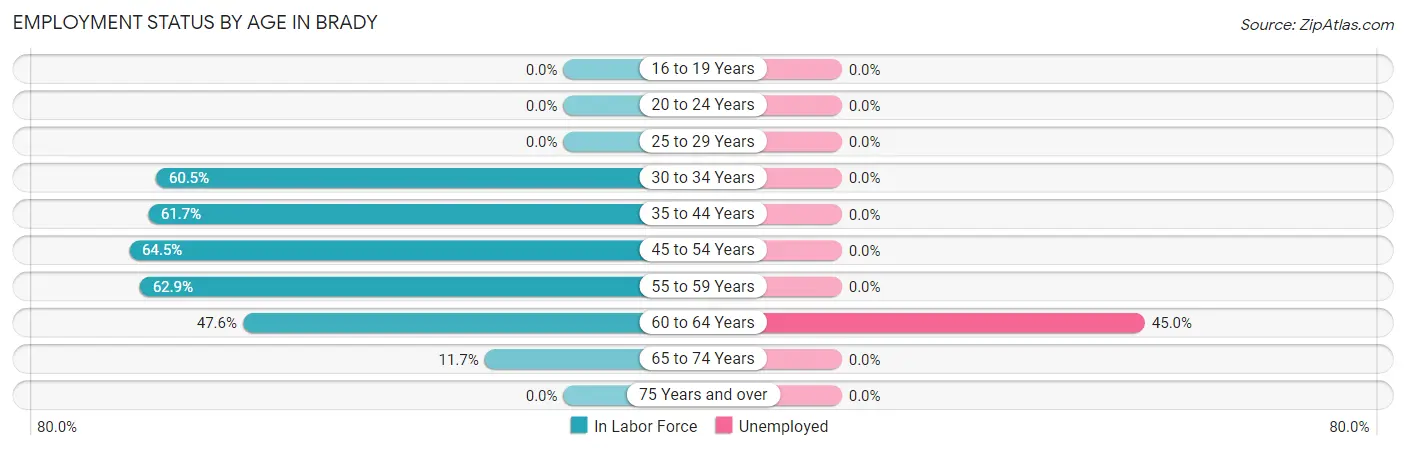
| Age Bracket | In Labor Force | Unemployed |
| 16 to 19 Years | 0 (0.0%) | 0 (0.0%) |
| 20 to 24 Years | 0 (0.0%) | 0 (0.0%) |
| 25 to 29 Years | 0 (0.0%) | 0 (0.0%) |
| 30 to 34 Years | 26 (60.5%) | 0 (0.0%) |
| 35 to 44 Years | 50 (61.7%) | 0 (0.0%) |
| 45 to 54 Years | 78 (64.5%) | 0 (0.0%) |
| 55 to 59 Years | 88 (62.9%) | 0 (0.0%) |
| 60 to 64 Years | 20 (47.6%) | 9 (45.0%) |
| 65 to 74 Years | 13 (11.7%) | 0 (0.0%) |
| 75 Years and over | 0 (0.0%) | 0 (0.0%) |
| Total | 275 (35.4%) | 9 (3.3%) |
Employment Status by Educational Attainment in Brady
According to labor force statistics for Brady, 61.4% of individuals (262) out of the total population between 25 and 64 years of age (427) are in the labor force, with 3.4% or 9 of them being unemployed. The group with the highest labor force participation rate are those with the educational attainment of college / associate degree, with 70.0% or 212 individuals in the labor force. Within the labor force, individuals with bachelor's degree or higher education have the highest percentage of unemployment, with 25.7% or 9 of them being unemployed.
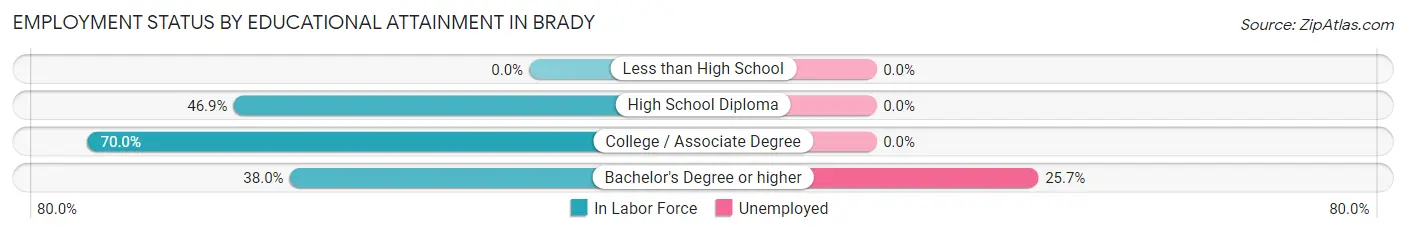
| Educational Attainment | In Labor Force | Unemployed |
| Less than High School | 0 (0.0%) | 0 (0.0%) |
| High School Diploma | 15 (46.9%) | 0 (0.0%) |
| College / Associate Degree | 212 (70.0%) | 0 (0.0%) |
| Bachelor's Degree or higher | 35 (38.0%) | 24 (25.7%) |
| Total | 262 (61.4%) | 15 (3.4%) |
Employment Occupations by Sex in Brady
Management, Business, Science and Arts Occupations
The most common Management, Business, Science and Arts occupations in Brady are Community & Social Service (73 | 27.4%), Education Instruction & Library (73 | 27.4%), Computers, Engineering & Science (11 | 4.1%), and Computers & Mathematics (11 | 4.1%).
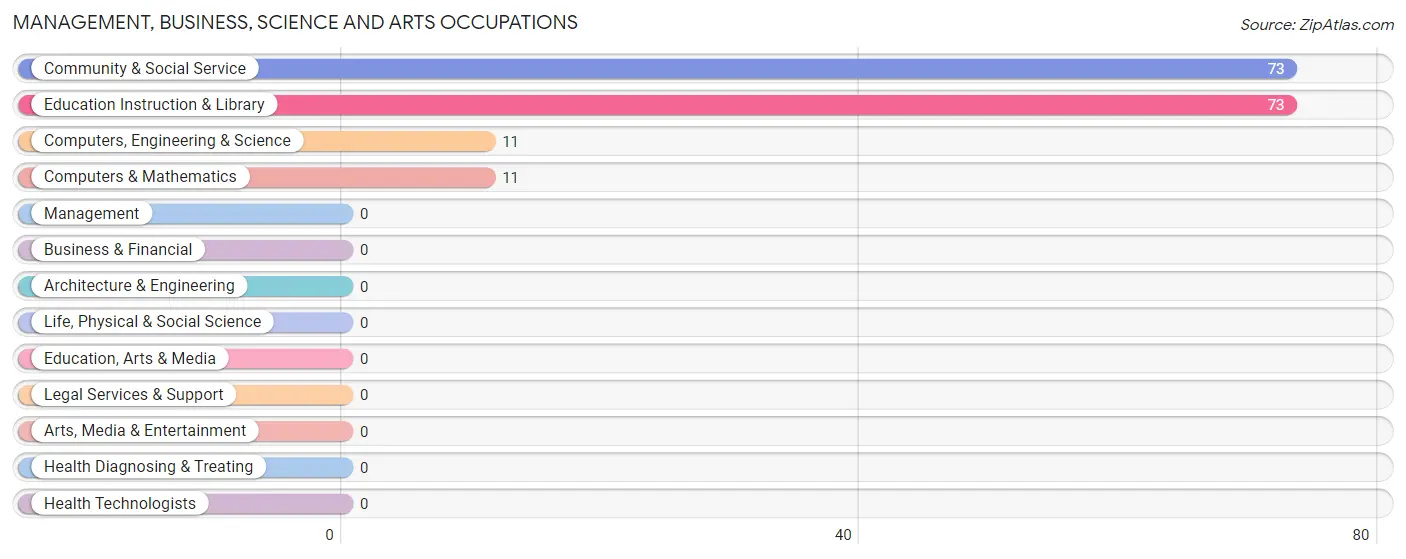
Management, Business, Science and Arts Occupations by Sex
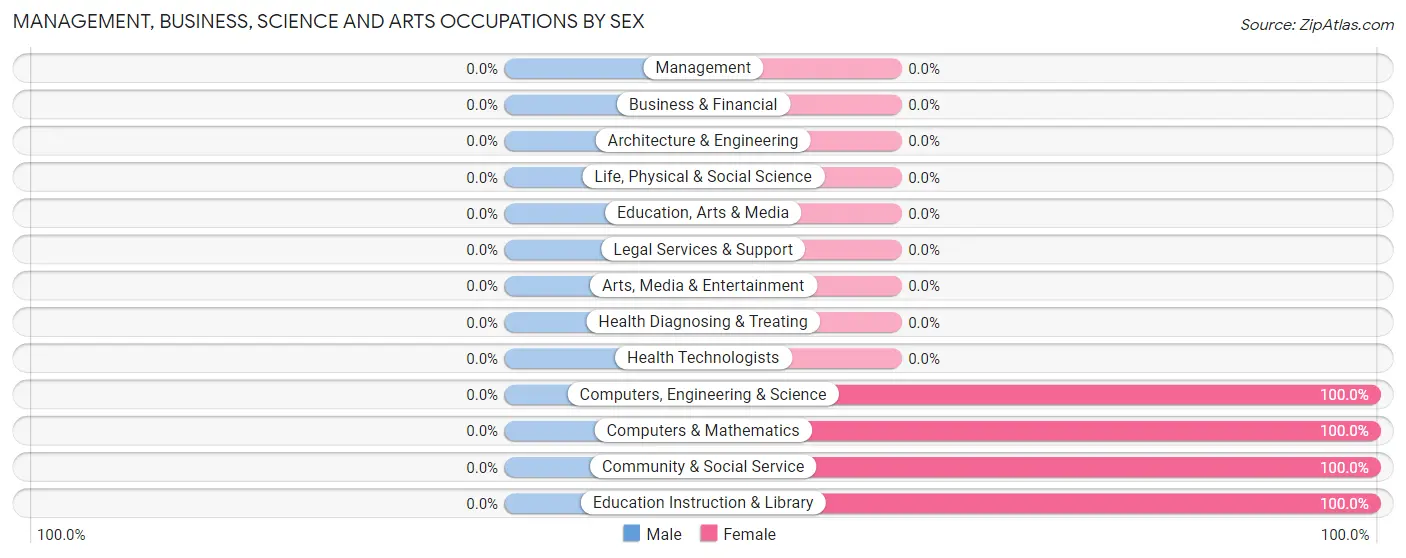
| Occupation | Male | Female |
| Management | 0 (0.0%) | 0 (0.0%) |
| Business & Financial | 0 (0.0%) | 0 (0.0%) |
| Computers, Engineering & Science | 0 (0.0%) | 11 (100.0%) |
| Computers & Mathematics | 0 (0.0%) | 11 (100.0%) |
| Architecture & Engineering | 0 (0.0%) | 0 (0.0%) |
| Life, Physical & Social Science | 0 (0.0%) | 0 (0.0%) |
| Community & Social Service | 0 (0.0%) | 73 (100.0%) |
| Education, Arts & Media | 0 (0.0%) | 0 (0.0%) |
| Legal Services & Support | 0 (0.0%) | 0 (0.0%) |
| Education Instruction & Library | 0 (0.0%) | 73 (100.0%) |
| Arts, Media & Entertainment | 0 (0.0%) | 0 (0.0%) |
| Health Diagnosing & Treating | 0 (0.0%) | 0 (0.0%) |
| Health Technologists | 0 (0.0%) | 0 (0.0%) |
| Total (Category) | 0 (0.0%) | 84 (100.0%) |
| Total (Overall) | 131 (49.2%) | 135 (50.7%) |
Services Occupations
The most common Services occupations in Brady are , and Food Preparation & Serving (15 | 5.6%).
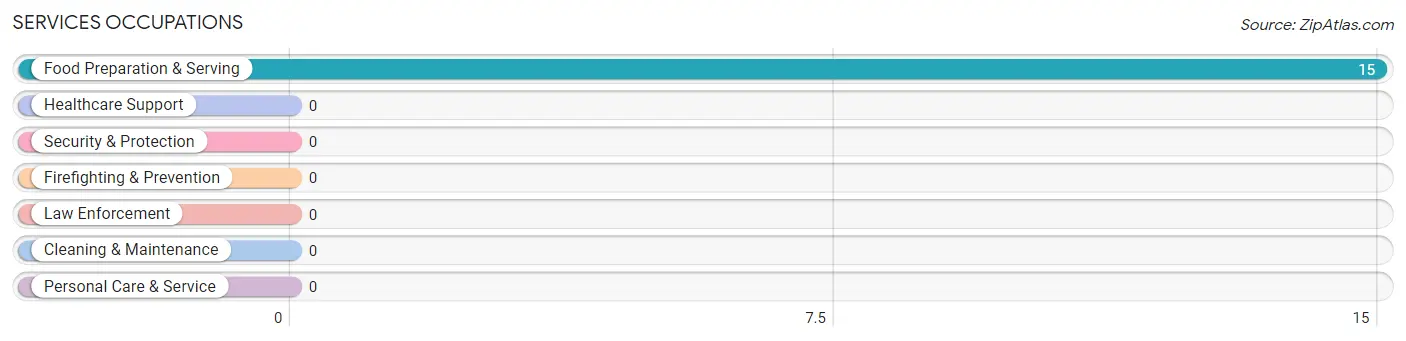
Services Occupations by Sex
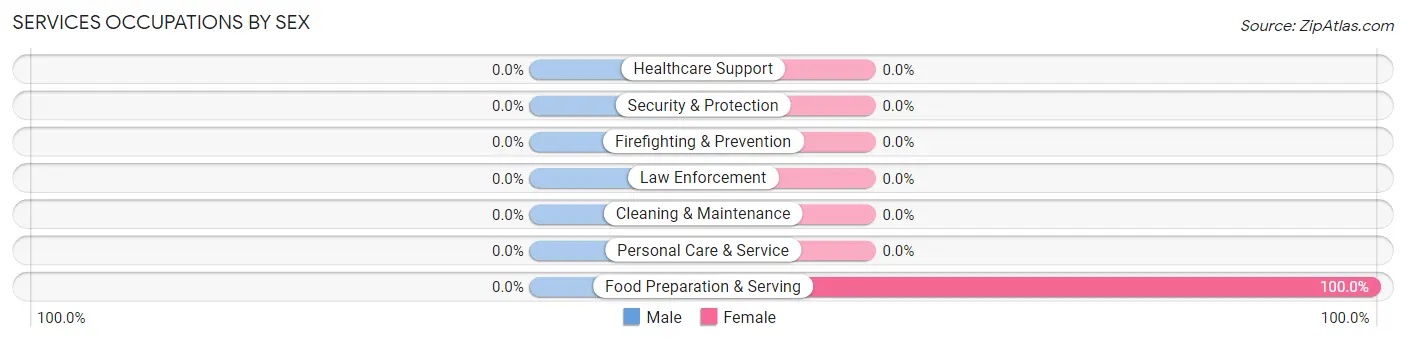
| Occupation | Male | Female |
| Healthcare Support | 0 (0.0%) | 0 (0.0%) |
| Security & Protection | 0 (0.0%) | 0 (0.0%) |
| Firefighting & Prevention | 0 (0.0%) | 0 (0.0%) |
| Law Enforcement | 0 (0.0%) | 0 (0.0%) |
| Food Preparation & Serving | 0 (0.0%) | 15 (100.0%) |
| Cleaning & Maintenance | 0 (0.0%) | 0 (0.0%) |
| Personal Care & Service | 0 (0.0%) | 0 (0.0%) |
| Total (Category) | 0 (0.0%) | 15 (100.0%) |
| Total (Overall) | 131 (49.2%) | 135 (50.7%) |
Sales and Office Occupations
The most common Sales and Office occupations in Brady are Office & Administration (26 | 9.8%), and Sales & Related (23 | 8.6%).
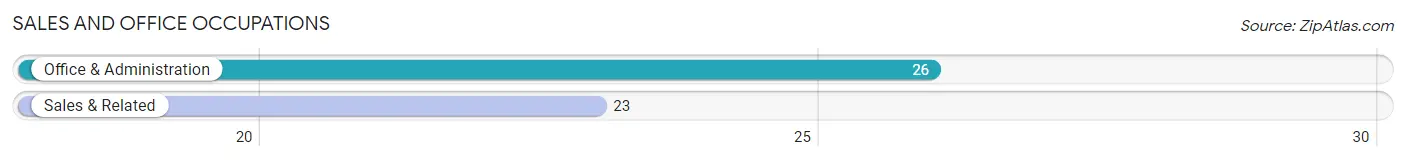
Sales and Office Occupations by Sex
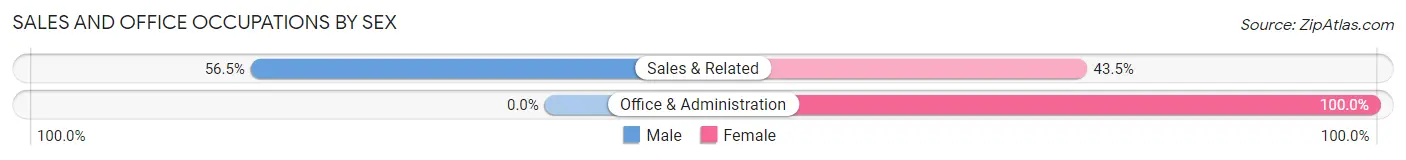
| Occupation | Male | Female |
| Sales & Related | 13 (56.5%) | 10 (43.5%) |
| Office & Administration | 0 (0.0%) | 26 (100.0%) |
| Total (Category) | 13 (26.5%) | 36 (73.5%) |
| Total (Overall) | 131 (49.2%) | 135 (50.7%) |
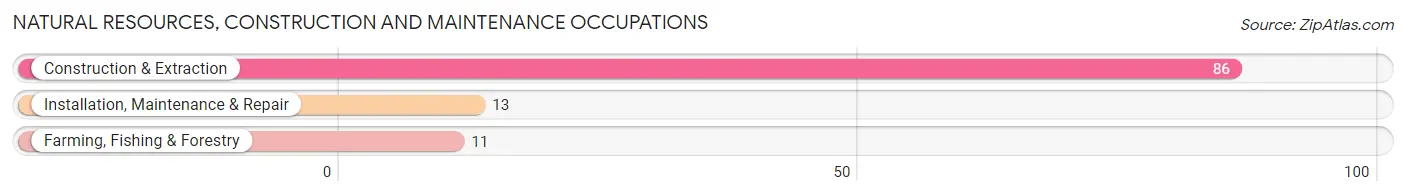
Natural Resources, Construction and Maintenance Occupations
The most common Natural Resources, Construction and Maintenance occupations in Brady are Construction & Extraction (86 | 32.3%), Installation, Maintenance & Repair (13 | 4.9%), and Farming, Fishing & Forestry (11 | 4.1%).
Natural Resources, Construction and Maintenance Occupations by Sex
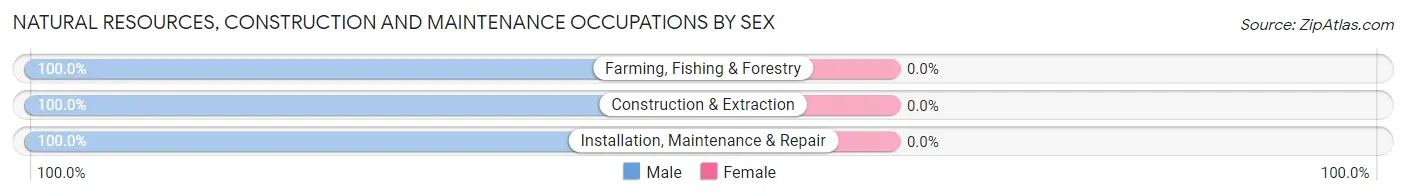
| Occupation | Male | Female |
| Farming, Fishing & Forestry | 11 (100.0%) | 0 (0.0%) |
| Construction & Extraction | 86 (100.0%) | 0 (0.0%) |
| Installation, Maintenance & Repair | 13 (100.0%) | 0 (0.0%) |
| Total (Category) | 110 (100.0%) | 0 (0.0%) |
| Total (Overall) | 131 (49.2%) | 135 (50.7%) |
Production, Transportation and Moving Occupations
The most common Production, Transportation and Moving occupations in Brady are , and Transportation (8 | 3.0%).
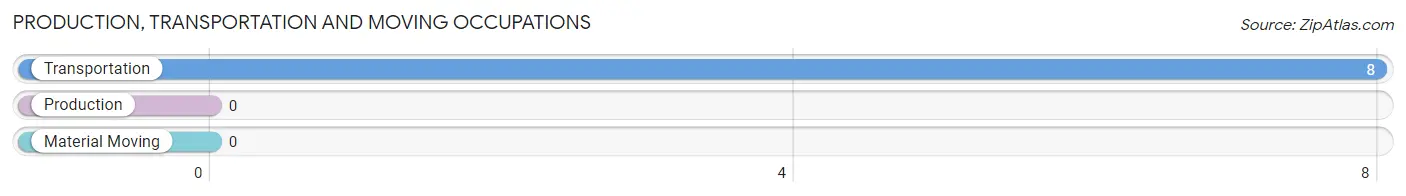
Production, Transportation and Moving Occupations by Sex
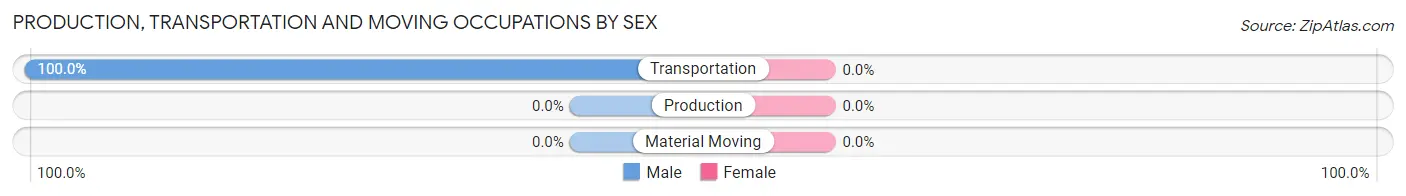
| Occupation | Male | Female |
| Production | 0 (0.0%) | 0 (0.0%) |
| Transportation | 8 (100.0%) | 0 (0.0%) |
| Material Moving | 0 (0.0%) | 0 (0.0%) |
| Total (Category) | 8 (100.0%) | 0 (0.0%) |
| Total (Overall) | 131 (49.2%) | 135 (50.7%) |
Employment Industries by Sex in Brady
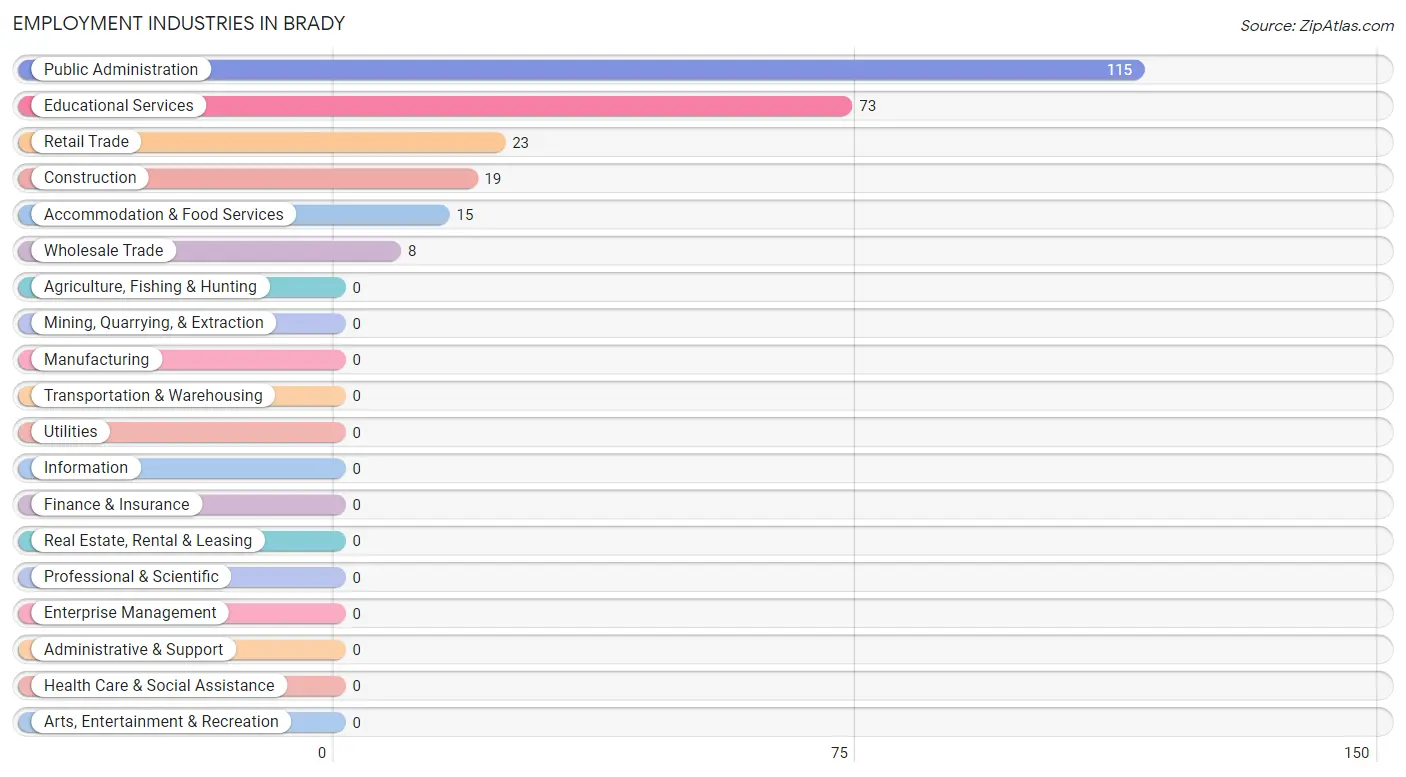
Employment Industries in Brady
The major employment industries in Brady include Public Administration (115 | 43.2%), Educational Services (73 | 27.4%), Retail Trade (23 | 8.6%), Construction (19 | 7.1%), and Accommodation & Food Services (15 | 5.6%).
Employment Industries by Sex in Brady
The Brady industries that see more men than women are Construction (100.0%), Wholesale Trade (100.0%), and Public Administration (67.8%), whereas the industries that tend to have a higher number of women are Educational Services (100.0%), Accommodation & Food Services (100.0%), and Retail Trade (43.5%).
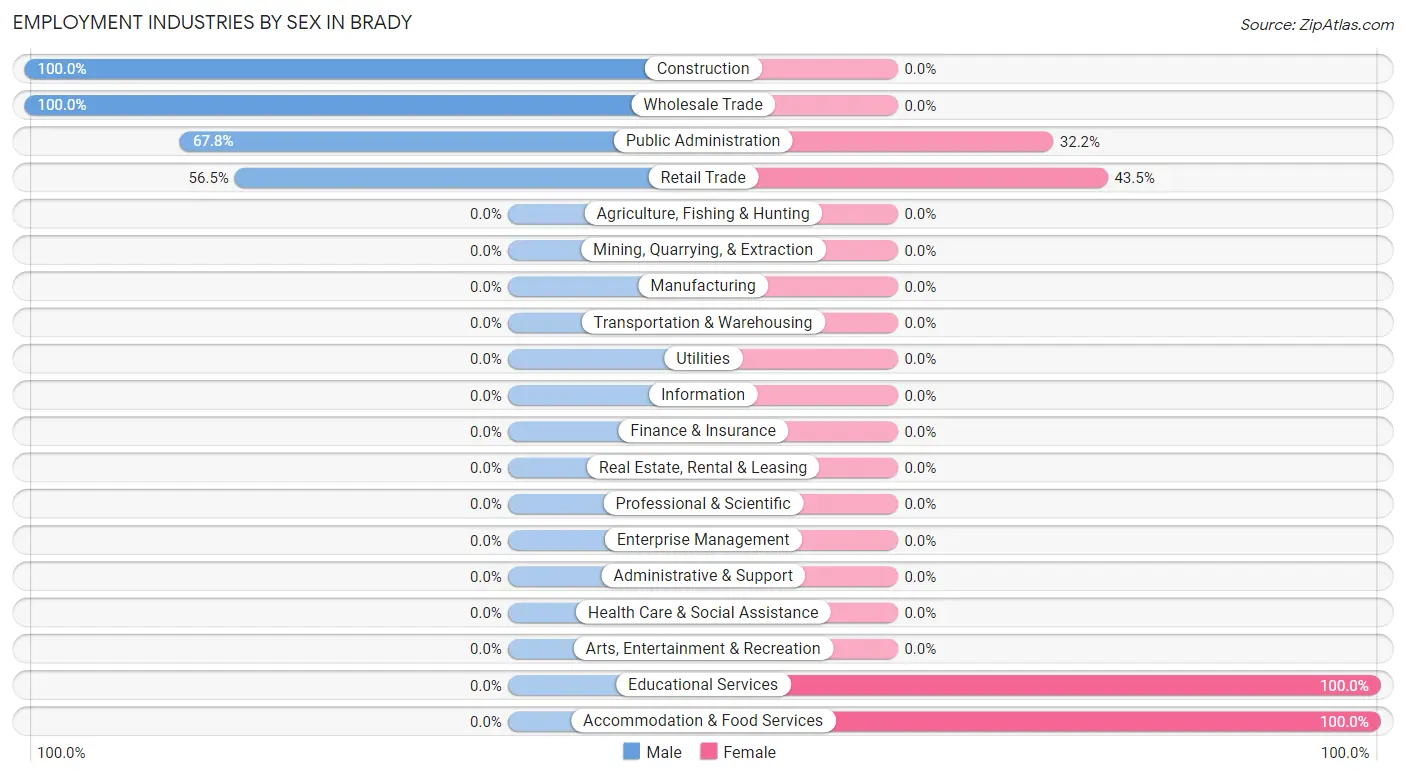
| Industry | Male | Female |
| Agriculture, Fishing & Hunting | 0 (0.0%) | 0 (0.0%) |
| Mining, Quarrying, & Extraction | 0 (0.0%) | 0 (0.0%) |
| Construction | 19 (100.0%) | 0 (0.0%) |
| Manufacturing | 0 (0.0%) | 0 (0.0%) |
| Wholesale Trade | 8 (100.0%) | 0 (0.0%) |
| Retail Trade | 13 (56.5%) | 10 (43.5%) |
| Transportation & Warehousing | 0 (0.0%) | 0 (0.0%) |
| Utilities | 0 (0.0%) | 0 (0.0%) |
| Information | 0 (0.0%) | 0 (0.0%) |
| Finance & Insurance | 0 (0.0%) | 0 (0.0%) |
| Real Estate, Rental & Leasing | 0 (0.0%) | 0 (0.0%) |
| Professional & Scientific | 0 (0.0%) | 0 (0.0%) |
| Enterprise Management | 0 (0.0%) | 0 (0.0%) |
| Administrative & Support | 0 (0.0%) | 0 (0.0%) |
| Educational Services | 0 (0.0%) | 73 (100.0%) |
| Health Care & Social Assistance | 0 (0.0%) | 0 (0.0%) |
| Arts, Entertainment & Recreation | 0 (0.0%) | 0 (0.0%) |
| Accommodation & Food Services | 0 (0.0%) | 15 (100.0%) |
| Public Administration | 78 (67.8%) | 37 (32.2%) |
| Total | 131 (49.2%) | 135 (50.7%) |
Education in Brady
School Enrollment in Brady
The most common levels of schooling among the 223 students in Brady are high school (126 | 56.5%), middle school (59 | 26.5%), and elementary school (38 | 17.0%).
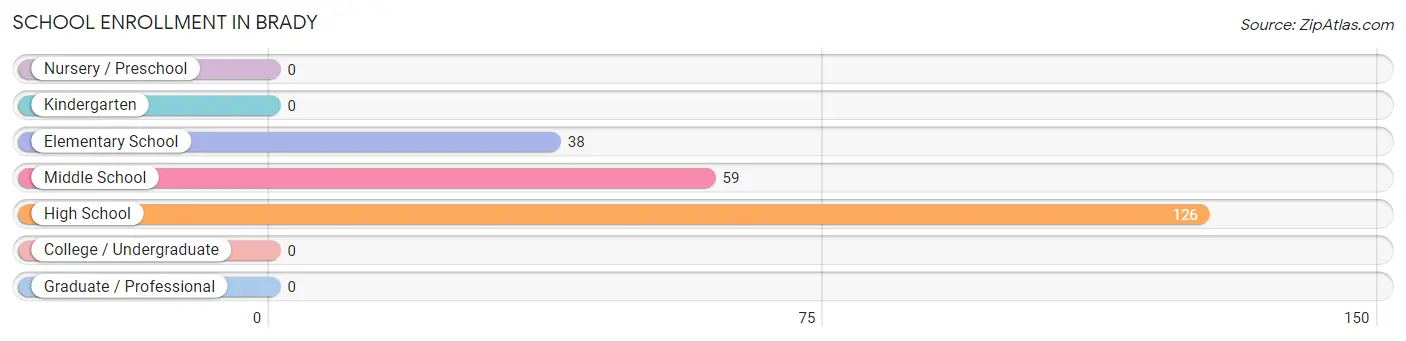
| School Level | # Students | % Students |
| Nursery / Preschool | 0 | 0.0% |
| Kindergarten | 0 | 0.0% |
| Elementary School | 38 | 17.0% |
| Middle School | 59 | 26.5% |
| High School | 126 | 56.5% |
| College / Undergraduate | 0 | 0.0% |
| Graduate / Professional | 0 | 0.0% |
| Total | 223 | 100.0% |
School Enrollment by Age by Funding Source in Brady
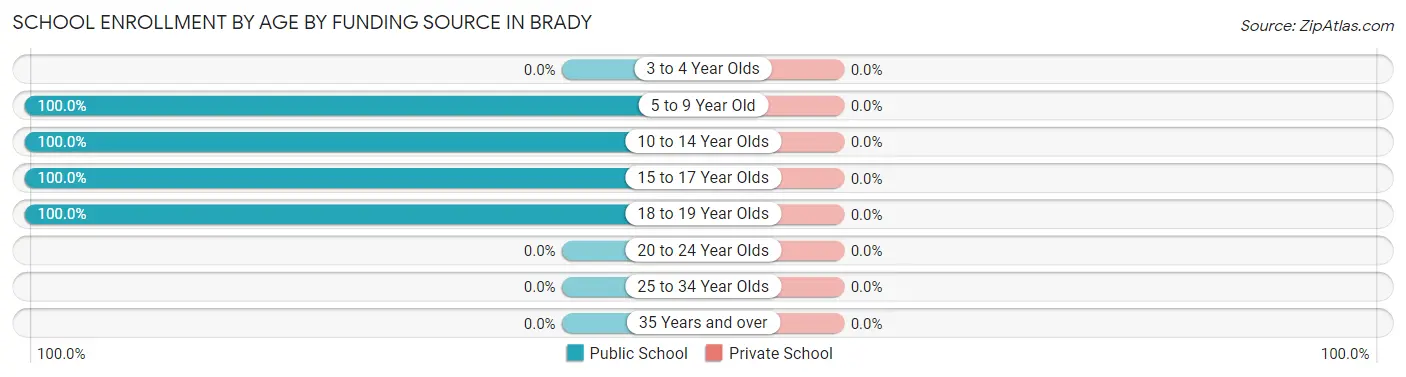
| Age Bracket | Public School | Private School |
| 3 to 4 Year Olds | 0 (0.0%) | 0 (0.0%) |
| 5 to 9 Year Old | 50 (100.0%) | 0 (0.0%) |
| 10 to 14 Year Olds | 47 (100.0%) | 0 (0.0%) |
| 15 to 17 Year Olds | 35 (100.0%) | 0 (0.0%) |
| 18 to 19 Year Olds | 91 (100.0%) | 0 (0.0%) |
| 20 to 24 Year Olds | 0 (0.0%) | 0 (0.0%) |
| 25 to 34 Year Olds | 0 (0.0%) | 0 (0.0%) |
| 35 Years and over | 0 (0.0%) | 0 (0.0%) |
| Total | 223 (100.0%) | 0 (0.0%) |
Educational Attainment by Field of Study in Brady
Education (58 | 48.3%), liberal arts & history (28 | 23.3%), business (14 | 11.7%), science & technology (11 | 9.2%), and bio, nature & agricultural (9 | 7.5%) are the most common fields of study among 120 individuals in Brady who have obtained a bachelor's degree or higher.
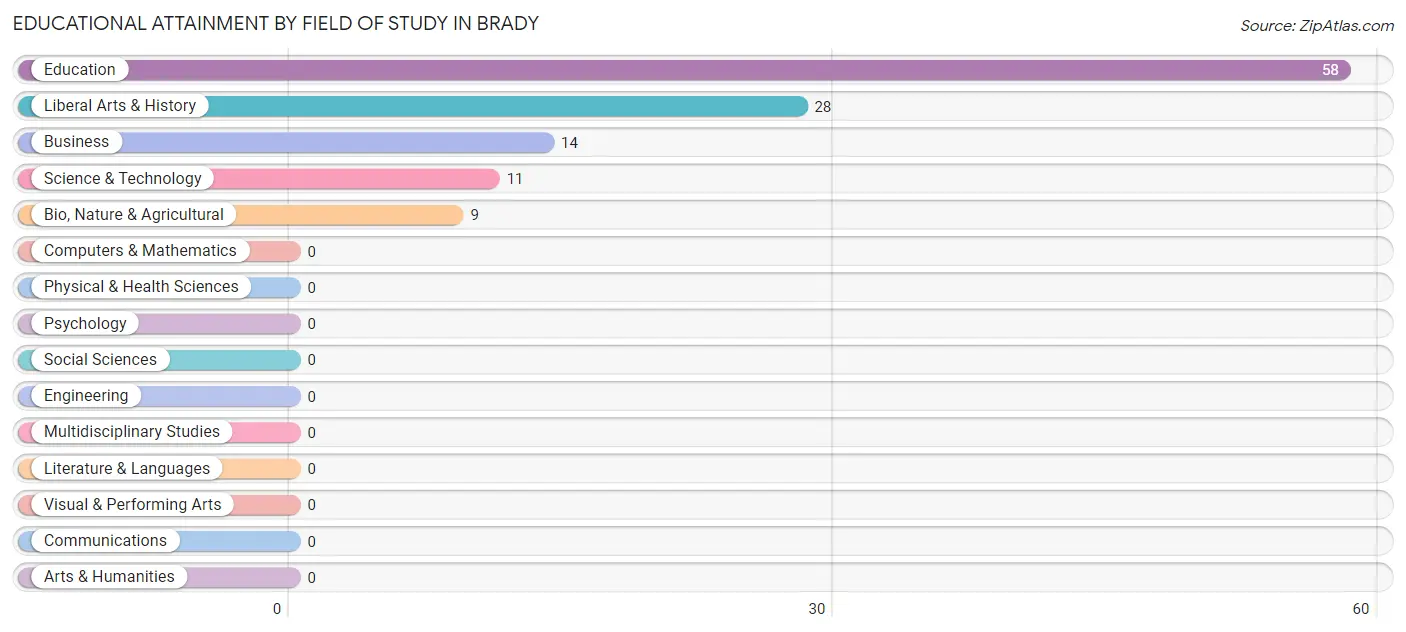
| Field of Study | # Graduates | % Graduates |
| Computers & Mathematics | 0 | 0.0% |
| Bio, Nature & Agricultural | 9 | 7.5% |
| Physical & Health Sciences | 0 | 0.0% |
| Psychology | 0 | 0.0% |
| Social Sciences | 0 | 0.0% |
| Engineering | 0 | 0.0% |
| Multidisciplinary Studies | 0 | 0.0% |
| Science & Technology | 11 | 9.2% |
| Business | 14 | 11.7% |
| Education | 58 | 48.3% |
| Literature & Languages | 0 | 0.0% |
| Liberal Arts & History | 28 | 23.3% |
| Visual & Performing Arts | 0 | 0.0% |
| Communications | 0 | 0.0% |
| Arts & Humanities | 0 | 0.0% |
| Total | 120 | 100.0% |
Transportation & Commute in Brady
Vehicle Availability by Sex in Brady
The most prevalent vehicle ownership categories in Brady are males with 3 vehicles (67, accounting for 51.1%) and females with 3 vehicles (58, making up 49.6%).
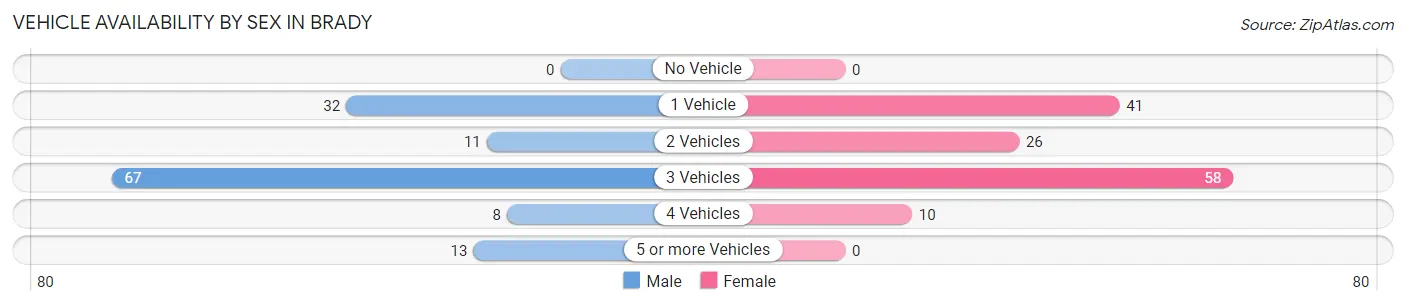
| Vehicles Available | Male | Female |
| No Vehicle | 0 (0.0%) | 0 (0.0%) |
| 1 Vehicle | 32 (24.4%) | 41 (30.4%) |
| 2 Vehicles | 11 (8.4%) | 26 (19.3%) |
| 3 Vehicles | 67 (51.1%) | 58 (43.0%) |
| 4 Vehicles | 8 (6.1%) | 10 (7.4%) |
| 5 or more Vehicles | 13 (9.9%) | 0 (0.0%) |
| Total | 131 (100.0%) | 135 (100.0%) |
Commute Time in Brady
The most frequently occuring commute durations in Brady are 5 to 9 minutes (112 commuters, 42.1%), 35 to 39 minutes (67 commuters, 25.2%), and 10 to 14 minutes (46 commuters, 17.3%).
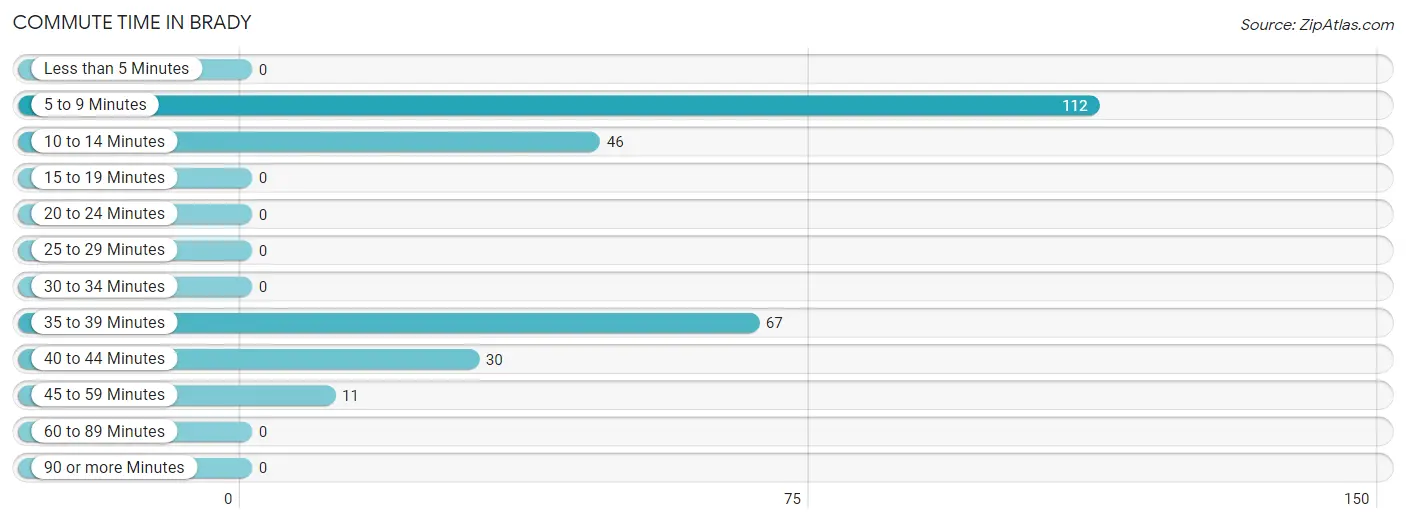
| Commute Time | # Commuters | % Commuters |
| Less than 5 Minutes | 0 | 0.0% |
| 5 to 9 Minutes | 112 | 42.1% |
| 10 to 14 Minutes | 46 | 17.3% |
| 15 to 19 Minutes | 0 | 0.0% |
| 20 to 24 Minutes | 0 | 0.0% |
| 25 to 29 Minutes | 0 | 0.0% |
| 30 to 34 Minutes | 0 | 0.0% |
| 35 to 39 Minutes | 67 | 25.2% |
| 40 to 44 Minutes | 30 | 11.3% |
| 45 to 59 Minutes | 11 | 4.1% |
| 60 to 89 Minutes | 0 | 0.0% |
| 90 or more Minutes | 0 | 0.0% |
Commute Time by Sex in Brady
The most common commute times in Brady are 35 to 39 minutes (67 commuters, 51.1%) for males and 5 to 9 minutes (99 commuters, 73.3%) for females.
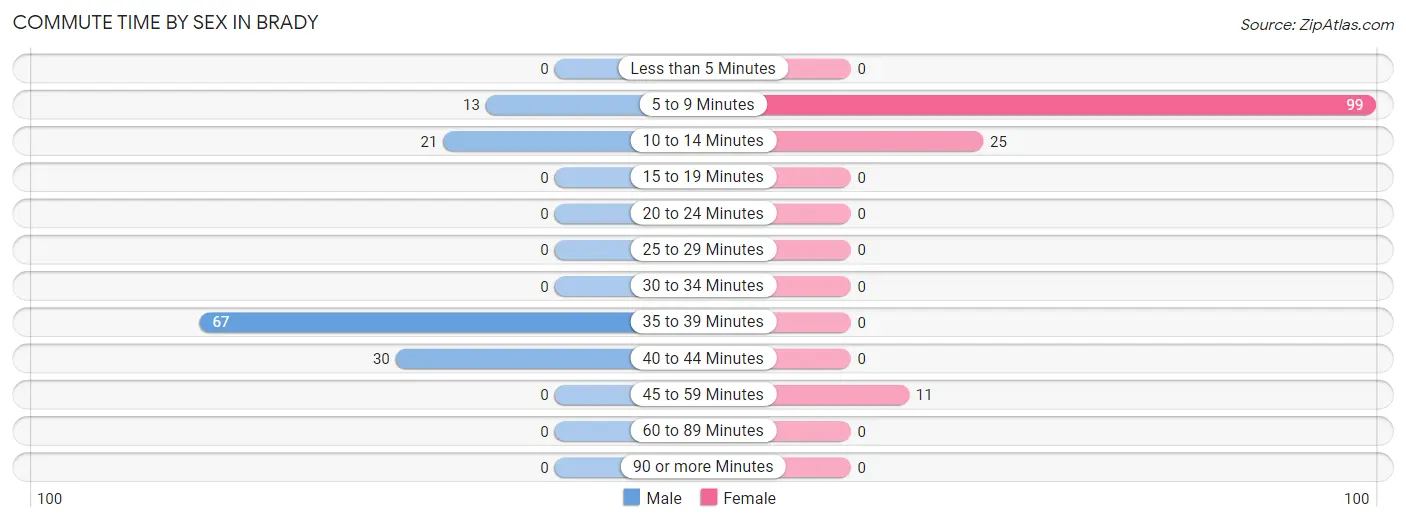
| Commute Time | Male | Female |
| Less than 5 Minutes | 0 (0.0%) | 0 (0.0%) |
| 5 to 9 Minutes | 13 (9.9%) | 99 (73.3%) |
| 10 to 14 Minutes | 21 (16.0%) | 25 (18.5%) |
| 15 to 19 Minutes | 0 (0.0%) | 0 (0.0%) |
| 20 to 24 Minutes | 0 (0.0%) | 0 (0.0%) |
| 25 to 29 Minutes | 0 (0.0%) | 0 (0.0%) |
| 30 to 34 Minutes | 0 (0.0%) | 0 (0.0%) |
| 35 to 39 Minutes | 67 (51.1%) | 0 (0.0%) |
| 40 to 44 Minutes | 30 (22.9%) | 0 (0.0%) |
| 45 to 59 Minutes | 0 (0.0%) | 11 (8.2%) |
| 60 to 89 Minutes | 0 (0.0%) | 0 (0.0%) |
| 90 or more Minutes | 0 (0.0%) | 0 (0.0%) |
Time of Departure to Work by Sex in Brady
The most frequent times of departure to work in Brady are 5:00 AM to 5:29 AM (75, 57.3%) for males and 7:00 AM to 7:29 AM (58, 43.0%) for females.
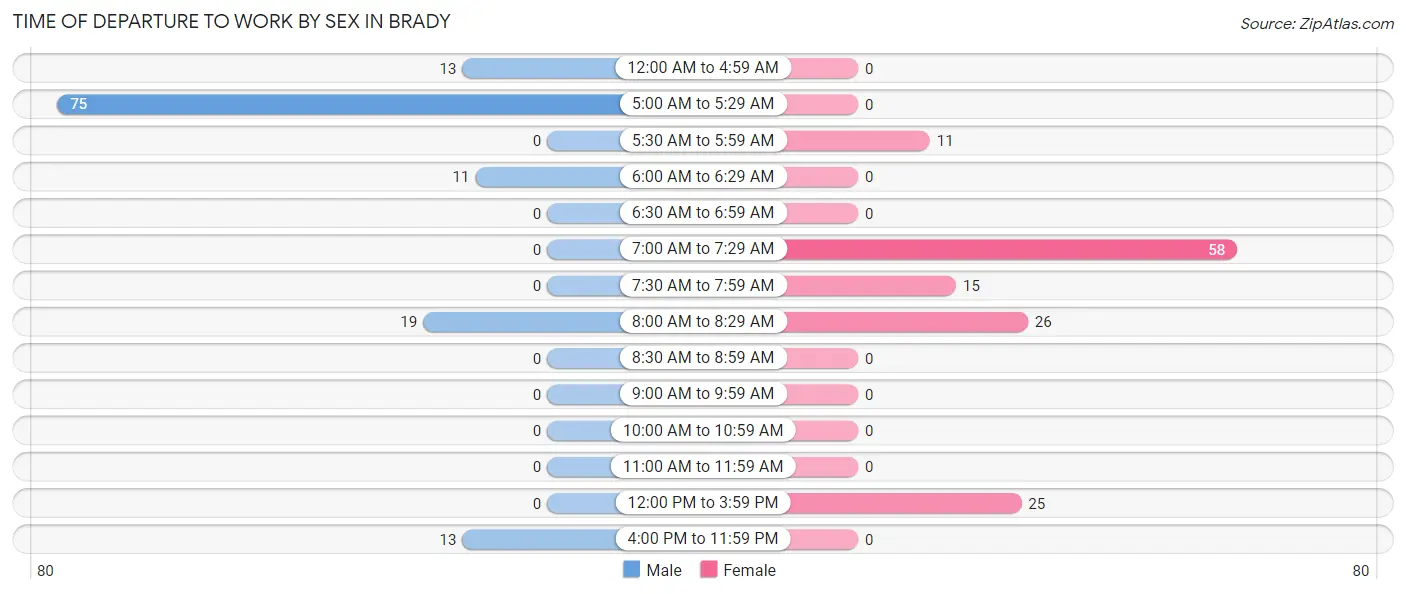
| Time of Departure | Male | Female |
| 12:00 AM to 4:59 AM | 13 (9.9%) | 0 (0.0%) |
| 5:00 AM to 5:29 AM | 75 (57.3%) | 0 (0.0%) |
| 5:30 AM to 5:59 AM | 0 (0.0%) | 11 (8.2%) |
| 6:00 AM to 6:29 AM | 11 (8.4%) | 0 (0.0%) |
| 6:30 AM to 6:59 AM | 0 (0.0%) | 0 (0.0%) |
| 7:00 AM to 7:29 AM | 0 (0.0%) | 58 (43.0%) |
| 7:30 AM to 7:59 AM | 0 (0.0%) | 15 (11.1%) |
| 8:00 AM to 8:29 AM | 19 (14.5%) | 26 (19.3%) |
| 8:30 AM to 8:59 AM | 0 (0.0%) | 0 (0.0%) |
| 9:00 AM to 9:59 AM | 0 (0.0%) | 0 (0.0%) |
| 10:00 AM to 10:59 AM | 0 (0.0%) | 0 (0.0%) |
| 11:00 AM to 11:59 AM | 0 (0.0%) | 0 (0.0%) |
| 12:00 PM to 3:59 PM | 0 (0.0%) | 25 (18.5%) |
| 4:00 PM to 11:59 PM | 13 (9.9%) | 0 (0.0%) |
| Total | 131 (100.0%) | 135 (100.0%) |
Housing Occupancy in Brady
Occupancy by Ownership in Brady
Of the total 336 dwellings in Brady, owner-occupied units account for 336 (100.0%), while renter-occupied units make up 0 (0.0%).
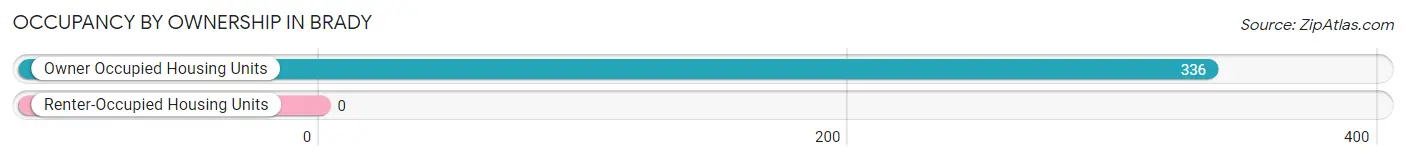
| Occupancy | # Housing Units | % Housing Units |
| Owner Occupied Housing Units | 336 | 100.0% |
| Renter-Occupied Housing Units | 0 | 0.0% |
| Total Occupied Housing Units | 336 | 100.0% |
Occupancy by Household Size in Brady
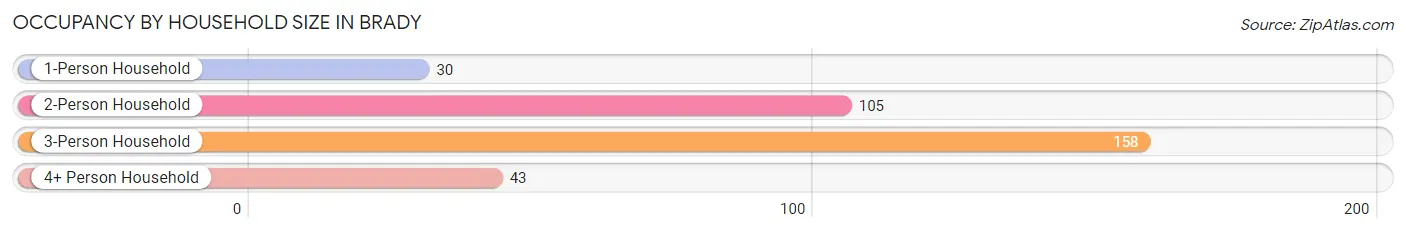
| Household Size | # Housing Units | % Housing Units |
| 1-Person Household | 30 | 8.9% |
| 2-Person Household | 105 | 31.2% |
| 3-Person Household | 158 | 47.0% |
| 4+ Person Household | 43 | 12.8% |
| Total Housing Units | 336 | 100.0% |
Occupancy by Ownership by Household Size in Brady
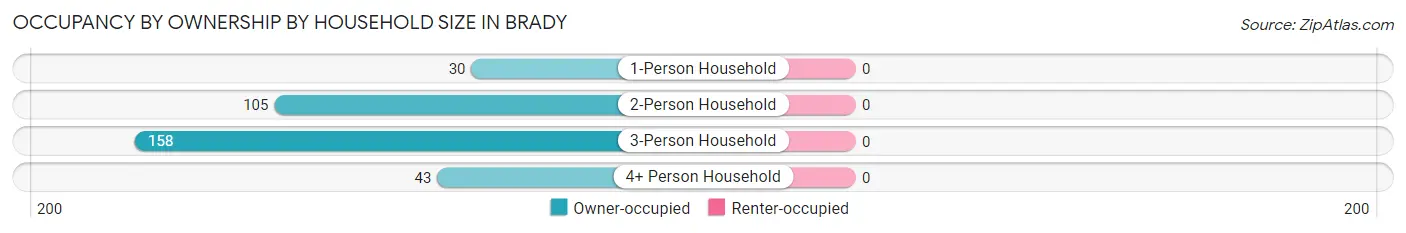
| Household Size | Owner-occupied | Renter-occupied |
| 1-Person Household | 30 (100.0%) | 0 (0.0%) |
| 2-Person Household | 105 (100.0%) | 0 (0.0%) |
| 3-Person Household | 158 (100.0%) | 0 (0.0%) |
| 4+ Person Household | 43 (100.0%) | 0 (0.0%) |
| Total Housing Units | 336 (100.0%) | 0 (0.0%) |
Occupancy by Educational Attainment in Brady
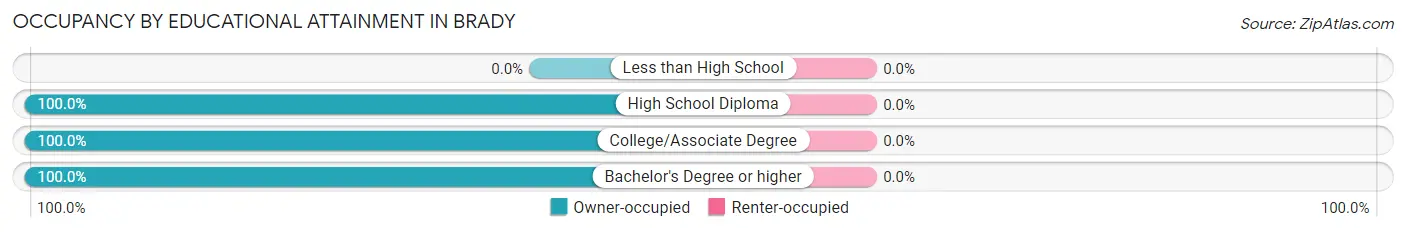
| Household Size | Owner-occupied | Renter-occupied |
| Less than High School | 0 (0.0%) | 0 (0.0%) |
| High School Diploma | 56 (100.0%) | 0 (0.0%) |
| College/Associate Degree | 256 (100.0%) | 0 (0.0%) |
| Bachelor's Degree or higher | 24 (100.0%) | 0 (0.0%) |
Occupancy by Age of Householder in Brady
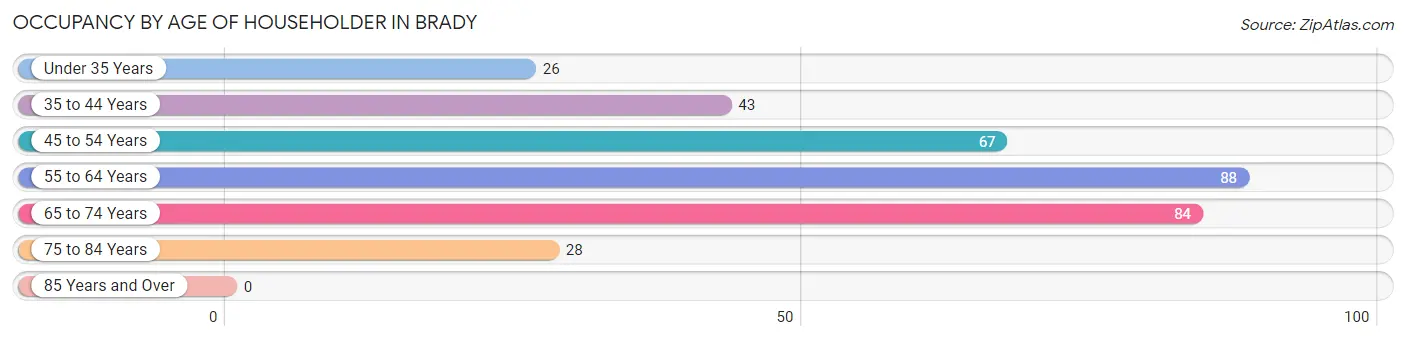
| Age Bracket | # Households | % Households |
| Under 35 Years | 26 | 7.7% |
| 35 to 44 Years | 43 | 12.8% |
| 45 to 54 Years | 67 | 19.9% |
| 55 to 64 Years | 88 | 26.2% |
| 65 to 74 Years | 84 | 25.0% |
| 75 to 84 Years | 28 | 8.3% |
| 85 Years and Over | 0 | 0.0% |
| Total | 336 | 100.0% |
Housing Finances in Brady
Median Income by Occupancy in Brady
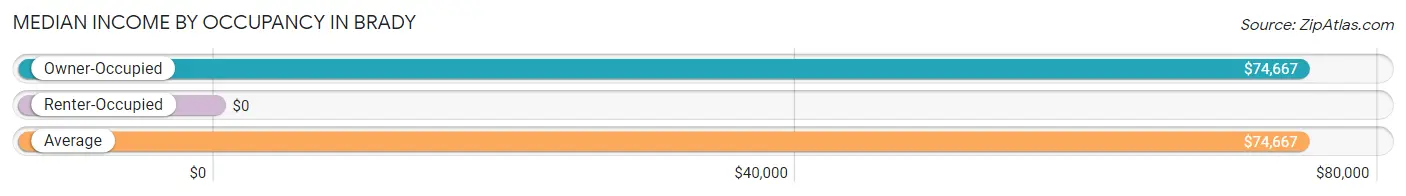
| Occupancy Type | # Households | Median Income |
| Owner-Occupied | 336 (100.0%) | $74,667 |
| Renter-Occupied | 0 (0.0%) | $0 |
| Average | 336 (100.0%) | $74,667 |
Occupancy by Householder Income Bracket in Brady
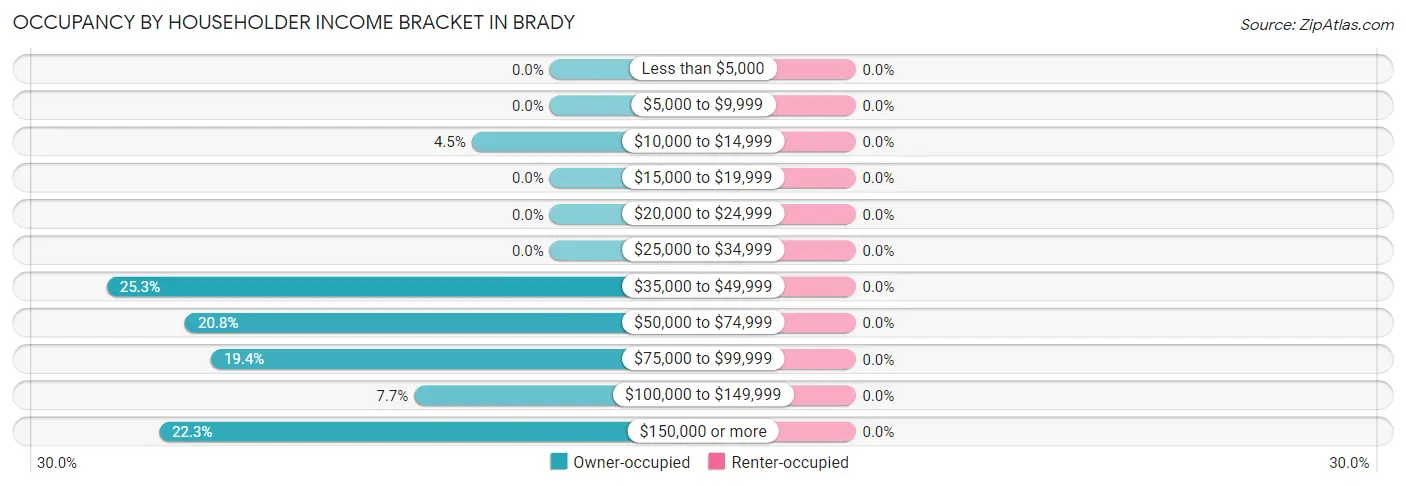
| Income Bracket | Owner-occupied | Renter-occupied |
| Less than $5,000 | 0 (0.0%) | 0 (0.0%) |
| $5,000 to $9,999 | 0 (0.0%) | 0 (0.0%) |
| $10,000 to $14,999 | 15 (4.5%) | 0 (0.0%) |
| $15,000 to $19,999 | 0 (0.0%) | 0 (0.0%) |
| $20,000 to $24,999 | 0 (0.0%) | 0 (0.0%) |
| $25,000 to $34,999 | 0 (0.0%) | 0 (0.0%) |
| $35,000 to $49,999 | 85 (25.3%) | 0 (0.0%) |
| $50,000 to $74,999 | 70 (20.8%) | 0 (0.0%) |
| $75,000 to $99,999 | 65 (19.4%) | 0 (0.0%) |
| $100,000 to $149,999 | 26 (7.7%) | 0 (0.0%) |
| $150,000 or more | 75 (22.3%) | 0 (0.0%) |
| Total | 336 (100.0%) | 0 (0.0%) |
Monthly Housing Cost Tiers in Brady
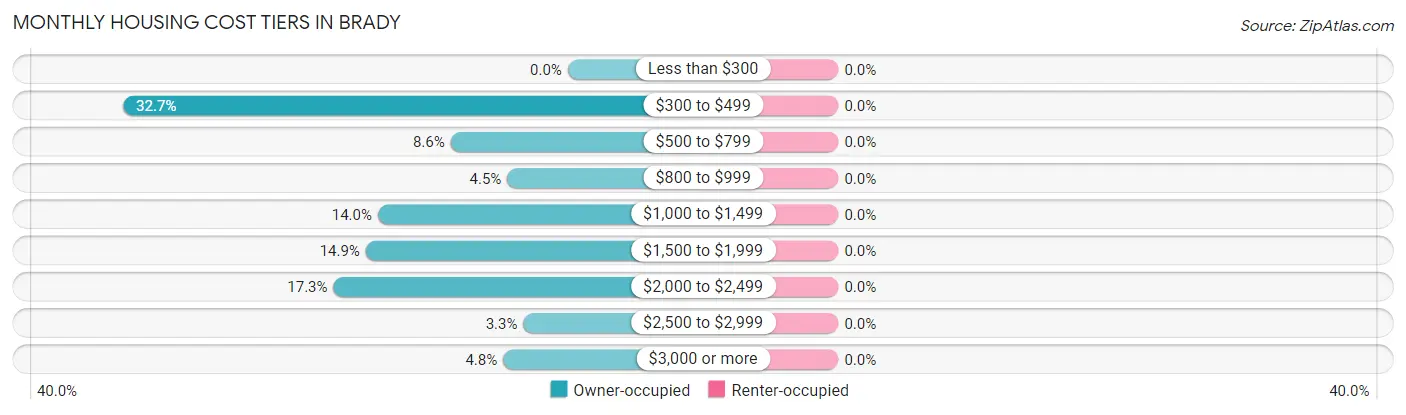
| Monthly Cost | Owner-occupied | Renter-occupied |
| Less than $300 | 0 (0.0%) | 0 (0.0%) |
| $300 to $499 | 110 (32.7%) | 0 (0.0%) |
| $500 to $799 | 29 (8.6%) | 0 (0.0%) |
| $800 to $999 | 15 (4.5%) | 0 (0.0%) |
| $1,000 to $1,499 | 47 (14.0%) | 0 (0.0%) |
| $1,500 to $1,999 | 50 (14.9%) | 0 (0.0%) |
| $2,000 to $2,499 | 58 (17.3%) | 0 (0.0%) |
| $2,500 to $2,999 | 11 (3.3%) | 0 (0.0%) |
| $3,000 or more | 16 (4.8%) | 0 (0.0%) |
| Total | 336 (100.0%) | 0 (0.0%) |
Physical Housing Characteristics in Brady
Housing Structures in Brady
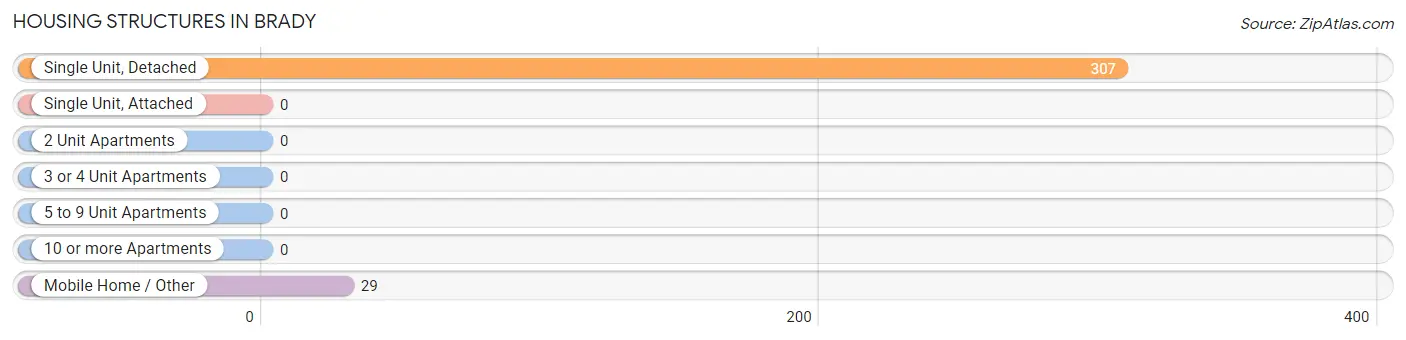
| Structure Type | # Housing Units | % Housing Units |
| Single Unit, Detached | 307 | 91.4% |
| Single Unit, Attached | 0 | 0.0% |
| 2 Unit Apartments | 0 | 0.0% |
| 3 or 4 Unit Apartments | 0 | 0.0% |
| 5 to 9 Unit Apartments | 0 | 0.0% |
| 10 or more Apartments | 0 | 0.0% |
| Mobile Home / Other | 29 | 8.6% |
| Total | 336 | 100.0% |
Housing Structures by Occupancy in Brady
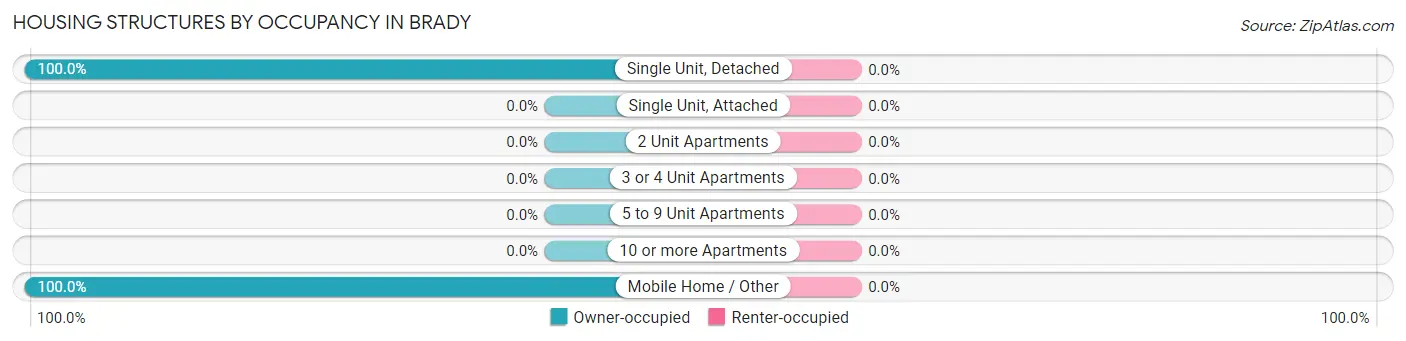
| Structure Type | Owner-occupied | Renter-occupied |
| Single Unit, Detached | 307 (100.0%) | 0 (0.0%) |
| Single Unit, Attached | 0 (0.0%) | 0 (0.0%) |
| 2 Unit Apartments | 0 (0.0%) | 0 (0.0%) |
| 3 or 4 Unit Apartments | 0 (0.0%) | 0 (0.0%) |
| 5 to 9 Unit Apartments | 0 (0.0%) | 0 (0.0%) |
| 10 or more Apartments | 0 (0.0%) | 0 (0.0%) |
| Mobile Home / Other | 29 (100.0%) | 0 (0.0%) |
| Total | 336 (100.0%) | 0 (0.0%) |
Housing Structures by Number of Rooms in Brady
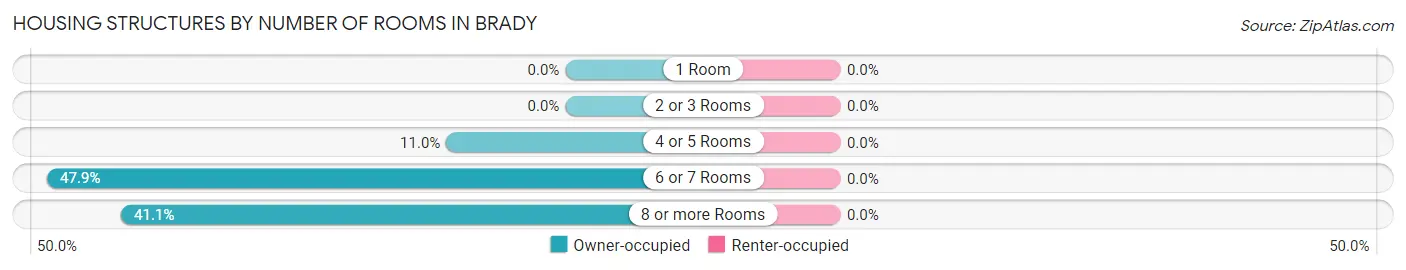
| Number of Rooms | Owner-occupied | Renter-occupied |
| 1 Room | 0 (0.0%) | 0 (0.0%) |
| 2 or 3 Rooms | 0 (0.0%) | 0 (0.0%) |
| 4 or 5 Rooms | 37 (11.0%) | 0 (0.0%) |
| 6 or 7 Rooms | 161 (47.9%) | 0 (0.0%) |
| 8 or more Rooms | 138 (41.1%) | 0 (0.0%) |
| Total | 336 (100.0%) | 0 (0.0%) |
Housing Structure by Heating Type in Brady
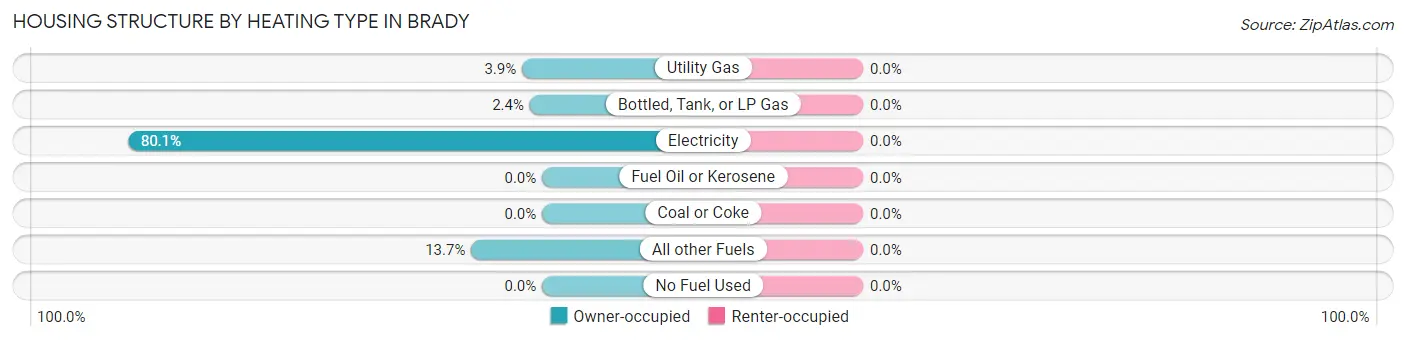
| Heating Type | Owner-occupied | Renter-occupied |
| Utility Gas | 13 (3.9%) | 0 (0.0%) |
| Bottled, Tank, or LP Gas | 8 (2.4%) | 0 (0.0%) |
| Electricity | 269 (80.1%) | 0 (0.0%) |
| Fuel Oil or Kerosene | 0 (0.0%) | 0 (0.0%) |
| Coal or Coke | 0 (0.0%) | 0 (0.0%) |
| All other Fuels | 46 (13.7%) | 0 (0.0%) |
| No Fuel Used | 0 (0.0%) | 0 (0.0%) |
| Total | 336 (100.0%) | 0 (0.0%) |
Household Vehicle Usage in Brady
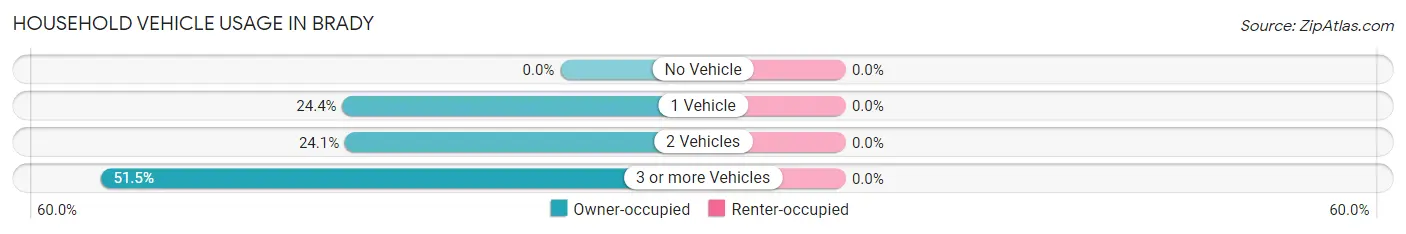
| Vehicles per Household | Owner-occupied | Renter-occupied |
| No Vehicle | 0 (0.0%) | 0 (0.0%) |
| 1 Vehicle | 82 (24.4%) | 0 (0.0%) |
| 2 Vehicles | 81 (24.1%) | 0 (0.0%) |
| 3 or more Vehicles | 173 (51.5%) | 0 (0.0%) |
| Total | 336 (100.0%) | 0 (0.0%) |
Real Estate & Mortgages in Brady
Real Estate and Mortgage Overview in Brady
| Characteristic | Without Mortgage | With Mortgage |
| Housing Units | 154 | 182 |
| Median Property Value | $214,900 | $372,400 |
| Median Household Income | - | - |
| Monthly Housing Costs | $387 | $16 |
| Real Estate Taxes | $1,649 | $0 |
Property Value by Mortgage Status in Brady
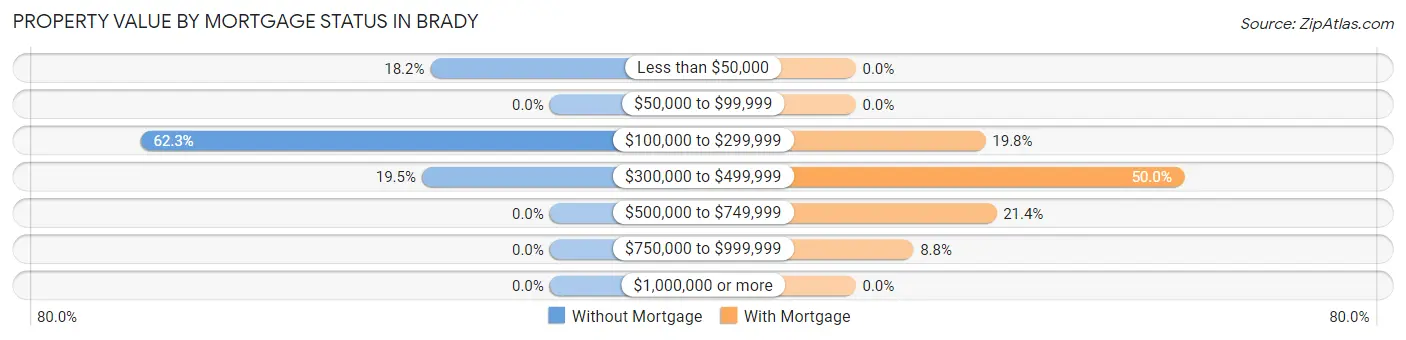
| Property Value | Without Mortgage | With Mortgage |
| Less than $50,000 | 28 (18.2%) | 0 (0.0%) |
| $50,000 to $99,999 | 0 (0.0%) | 0 (0.0%) |
| $100,000 to $299,999 | 96 (62.3%) | 36 (19.8%) |
| $300,000 to $499,999 | 30 (19.5%) | 91 (50.0%) |
| $500,000 to $749,999 | 0 (0.0%) | 39 (21.4%) |
| $750,000 to $999,999 | 0 (0.0%) | 16 (8.8%) |
| $1,000,000 or more | 0 (0.0%) | 0 (0.0%) |
| Total | 154 (100.0%) | 182 (100.0%) |
Household Income by Mortgage Status in Brady
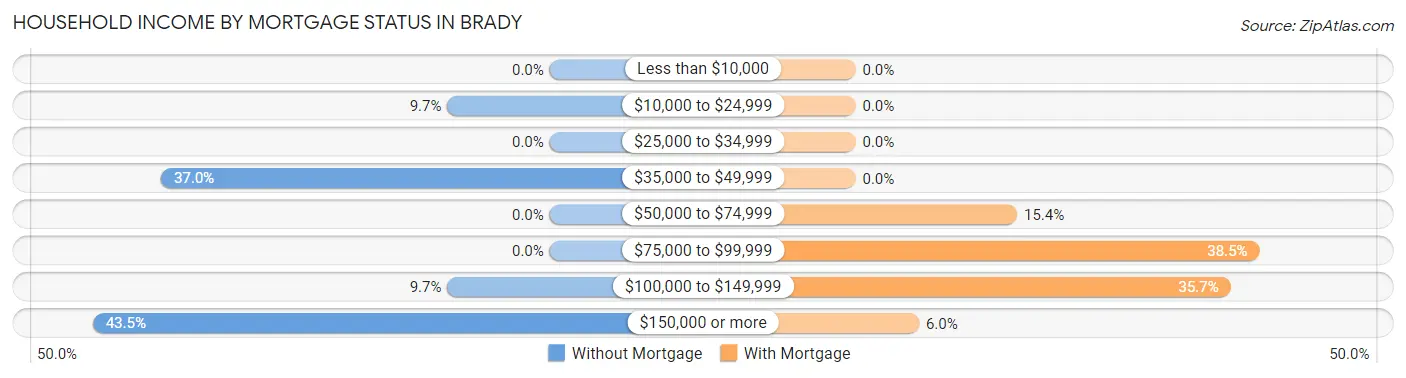
| Household Income | Without Mortgage | With Mortgage |
| Less than $10,000 | 0 (0.0%) | 0 (0.0%) |
| $10,000 to $24,999 | 15 (9.7%) | 0 (0.0%) |
| $25,000 to $34,999 | 0 (0.0%) | 0 (0.0%) |
| $35,000 to $49,999 | 57 (37.0%) | 0 (0.0%) |
| $50,000 to $74,999 | 0 (0.0%) | 28 (15.4%) |
| $75,000 to $99,999 | 0 (0.0%) | 70 (38.5%) |
| $100,000 to $149,999 | 15 (9.7%) | 65 (35.7%) |
| $150,000 or more | 67 (43.5%) | 11 (6.0%) |
| Total | 154 (100.0%) | 182 (100.0%) |
Property Value to Household Income Ratio in Brady
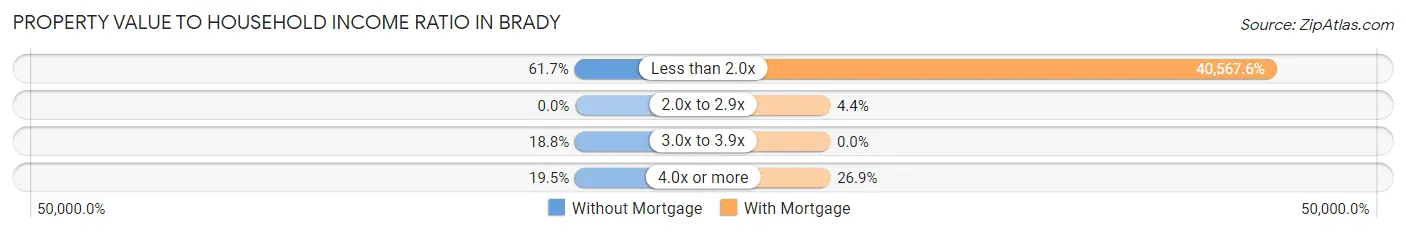
| Value-to-Income Ratio | Without Mortgage | With Mortgage |
| Less than 2.0x | 95 (61.7%) | 73,833 (40,567.6%) |
| 2.0x to 2.9x | 0 (0.0%) | 8 (4.4%) |
| 3.0x to 3.9x | 29 (18.8%) | 0 (0.0%) |
| 4.0x or more | 30 (19.5%) | 49 (26.9%) |
| Total | 154 (100.0%) | 182 (100.0%) |
Real Estate Taxes by Mortgage Status in Brady
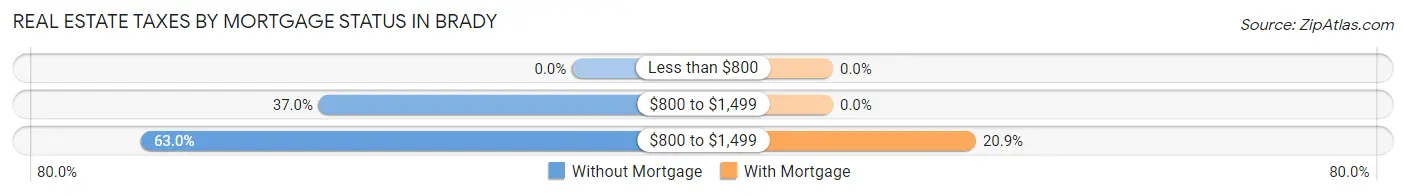
| Property Taxes | Without Mortgage | With Mortgage |
| Less than $800 | 0 (0.0%) | 0 (0.0%) |
| $800 to $1,499 | 57 (37.0%) | 0 (0.0%) |
| $800 to $1,499 | 97 (63.0%) | 38 (20.9%) |
| Total | 154 (100.0%) | 182 (100.0%) |
Health & Disability in Brady
Health Insurance Coverage by Age in Brady
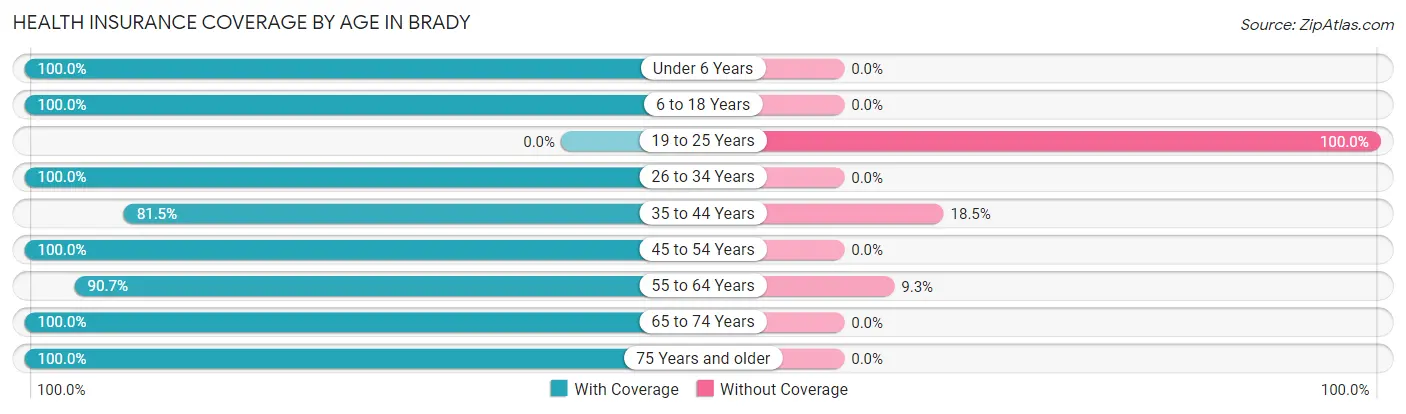
| Age Bracket | With Coverage | Without Coverage |
| Under 6 Years | 72 (100.0%) | 0 (0.0%) |
| 6 to 18 Years | 223 (100.0%) | 0 (0.0%) |
| 19 to 25 Years | 0 (0.0%) | 18 (100.0%) |
| 26 to 34 Years | 43 (100.0%) | 0 (0.0%) |
| 35 to 44 Years | 66 (81.5%) | 15 (18.5%) |
| 45 to 54 Years | 121 (100.0%) | 0 (0.0%) |
| 55 to 64 Years | 165 (90.7%) | 17 (9.3%) |
| 65 to 74 Years | 111 (100.0%) | 0 (0.0%) |
| 75 Years and older | 111 (100.0%) | 0 (0.0%) |
| Total | 912 (94.8%) | 50 (5.2%) |
Health Insurance Coverage by Citizenship Status in Brady
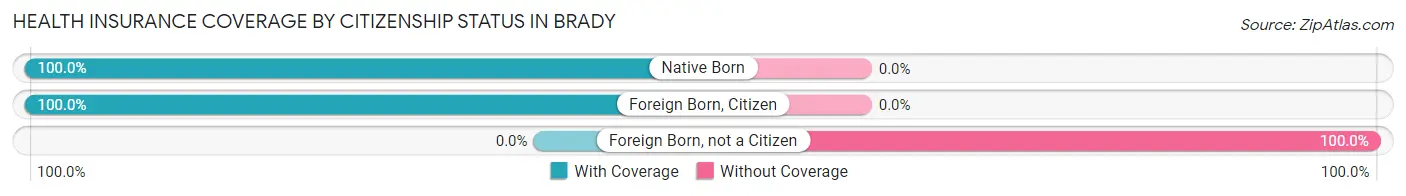
| Citizenship Status | With Coverage | Without Coverage |
| Native Born | 72 (100.0%) | 0 (0.0%) |
| Foreign Born, Citizen | 223 (100.0%) | 0 (0.0%) |
| Foreign Born, not a Citizen | 0 (0.0%) | 18 (100.0%) |
Health Insurance Coverage by Household Income in Brady
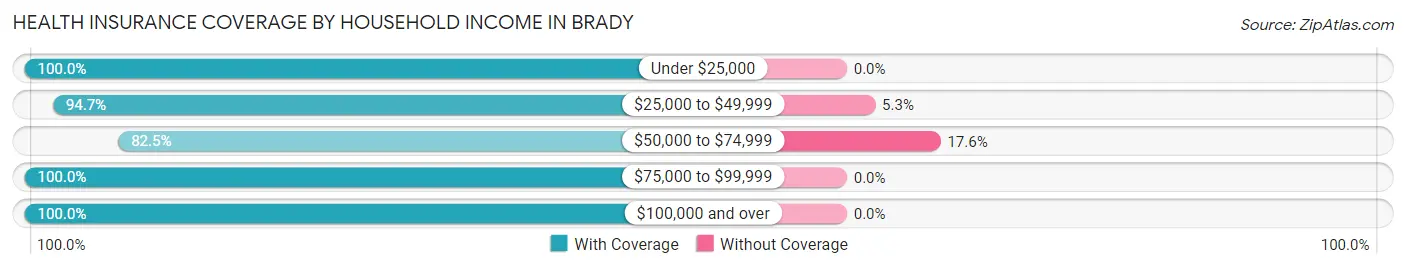
| Household Income | With Coverage | Without Coverage |
| Under $25,000 | 15 (100.0%) | 0 (0.0%) |
| $25,000 to $49,999 | 303 (94.7%) | 17 (5.3%) |
| $50,000 to $74,999 | 155 (82.5%) | 33 (17.5%) |
| $75,000 to $99,999 | 134 (100.0%) | 0 (0.0%) |
| $100,000 and over | 305 (100.0%) | 0 (0.0%) |
Public vs Private Health Insurance Coverage by Age in Brady
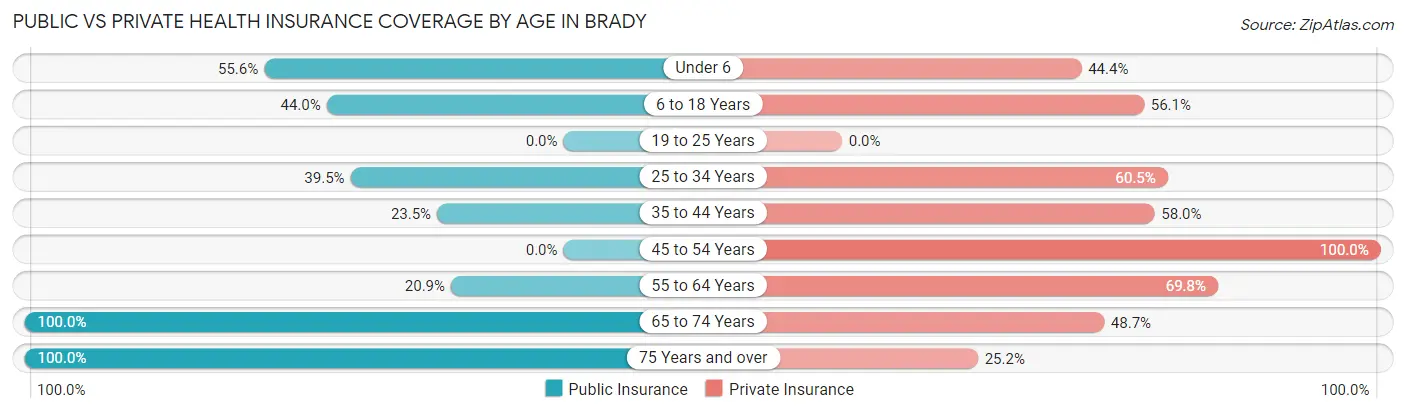
| Age Bracket | Public Insurance | Private Insurance |
| Under 6 | 40 (55.6%) | 32 (44.4%) |
| 6 to 18 Years | 98 (44.0%) | 125 (56.0%) |
| 19 to 25 Years | 0 (0.0%) | 0 (0.0%) |
| 25 to 34 Years | 17 (39.5%) | 26 (60.5%) |
| 35 to 44 Years | 19 (23.5%) | 47 (58.0%) |
| 45 to 54 Years | 0 (0.0%) | 121 (100.0%) |
| 55 to 64 Years | 38 (20.9%) | 127 (69.8%) |
| 65 to 74 Years | 111 (100.0%) | 54 (48.6%) |
| 75 Years and over | 111 (100.0%) | 28 (25.2%) |
| Total | 434 (45.1%) | 560 (58.2%) |
Disability Status by Sex by Age in Brady
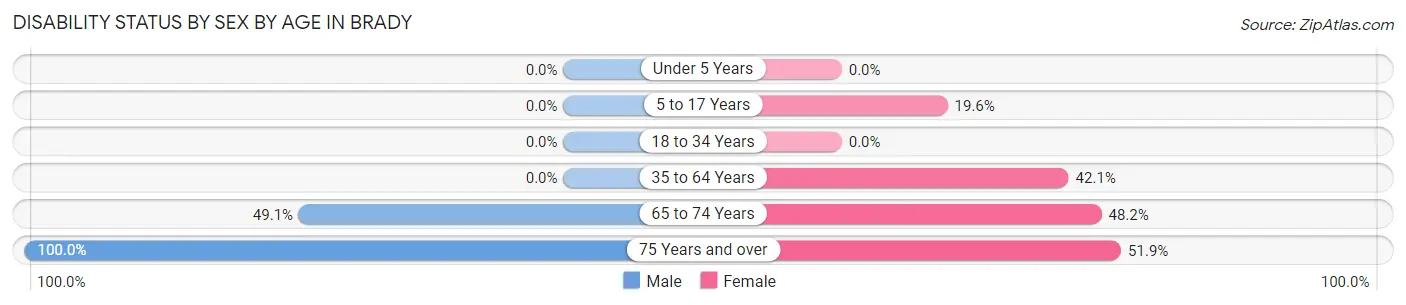
| Age Bracket | Male | Female |
| Under 5 Years | 0 (0.0%) | 0 (0.0%) |
| 5 to 17 Years | 0 (0.0%) | 11 (19.6%) |
| 18 to 34 Years | 0 (0.0%) | 0 (0.0%) |
| 35 to 64 Years | 0 (0.0%) | 96 (42.1%) |
| 65 to 74 Years | 27 (49.1%) | 27 (48.2%) |
| 75 Years and over | 57 (100.0%) | 28 (51.8%) |
Disability Class by Sex by Age in Brady
Disability Class: Hearing Difficulty
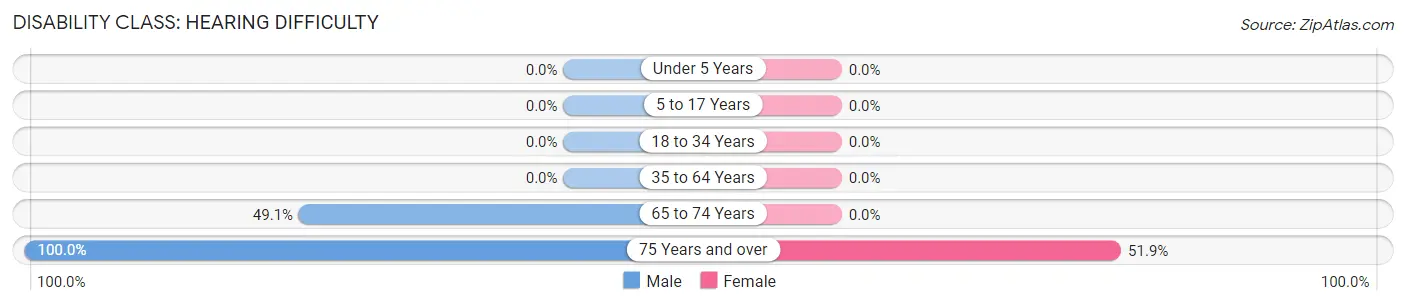
| Age Bracket | Male | Female |
| Under 5 Years | 0 (0.0%) | 0 (0.0%) |
| 5 to 17 Years | 0 (0.0%) | 0 (0.0%) |
| 18 to 34 Years | 0 (0.0%) | 0 (0.0%) |
| 35 to 64 Years | 0 (0.0%) | 0 (0.0%) |
| 65 to 74 Years | 27 (49.1%) | 0 (0.0%) |
| 75 Years and over | 57 (100.0%) | 28 (51.8%) |
Disability Class: Vision Difficulty
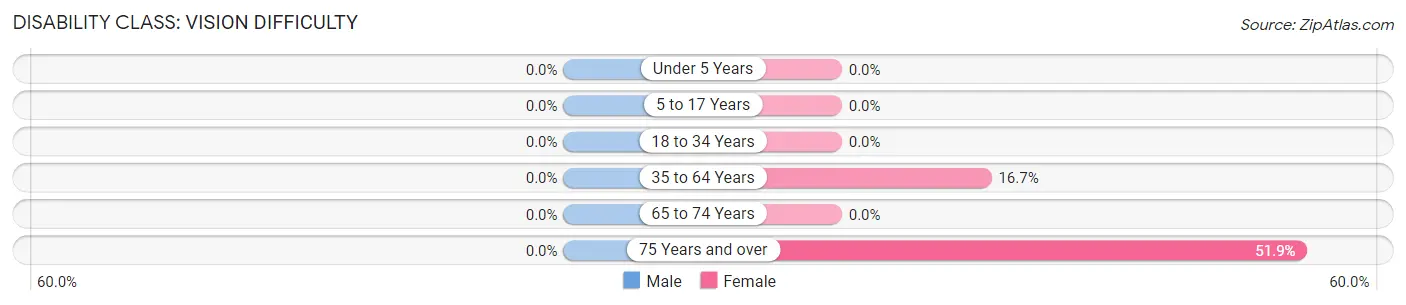
| Age Bracket | Male | Female |
| Under 5 Years | 0 (0.0%) | 0 (0.0%) |
| 5 to 17 Years | 0 (0.0%) | 0 (0.0%) |
| 18 to 34 Years | 0 (0.0%) | 0 (0.0%) |
| 35 to 64 Years | 0 (0.0%) | 38 (16.7%) |
| 65 to 74 Years | 0 (0.0%) | 0 (0.0%) |
| 75 Years and over | 0 (0.0%) | 28 (51.8%) |
Disability Class: Cognitive Difficulty
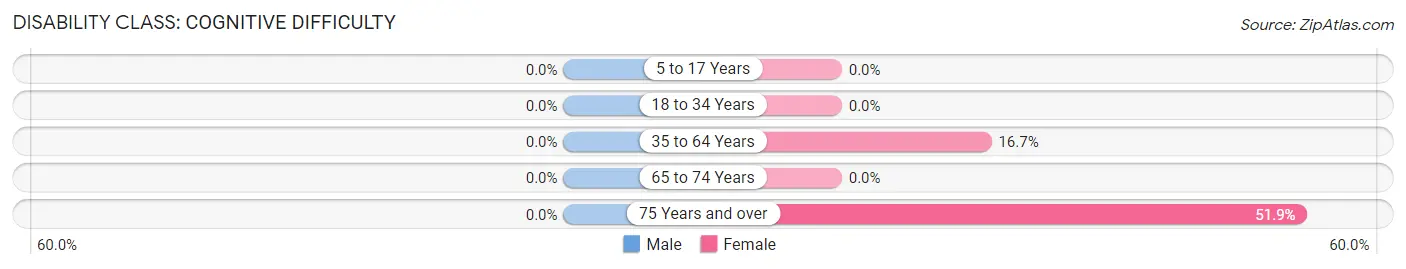
| Age Bracket | Male | Female |
| 5 to 17 Years | 0 (0.0%) | 0 (0.0%) |
| 18 to 34 Years | 0 (0.0%) | 0 (0.0%) |
| 35 to 64 Years | 0 (0.0%) | 38 (16.7%) |
| 65 to 74 Years | 0 (0.0%) | 0 (0.0%) |
| 75 Years and over | 0 (0.0%) | 28 (51.8%) |
Disability Class: Ambulatory Difficulty
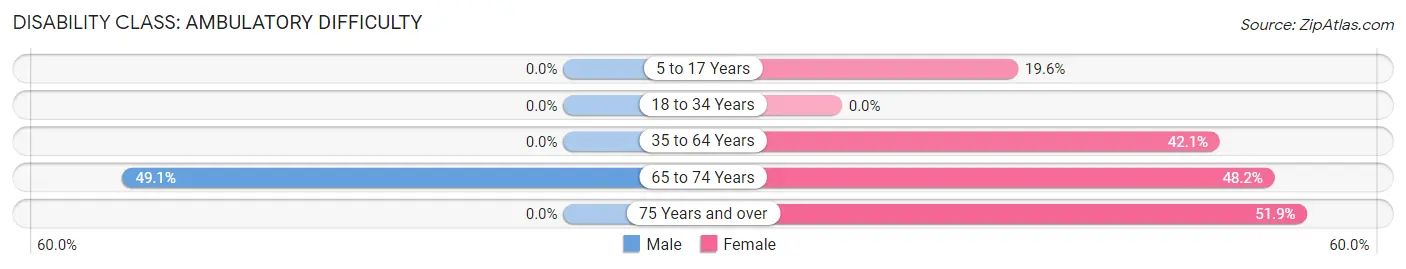
| Age Bracket | Male | Female |
| 5 to 17 Years | 0 (0.0%) | 11 (19.6%) |
| 18 to 34 Years | 0 (0.0%) | 0 (0.0%) |
| 35 to 64 Years | 0 (0.0%) | 96 (42.1%) |
| 65 to 74 Years | 27 (49.1%) | 27 (48.2%) |
| 75 Years and over | 0 (0.0%) | 28 (51.8%) |
Disability Class: Self-Care Difficulty
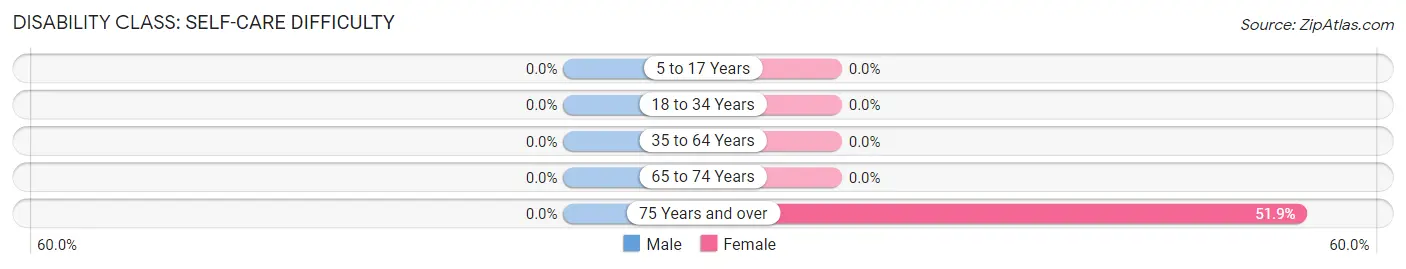
| Age Bracket | Male | Female |
| 5 to 17 Years | 0 (0.0%) | 0 (0.0%) |
| 18 to 34 Years | 0 (0.0%) | 0 (0.0%) |
| 35 to 64 Years | 0 (0.0%) | 0 (0.0%) |
| 65 to 74 Years | 0 (0.0%) | 0 (0.0%) |
| 75 Years and over | 0 (0.0%) | 28 (51.8%) |
Technology Access in Brady
Computing Device Access in Brady
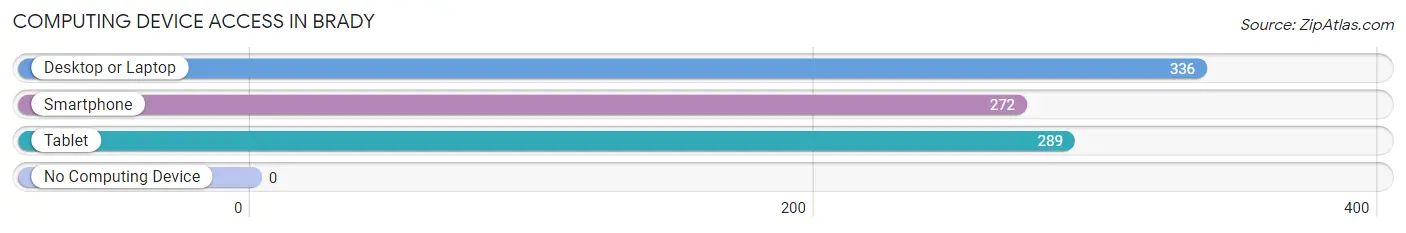
| Device Type | # Households | % Households |
| Desktop or Laptop | 336 | 100.0% |
| Smartphone | 272 | 80.9% |
| Tablet | 289 | 86.0% |
| No Computing Device | 0 | 0.0% |
| Total | 336 | 100.0% |
Internet Access in Brady
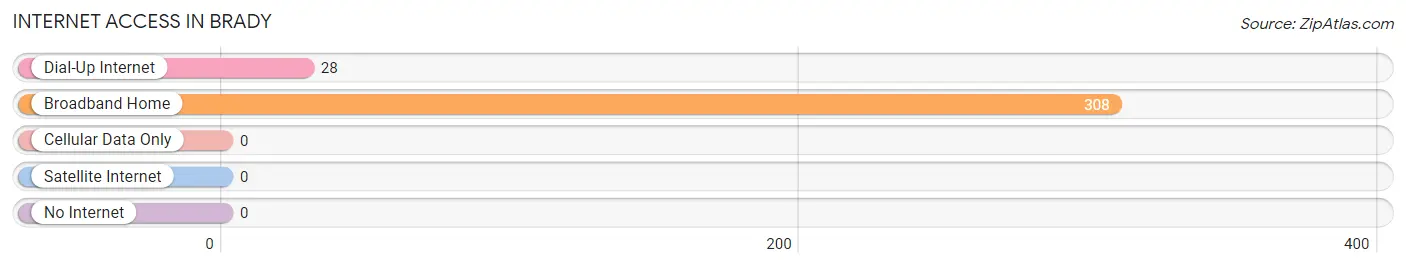
| Internet Type | # Households | % Households |
| Dial-Up Internet | 28 | 8.3% |
| Broadband Home | 308 | 91.7% |
| Cellular Data Only | 0 | 0.0% |
| Satellite Internet | 0 | 0.0% |
| No Internet | 0 | 0.0% |
| Total | 336 | 100.0% |
Brady Summary
Brady, Washington is a small town located in the northeastern corner of the state, near the Canadian border. It is part of the Okanogan County, and is situated in the Okanogan Valley. The town was founded in 1891 and was named after the first postmaster, William Brady.
Geography
Brady is located in the Okanogan Valley, which is a large valley in the northeastern corner of Washington State. The valley is bordered by the Okanogan River to the east, the Columbia River to the south, and the Cascade Mountains to the west. The valley is known for its fertile soil and mild climate, which makes it ideal for growing a variety of crops. The town of Brady is situated on the banks of the Okanogan River, and is surrounded by rolling hills and farmland.
The town of Brady is located at an elevation of 1,845 feet, and has a total area of 0.7 square miles. The town is located in a semi-arid climate, with hot summers and cold winters. The average annual temperature is around 50 degrees Fahrenheit, and the average annual precipitation is around 12 inches.
Economy
The economy of Brady is largely based on agriculture. The town is home to several farms and ranches, which produce a variety of crops, including wheat, barley, hay, and alfalfa. The town is also home to several fruit orchards, which produce apples, pears, and cherries.
In addition to agriculture, Brady is home to several small businesses, including a grocery store, a hardware store, and a few restaurants. The town is also home to a small airport, which serves the surrounding area.
Demographics
As of the 2010 census, the population of Brady was 1,093. The population is predominantly white, with a small percentage of Native American and Hispanic residents. The median household income is around $35,000, and the median home value is around $150,000.
The town of Brady is served by the Okanogan County School District, which includes two elementary schools, one middle school, and one high school. The town is also home to a small library, which offers a variety of books and other resources.
Conclusion
Brady, Washington is a small town located in the northeastern corner of the state, near the Canadian border. It is part of the Okanogan County, and is situated in the Okanogan Valley. The town was founded in 1891 and was named after the first postmaster, William Brady. The economy of Brady is largely based on agriculture, and the town is home to several small businesses. The population of Brady is predominantly white, with a small percentage of Native American and Hispanic residents. The town is served by the Okanogan County School District, and is home to a small library.
Common Questions
What is Per Capita Income in Brady?
Per Capita income in Brady is $29,196.
What is the Median Family Income in Brady?
Median Family Income in Brady is $74,667.
What is the Median Household income in Brady?
Median Household Income in Brady is $74,667.
What is Inequality or Gini Index in Brady?
Inequality or Gini Index in Brady is 0.30.
What is the Total Population of Brady?
Total Population of Brady is 962.
What is the Total Male Population of Brady?
Total Male Population of Brady is 489.
What is the Total Female Population of Brady?
Total Female Population of Brady is 473.
What is the Ratio of Males per 100 Females in Brady?
There are 103.38 Males per 100 Females in Brady.
What is the Ratio of Females per 100 Males in Brady?
There are 96.73 Females per 100 Males in Brady.
What is the Median Population Age in Brady?
Median Population Age in Brady is 50.8 Years.
What is the Average Family Size in Brady
Average Family Size in Brady is 3.0 People.
What is the Average Household Size in Brady
Average Household Size in Brady is 2.9 People.
How Large is the Labor Force in Brady?
There are 275 People in the Labor Forcein in Brady.
What is the Percentage of People in the Labor Force in Brady?
35.4% of People are in the Labor Force in Brady.
What is the Unemployment Rate in Brady?
Unemployment Rate in Brady is 3.3%.