Riverside, WA Map & Demographics
Riverside Map
Riverside Overview
$18,268
PER CAPITA INCOME
$33,824
AVG FAMILY INCOME
$34,816
AVG HOUSEHOLD INCOME
17.3%
WAGE / INCOME GAP [ % ]
82.7¢/ $1
WAGE / INCOME GAP [ $ ]
0.39
INEQUALITY / GINI INDEX
424
TOTAL POPULATION
213
MALE POPULATION
211
FEMALE POPULATION
100.95
MALES / 100 FEMALES
99.06
FEMALES / 100 MALES
34.6
MEDIAN AGE
2.7
AVG FAMILY SIZE
2.5
AVG HOUSEHOLD SIZE
180
LABOR FORCE [ PEOPLE ]
60.6%
PERCENT IN LABOR FORCE
6.1%
UNEMPLOYMENT RATE
Riverside Zip Codes
Riverside Area Codes
Income in Riverside
Income Overview in Riverside
Per Capita Income in Riverside is $18,268, while median incomes of families and households are $33,824 and $34,816 respectively.
| Characteristic | Number | Measure |
| Per Capita Income | 424 | $18,268 |
| Median Family Income | 124 | $33,824 |
| Mean Family Income | 124 | $41,136 |
| Median Household Income | 173 | $34,816 |
| Mean Household Income | 173 | $46,966 |
| Income Deficit | 124 | $0 |
| Wage / Income Gap (%) | 424 | 17.28% |
| Wage / Income Gap ($) | 424 | 82.72¢ per $1 |
| Gini / Inequality Index | 424 | 0.39 |
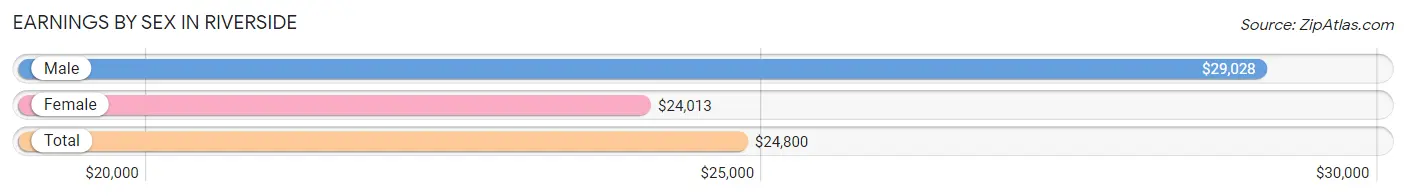
Earnings by Sex in Riverside
Average Earnings in Riverside are $24,800, $29,028 for men and $24,013 for women, a difference of 17.3%.
| Sex | Number | Average Earnings |
| Male | 111 (61.0%) | $29,028 |
| Female | 71 (39.0%) | $24,013 |
| Total | 182 (100.0%) | $24,800 |
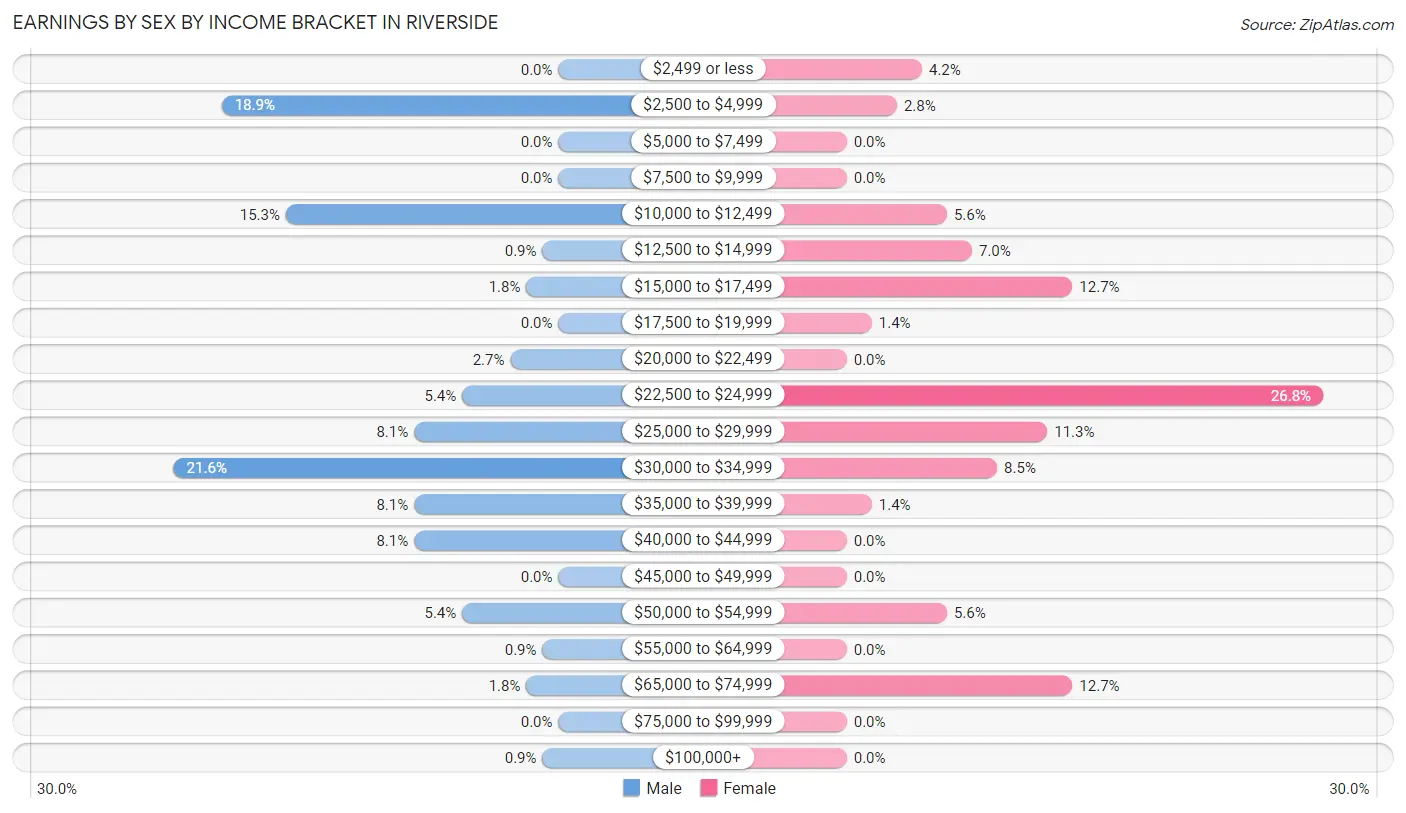
Earnings by Sex by Income Bracket in Riverside
The most common earnings brackets in Riverside are $30,000 to $34,999 for men (24 | 21.6%) and $22,500 to $24,999 for women (19 | 26.8%).
| Income | Male | Female |
| $2,499 or less | 0 (0.0%) | 3 (4.2%) |
| $2,500 to $4,999 | 21 (18.9%) | 2 (2.8%) |
| $5,000 to $7,499 | 0 (0.0%) | 0 (0.0%) |
| $7,500 to $9,999 | 0 (0.0%) | 0 (0.0%) |
| $10,000 to $12,499 | 17 (15.3%) | 4 (5.6%) |
| $12,500 to $14,999 | 1 (0.9%) | 5 (7.0%) |
| $15,000 to $17,499 | 2 (1.8%) | 9 (12.7%) |
| $17,500 to $19,999 | 0 (0.0%) | 1 (1.4%) |
| $20,000 to $22,499 | 3 (2.7%) | 0 (0.0%) |
| $22,500 to $24,999 | 6 (5.4%) | 19 (26.8%) |
| $25,000 to $29,999 | 9 (8.1%) | 8 (11.3%) |
| $30,000 to $34,999 | 24 (21.6%) | 6 (8.5%) |
| $35,000 to $39,999 | 9 (8.1%) | 1 (1.4%) |
| $40,000 to $44,999 | 9 (8.1%) | 0 (0.0%) |
| $45,000 to $49,999 | 0 (0.0%) | 0 (0.0%) |
| $50,000 to $54,999 | 6 (5.4%) | 4 (5.6%) |
| $55,000 to $64,999 | 1 (0.9%) | 0 (0.0%) |
| $65,000 to $74,999 | 2 (1.8%) | 9 (12.7%) |
| $75,000 to $99,999 | 0 (0.0%) | 0 (0.0%) |
| $100,000+ | 1 (0.9%) | 0 (0.0%) |
| Total | 111 (100.0%) | 71 (100.0%) |
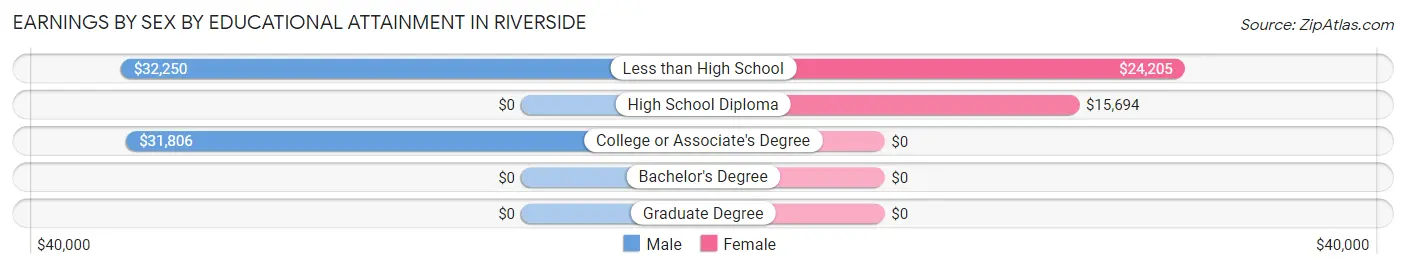
Earnings by Sex by Educational Attainment in Riverside
Average earnings in Riverside are $31,333 for men and $24,145 for women, a difference of 22.9%. Men with an educational attainment of less than high school enjoy the highest average annual earnings of $32,250, while those with college or associate's degree education earn the least with $31,806. Women with an educational attainment of less than high school earn the most with the average annual earnings of $24,205, while those with high school diploma education have the smallest earnings of $15,694.
| Educational Attainment | Male Income | Female Income |
| Less than High School | $32,250 | $24,205 |
| High School Diploma | - | - |
| College or Associate's Degree | $31,806 | $0 |
| Bachelor's Degree | - | - |
| Graduate Degree | - | - |
| Total | $31,333 | $24,145 |
Family Income in Riverside
Family Income Brackets in Riverside
According to the Riverside family income data, there are 35 families falling into the $25,000 to $34,999 income range, which is the most common income bracket and makes up 28.2% of all families.
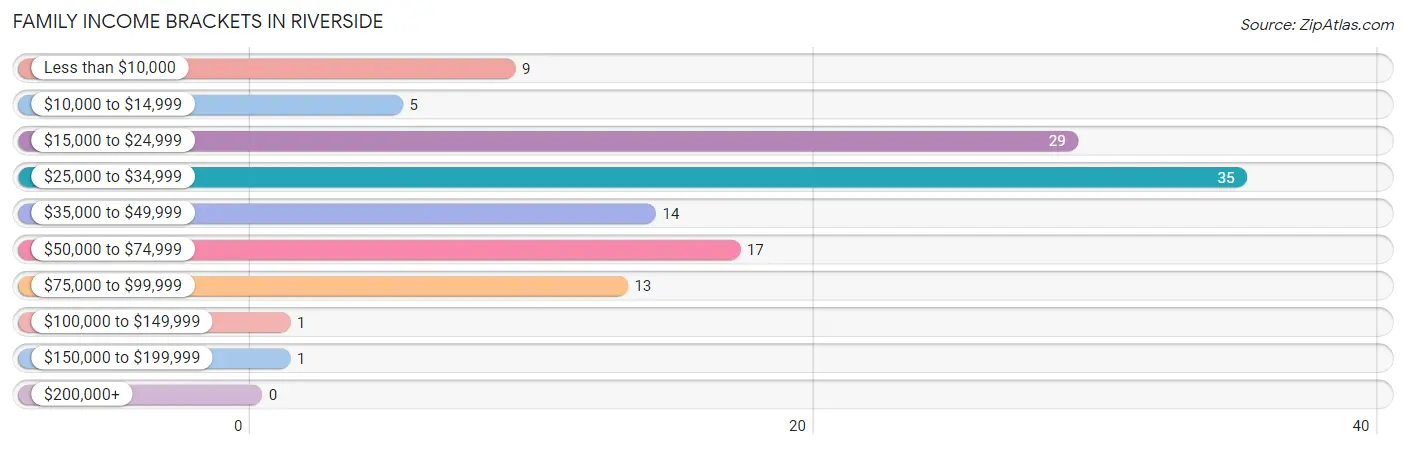
| Income Bracket | # Families | % Families |
| Less than $10,000 | 9 | 7.3% |
| $10,000 to $14,999 | 5 | 4.0% |
| $15,000 to $24,999 | 29 | 23.4% |
| $25,000 to $34,999 | 35 | 28.2% |
| $35,000 to $49,999 | 14 | 11.3% |
| $50,000 to $74,999 | 17 | 13.7% |
| $75,000 to $99,999 | 13 | 10.5% |
| $100,000 to $149,999 | 1 | 0.8% |
| $150,000 to $199,999 | 1 | 0.8% |
| $200,000+ | 0 | 0.0% |
Family Income by Famaliy Size in Riverside
4-person families (18 | 14.5%) account for the highest median family income in Riverside with $41,250 per family, while 2-person families (53 | 42.7%) have the highest median income of $16,918 per family member.
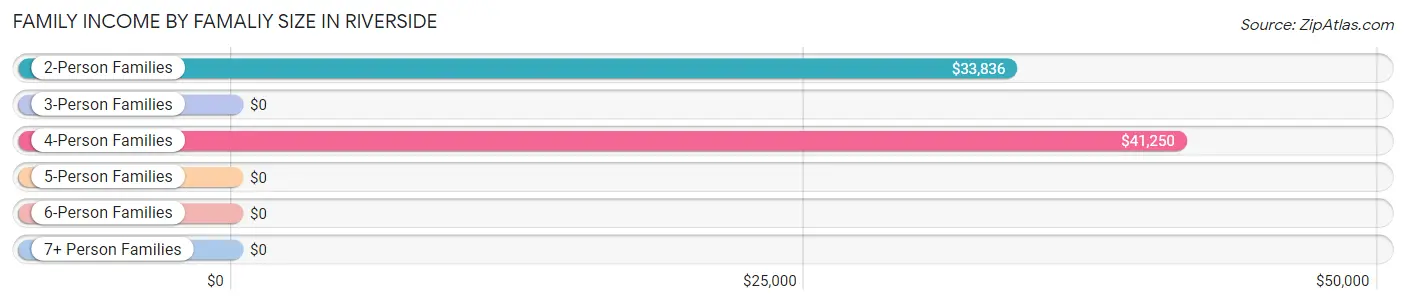
| Income Bracket | # Families | Median Income |
| 2-Person Families | 53 (42.7%) | $33,836 |
| 3-Person Families | 38 (30.6%) | $0 |
| 4-Person Families | 18 (14.5%) | $41,250 |
| 5-Person Families | 13 (10.5%) | $0 |
| 6-Person Families | 2 (1.6%) | $0 |
| 7+ Person Families | 0 (0.0%) | $0 |
| Total | 124 (100.0%) | $33,824 |
Family Income by Number of Earners in Riverside
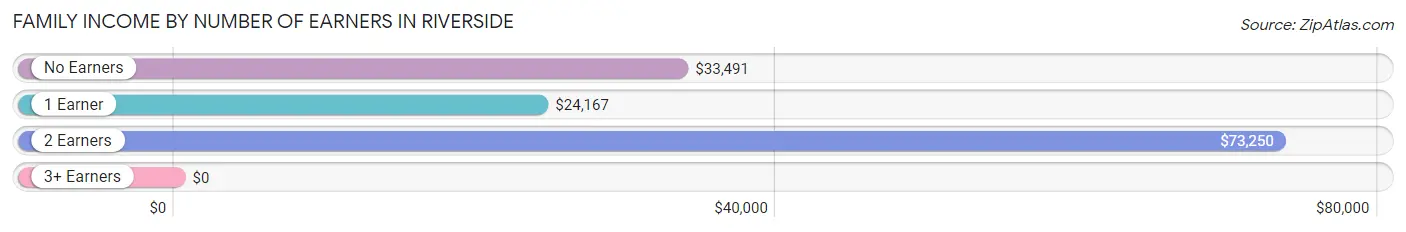
| Number of Earners | # Families | Median Income |
| No Earners | 49 (39.5%) | $33,491 |
| 1 Earner | 44 (35.5%) | $24,167 |
| 2 Earners | 27 (21.8%) | $73,250 |
| 3+ Earners | 4 (3.2%) | $0 |
| Total | 124 (100.0%) | $33,824 |
Household Income in Riverside
Household Income Brackets in Riverside
With 51 households falling in the category, the $50,000 to $74,999 income range is the most frequent in Riverside, accounting for 29.5% of all households. In contrast, only 1 households (0.6%) fall into the $100,000 to $149,999 income bracket, making it the least populous group.
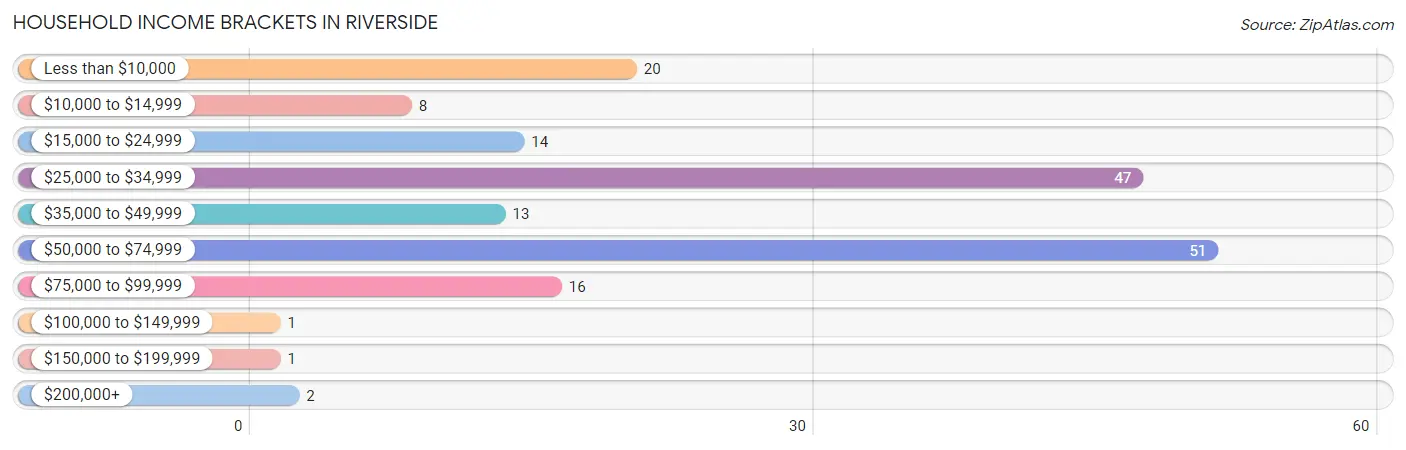
| Income Bracket | # Households | % Households |
| Less than $10,000 | 20 | 11.6% |
| $10,000 to $14,999 | 8 | 4.6% |
| $15,000 to $24,999 | 14 | 8.1% |
| $25,000 to $34,999 | 47 | 27.2% |
| $35,000 to $49,999 | 13 | 7.5% |
| $50,000 to $74,999 | 51 | 29.5% |
| $75,000 to $99,999 | 16 | 9.2% |
| $100,000 to $149,999 | 1 | 0.6% |
| $150,000 to $199,999 | 1 | 0.6% |
| $200,000+ | 2 | 1.2% |
Household Income by Householder Age in Riverside
The median household income in Riverside is $34,816, with the highest median household income of $52,833 found in the 25 to 44 years age bracket for the primary householder. A total of 64 households (37.0%) fall into this category. Meanwhile, the 15 to 24 years age bracket for the primary householder has the lowest median household income of $0, with 2 households (1.2%) in this group.
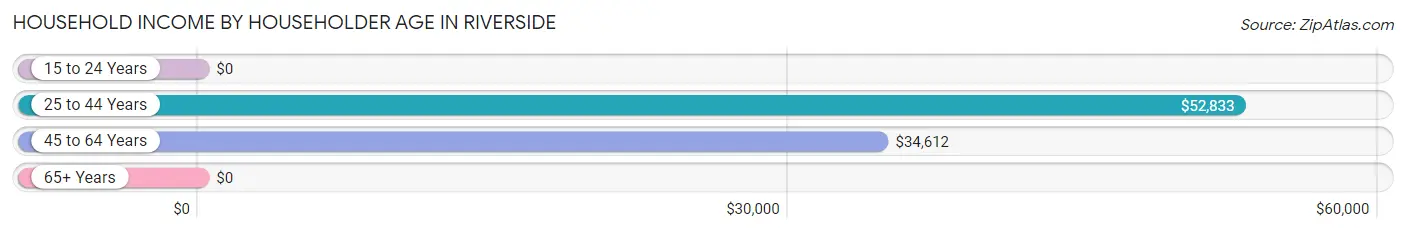
| Income Bracket | # Households | Median Income |
| 15 to 24 Years | 2 (1.2%) | $0 |
| 25 to 44 Years | 64 (37.0%) | $52,833 |
| 45 to 64 Years | 71 (41.0%) | $34,612 |
| 65+ Years | 36 (20.8%) | $0 |
| Total | 173 (100.0%) | $34,816 |
Poverty in Riverside
Income Below Poverty by Sex and Age in Riverside
With 28.8% poverty level for males and 39.8% for females among the residents of Riverside, 16 and 17 year old males and under 5 year old females are the most vulnerable to poverty, with 5 males (100.0%) and 5 females (100.0%) in their respective age groups living below the poverty level.
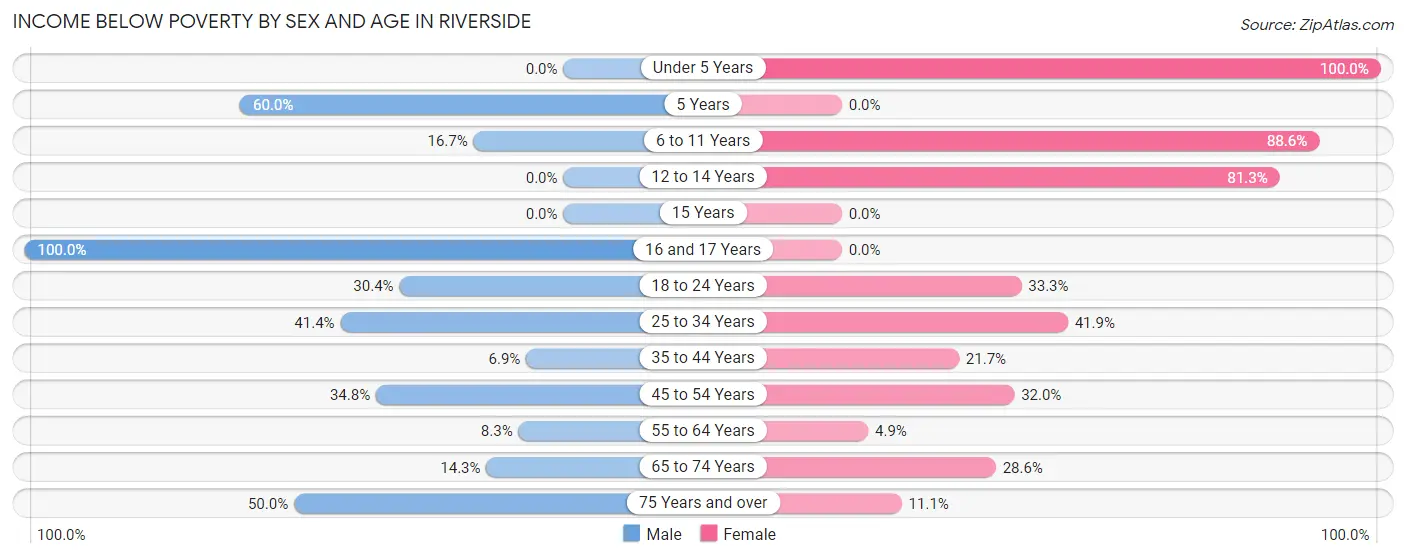
| Age Bracket | Male | Female |
| Under 5 Years | 0 (0.0%) | 5 (100.0%) |
| 5 Years | 9 (60.0%) | 0 (0.0%) |
| 6 to 11 Years | 5 (16.7%) | 31 (88.6%) |
| 12 to 14 Years | 0 (0.0%) | 13 (81.2%) |
| 15 Years | 0 (0.0%) | 0 (0.0%) |
| 16 and 17 Years | 5 (100.0%) | 0 (0.0%) |
| 18 to 24 Years | 7 (30.4%) | 2 (33.3%) |
| 25 to 34 Years | 12 (41.4%) | 13 (41.9%) |
| 35 to 44 Years | 2 (6.9%) | 5 (21.7%) |
| 45 to 54 Years | 8 (34.8%) | 8 (32.0%) |
| 55 to 64 Years | 1 (8.3%) | 2 (4.9%) |
| 65 to 74 Years | 1 (14.3%) | 4 (28.6%) |
| 75 Years and over | 10 (50.0%) | 1 (11.1%) |
| Total | 60 (28.8%) | 84 (39.8%) |
Income Above Poverty by Sex and Age in Riverside
According to the poverty statistics in Riverside, males aged under 5 years and females aged 5 years are the age groups that are most secure financially, with 100.0% of males and 100.0% of females in these age groups living above the poverty line.
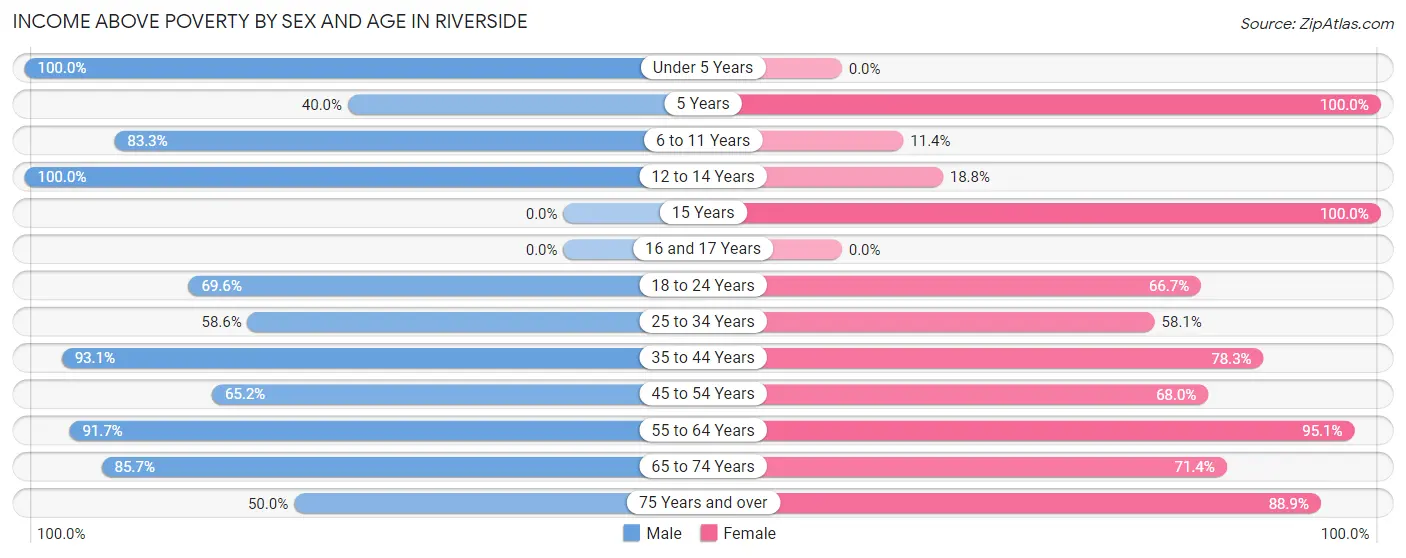
| Age Bracket | Male | Female |
| Under 5 Years | 1 (100.0%) | 0 (0.0%) |
| 5 Years | 6 (40.0%) | 3 (100.0%) |
| 6 to 11 Years | 25 (83.3%) | 4 (11.4%) |
| 12 to 14 Years | 14 (100.0%) | 3 (18.8%) |
| 15 Years | 0 (0.0%) | 3 (100.0%) |
| 16 and 17 Years | 0 (0.0%) | 0 (0.0%) |
| 18 to 24 Years | 16 (69.6%) | 4 (66.7%) |
| 25 to 34 Years | 17 (58.6%) | 18 (58.1%) |
| 35 to 44 Years | 27 (93.1%) | 18 (78.3%) |
| 45 to 54 Years | 15 (65.2%) | 17 (68.0%) |
| 55 to 64 Years | 11 (91.7%) | 39 (95.1%) |
| 65 to 74 Years | 6 (85.7%) | 10 (71.4%) |
| 75 Years and over | 10 (50.0%) | 8 (88.9%) |
| Total | 148 (71.2%) | 127 (60.2%) |
Income Below Poverty Among Married-Couple Families in Riverside
The poverty statistics for married-couple families in Riverside show that 22.2% or 10 of the total 45 families live below the poverty line. Families with 3 or 4 children have the highest poverty rate of 66.7%, comprising of 4 families. On the other hand, families with 1 or 2 children have the lowest poverty rate of 0.0%, which includes 0 families.
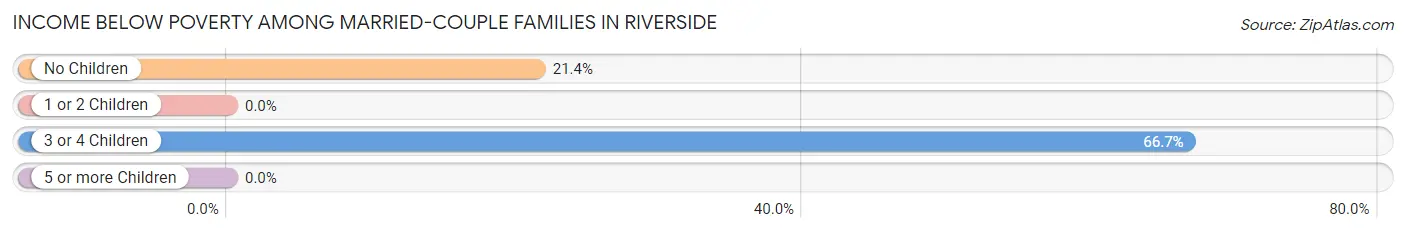
| Children | Above Poverty | Below Poverty |
| No Children | 22 (78.6%) | 6 (21.4%) |
| 1 or 2 Children | 11 (100.0%) | 0 (0.0%) |
| 3 or 4 Children | 2 (33.3%) | 4 (66.7%) |
| 5 or more Children | 0 (0.0%) | 0 (0.0%) |
| Total | 35 (77.8%) | 10 (22.2%) |
Income Below Poverty Among Single-Parent Households in Riverside
According to the poverty data in Riverside, 8.3% or 1 single-father households and 23.9% or 16 single-mother households are living below the poverty line. Among single-father households, those with 1 or 2 children have the highest poverty rate, with 1 households (16.7%) experiencing poverty. Likewise, among single-mother households, those with 3 or 4 children have the highest poverty rate, with 12 households (66.7%) falling below the poverty line.
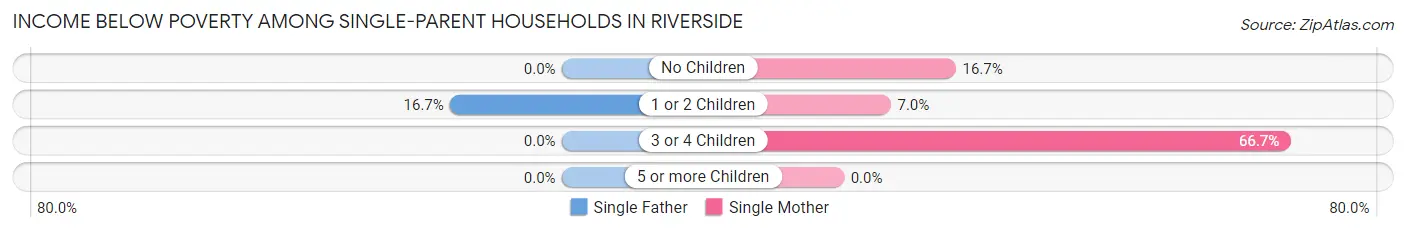
| Children | Single Father | Single Mother |
| No Children | 0 (0.0%) | 1 (16.7%) |
| 1 or 2 Children | 1 (16.7%) | 3 (7.0%) |
| 3 or 4 Children | 0 (0.0%) | 12 (66.7%) |
| 5 or more Children | 0 (0.0%) | 0 (0.0%) |
| Total | 1 (8.3%) | 16 (23.9%) |
Income Below Poverty Among Married-Couple vs Single-Parent Households in Riverside
The poverty data for Riverside shows that 10 of the married-couple family households (22.2%) and 17 of the single-parent households (21.5%) are living below the poverty level. Within the married-couple family households, those with 3 or 4 children have the highest poverty rate, with 4 households (66.7%) falling below the poverty line. Among the single-parent households, those with 3 or 4 children have the highest poverty rate, with 12 household (66.7%) living below poverty.
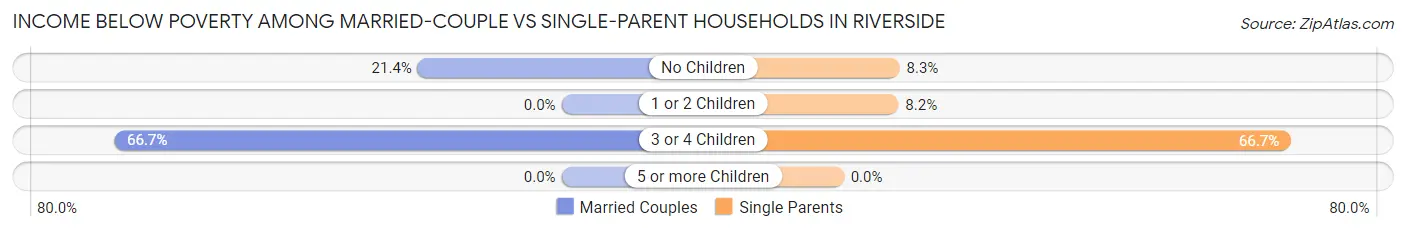
| Children | Married-Couple Families | Single-Parent Households |
| No Children | 6 (21.4%) | 1 (8.3%) |
| 1 or 2 Children | 0 (0.0%) | 4 (8.2%) |
| 3 or 4 Children | 4 (66.7%) | 12 (66.7%) |
| 5 or more Children | 0 (0.0%) | 0 (0.0%) |
| Total | 10 (22.2%) | 17 (21.5%) |
Race in Riverside
The most populous races in Riverside are White / Caucasian (255 | 60.1%), Two or more Races (122 | 28.8%), and Hispanic or Latino (93 | 21.9%).
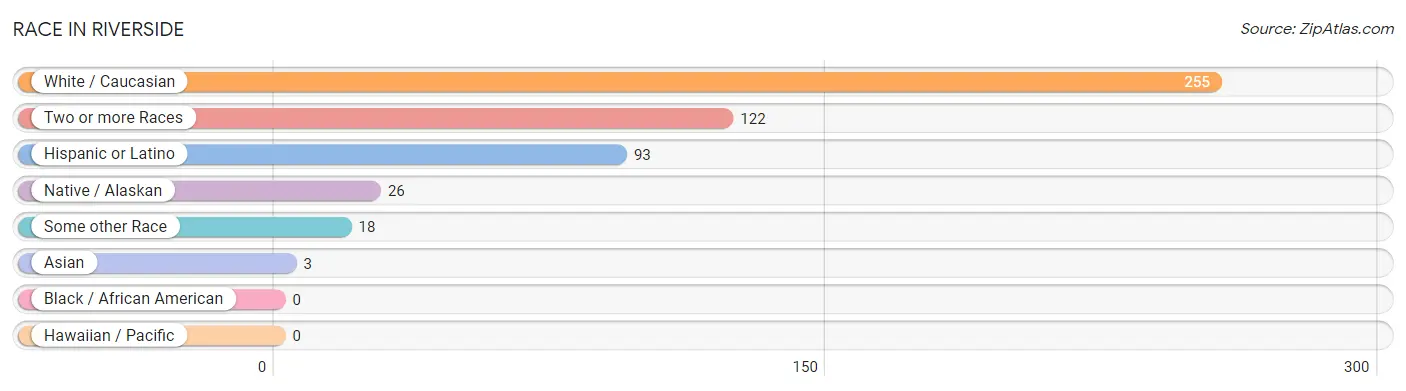
| Race | # Population | % Population |
| Asian | 3 | 0.7% |
| Black / African American | 0 | 0.0% |
| Hawaiian / Pacific | 0 | 0.0% |
| Hispanic or Latino | 93 | 21.9% |
| Native / Alaskan | 26 | 6.1% |
| White / Caucasian | 255 | 60.1% |
| Two or more Races | 122 | 28.8% |
| Some other Race | 18 | 4.3% |
| Total | 424 | 100.0% |
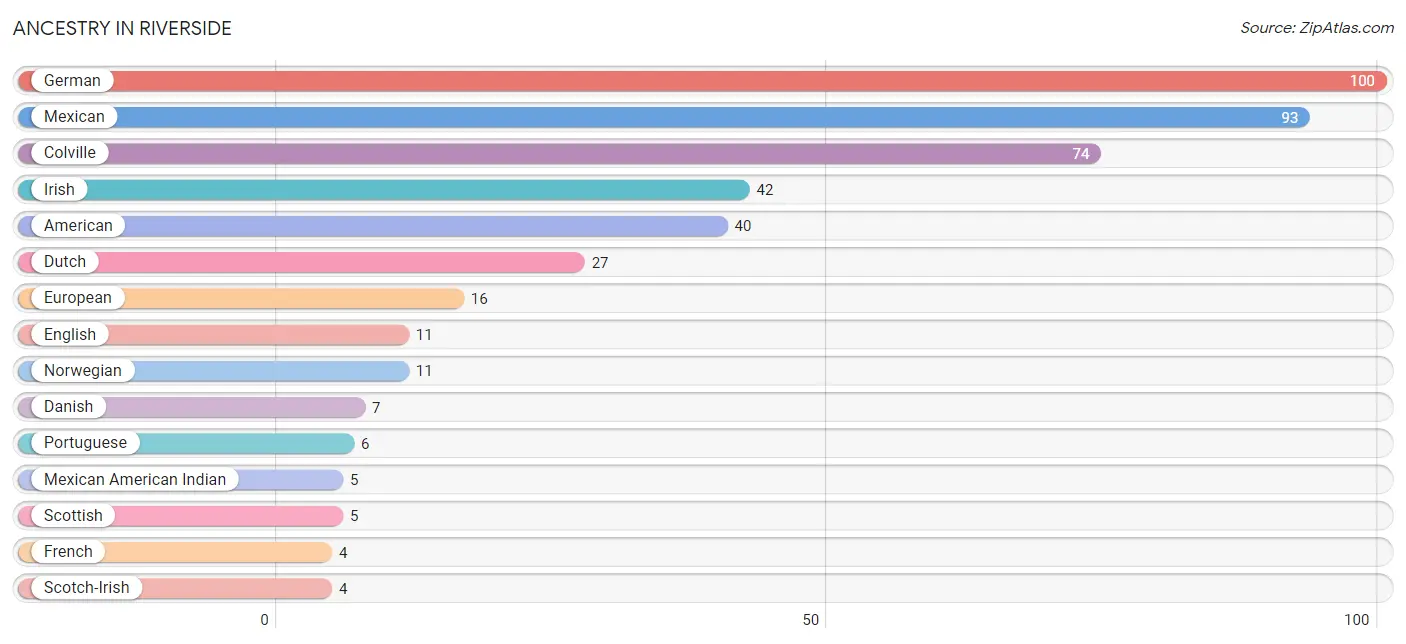
Ancestry in Riverside
The most populous ancestries reported in Riverside are German (100 | 23.6%), Mexican (93 | 21.9%), Colville (74 | 17.4%), Irish (42 | 9.9%), and American (40 | 9.4%), together accounting for 82.3% of all Riverside residents.
| Ancestry | # Population | % Population |
| American | 40 | 9.4% |
| Burmese | 3 | 0.7% |
| Colville | 74 | 17.4% |
| Danish | 7 | 1.7% |
| Dutch | 27 | 6.4% |
| English | 11 | 2.6% |
| European | 16 | 3.8% |
| Finnish | 1 | 0.2% |
| French | 4 | 0.9% |
| German | 100 | 23.6% |
| Irish | 42 | 9.9% |
| Italian | 3 | 0.7% |
| Mexican | 93 | 21.9% |
| Mexican American Indian | 5 | 1.2% |
| Norwegian | 11 | 2.6% |
| Polish | 2 | 0.5% |
| Portuguese | 6 | 1.4% |
| Pueblo | 2 | 0.5% |
| Scotch-Irish | 4 | 0.9% |
| Scottish | 5 | 1.2% |
| Swedish | 1 | 0.2% |
| Yakama | 4 | 0.9% | View All 22 Rows |
Immigrants in Riverside
The most numerous immigrant groups reported in Riverside came from Central America (7 | 1.7%), Latin America (7 | 1.7%), Mexico (7 | 1.7%), Europe (4 | 0.9%), and Germany (4 | 0.9%), together accounting for 6.8% of all Riverside residents.
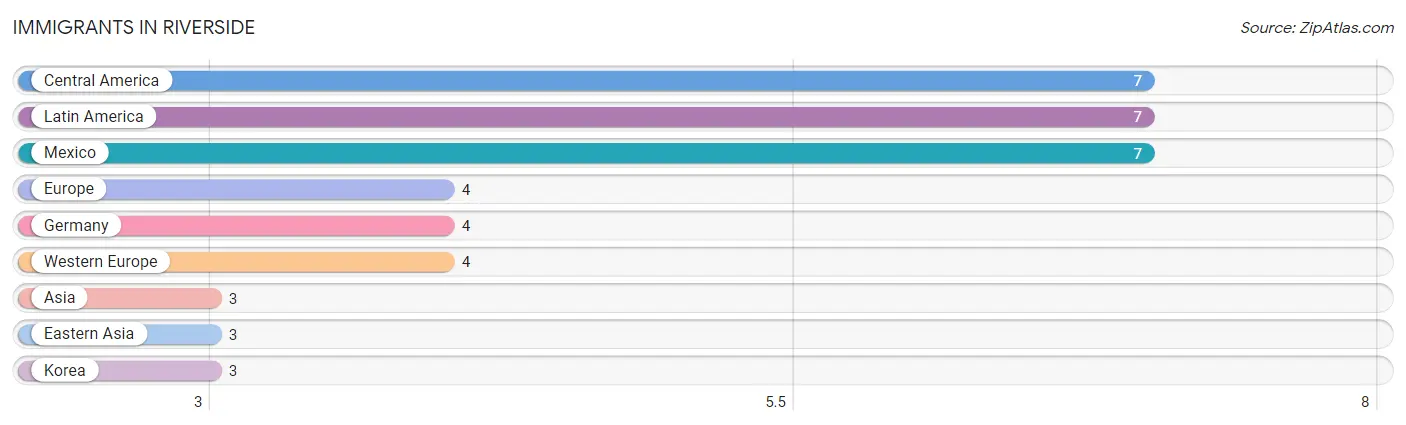
| Immigration Origin | # Population | % Population |
| Asia | 3 | 0.7% |
| Central America | 7 | 1.7% |
| Eastern Asia | 3 | 0.7% |
| Europe | 4 | 0.9% |
| Germany | 4 | 0.9% |
| Korea | 3 | 0.7% |
| Latin America | 7 | 1.7% |
| Mexico | 7 | 1.7% |
| Western Europe | 4 | 0.9% | View All 9 Rows |
Sex and Age in Riverside
Sex and Age in Riverside
The most populous age groups in Riverside are 5 to 9 Years (34 | 16.0%) for men and 10 to 14 Years (39 | 18.5%) for women.
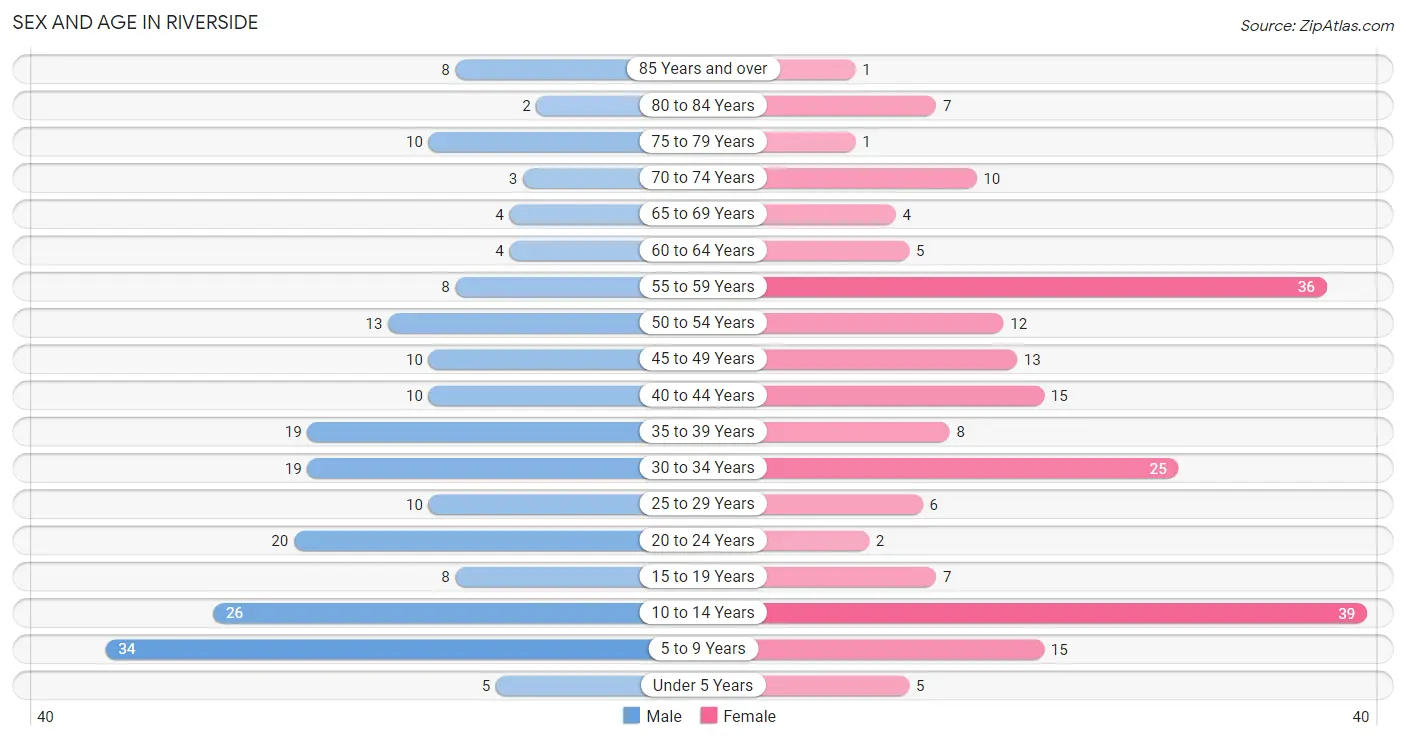
| Age Bracket | Male | Female |
| Under 5 Years | 5 (2.4%) | 5 (2.4%) |
| 5 to 9 Years | 34 (16.0%) | 15 (7.1%) |
| 10 to 14 Years | 26 (12.2%) | 39 (18.5%) |
| 15 to 19 Years | 8 (3.8%) | 7 (3.3%) |
| 20 to 24 Years | 20 (9.4%) | 2 (0.9%) |
| 25 to 29 Years | 10 (4.7%) | 6 (2.8%) |
| 30 to 34 Years | 19 (8.9%) | 25 (11.8%) |
| 35 to 39 Years | 19 (8.9%) | 8 (3.8%) |
| 40 to 44 Years | 10 (4.7%) | 15 (7.1%) |
| 45 to 49 Years | 10 (4.7%) | 13 (6.2%) |
| 50 to 54 Years | 13 (6.1%) | 12 (5.7%) |
| 55 to 59 Years | 8 (3.8%) | 36 (17.1%) |
| 60 to 64 Years | 4 (1.9%) | 5 (2.4%) |
| 65 to 69 Years | 4 (1.9%) | 4 (1.9%) |
| 70 to 74 Years | 3 (1.4%) | 10 (4.7%) |
| 75 to 79 Years | 10 (4.7%) | 1 (0.5%) |
| 80 to 84 Years | 2 (0.9%) | 7 (3.3%) |
| 85 Years and over | 8 (3.8%) | 1 (0.5%) |
| Total | 213 (100.0%) | 211 (100.0%) |
Families and Households in Riverside
Median Family Size in Riverside
The median family size in Riverside is 2.71 persons per family, with married-couple families (45 | 36.3%) accounting for the largest median family size of 3.13 persons per family. On the other hand, single male/father families (12 | 9.7%) represent the smallest median family size with 2.33 persons per family.
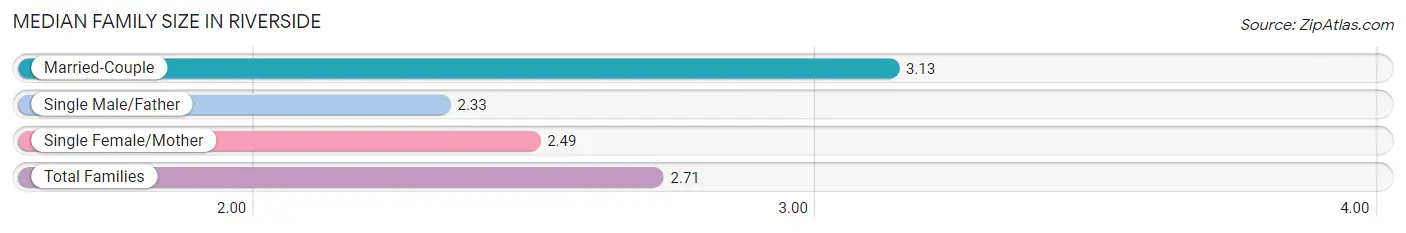
| Family Type | # Families | Family Size |
| Married-Couple | 45 (36.3%) | 3.13 |
| Single Male/Father | 12 (9.7%) | 2.33 |
| Single Female/Mother | 67 (54.0%) | 2.49 |
| Total Families | 124 (100.0%) | 2.71 |
Median Household Size in Riverside
The median household size in Riverside is 2.45 persons per household, with married-couple households (45 | 26.0%) accounting for the largest median household size of 3.24 persons per household. non-family households (49 | 28.3%) represent the smallest median household size with 1.35 persons per household.
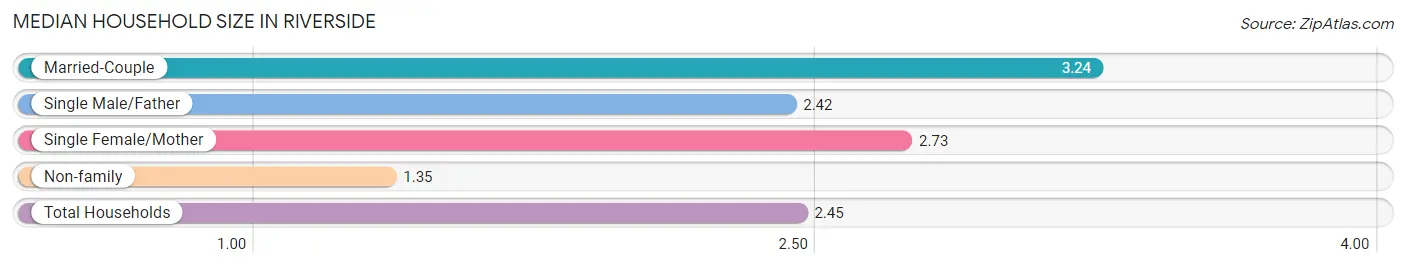
| Household Type | # Households | Household Size |
| Married-Couple | 45 (26.0%) | 3.24 |
| Single Male/Father | 12 (6.9%) | 2.42 |
| Single Female/Mother | 67 (38.7%) | 2.73 |
| Non-family | 49 (28.3%) | 1.35 |
| Total Households | 173 (100.0%) | 2.45 |
Household Size by Marriage Status in Riverside
Out of a total of 173 households in Riverside, 124 (71.7%) are family households, while 49 (28.3%) are nonfamily households. The most numerous type of family households are 2-person households, comprising 52, and the most common type of nonfamily households are 1-person households, comprising 36.
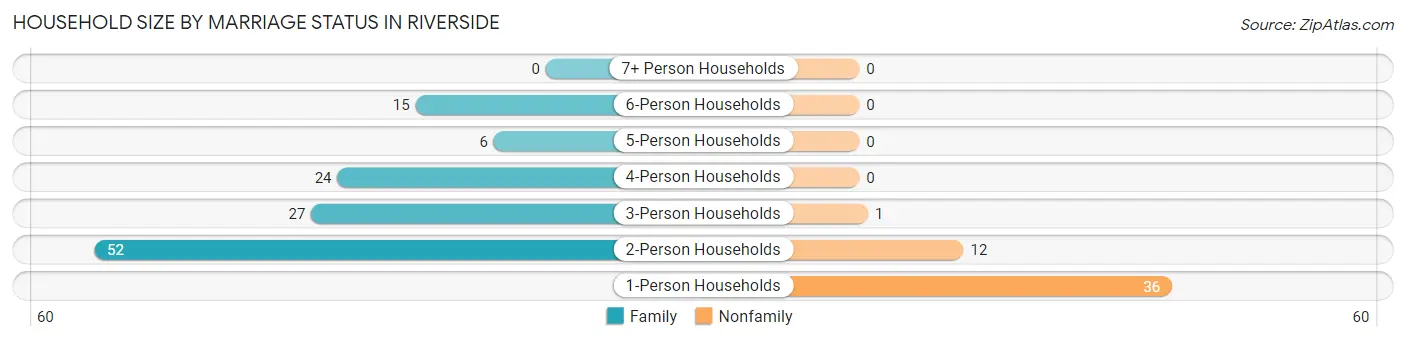
| Household Size | Family Households | Nonfamily Households |
| 1-Person Households | - | 36 (20.8%) |
| 2-Person Households | 52 (30.1%) | 12 (6.9%) |
| 3-Person Households | 27 (15.6%) | 1 (0.6%) |
| 4-Person Households | 24 (13.9%) | 0 (0.0%) |
| 5-Person Households | 6 (3.5%) | 0 (0.0%) |
| 6-Person Households | 15 (8.7%) | 0 (0.0%) |
| 7+ Person Households | 0 (0.0%) | 0 (0.0%) |
| Total | 124 (71.7%) | 49 (28.3%) |
Female Fertility in Riverside
Fertility by Age in Riverside
Average fertility rate in Riverside is 13.0 births per 1,000 women. Women in the age bracket of 20 to 34 years have the highest fertility rate with 30.0 births per 1,000 women. Women in the age bracket of 20 to 34 years acount for 100.0% of all women with births.
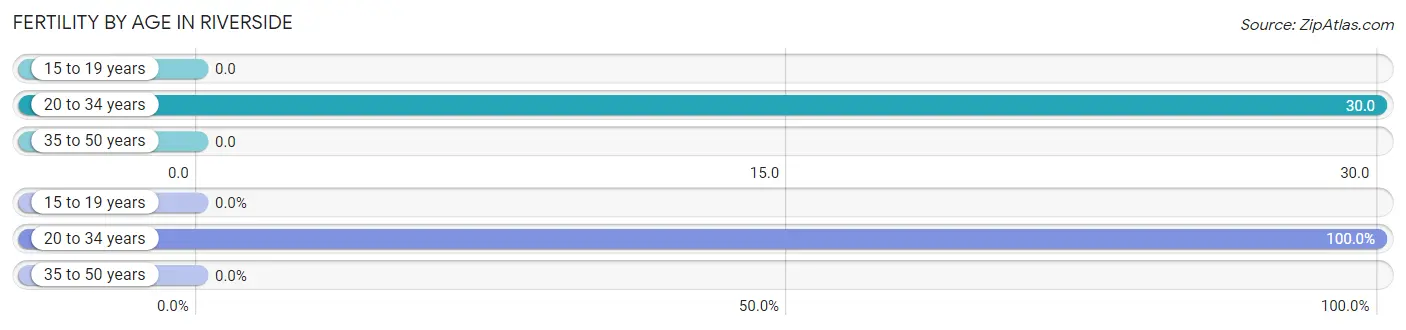
| Age Bracket | Women with Births | Births / 1,000 Women |
| 15 to 19 years | 0 (0.0%) | 0.0 |
| 20 to 34 years | 1 (100.0%) | 30.0 |
| 35 to 50 years | 0 (0.0%) | 0.0 |
| Total | 1 (100.0%) | 13.0 |
Fertility by Age by Marriage Status in Riverside
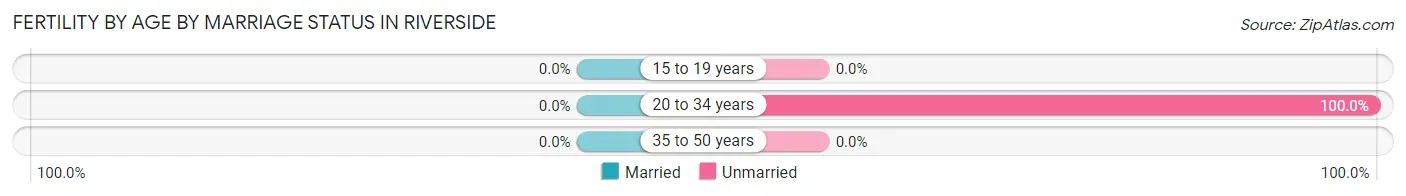
| Age Bracket | Married | Unmarried |
| 15 to 19 years | 0 (0.0%) | 0 (0.0%) |
| 20 to 34 years | 0 (0.0%) | 1 (100.0%) |
| 35 to 50 years | 0 (0.0%) | 0 (0.0%) |
| Total | 0 (0.0%) | 1 (100.0%) |
Fertility by Education in Riverside
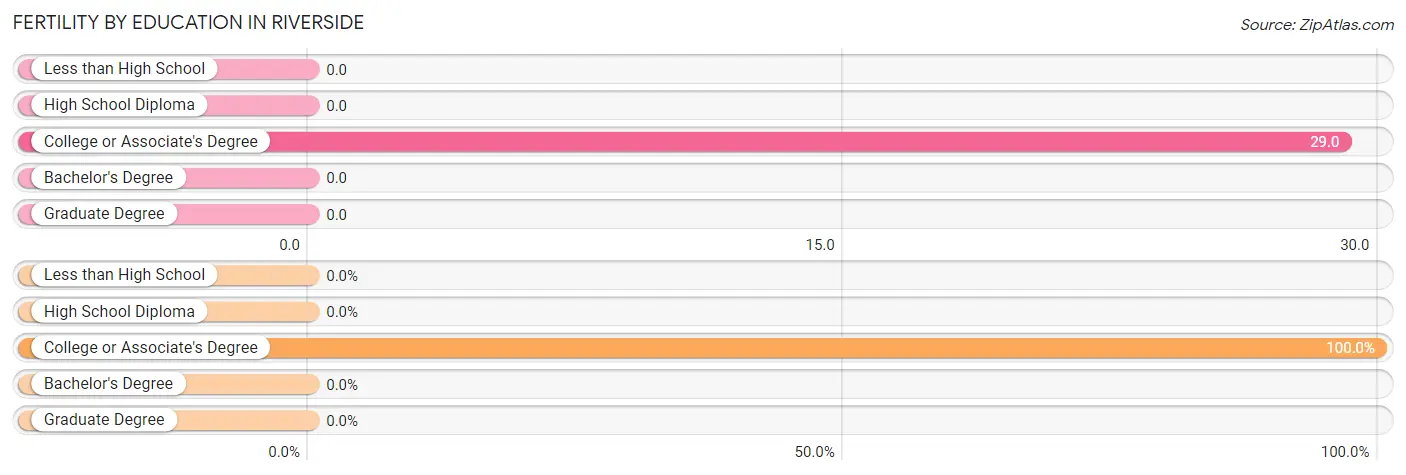
| Educational Attainment | Women with Births | Births / 1,000 Women |
| Less than High School | 0 (0.0%) | 0.0 |
| High School Diploma | 0 (0.0%) | 0.0 |
| College or Associate's Degree | 1 (100.0%) | 29.0 |
| Bachelor's Degree | 0 (0.0%) | 0.0 |
| Graduate Degree | 0 (0.0%) | 0.0 |
| Total | 1 (100.0%) | 13.0 |
Fertility by Education by Marriage Status in Riverside
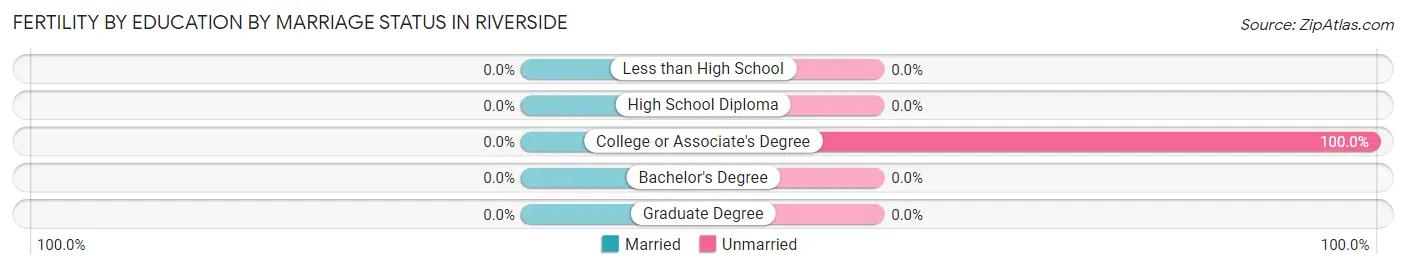
| Educational Attainment | Married | Unmarried |
| Less than High School | 0 (0.0%) | 0 (0.0%) |
| High School Diploma | 0 (0.0%) | 0 (0.0%) |
| College or Associate's Degree | 0 (0.0%) | 1 (100.0%) |
| Bachelor's Degree | 0 (0.0%) | 0 (0.0%) |
| Graduate Degree | 0 (0.0%) | 0 (0.0%) |
| Total | 0 (0.0%) | 1 (100.0%) |
Employment Characteristics in Riverside
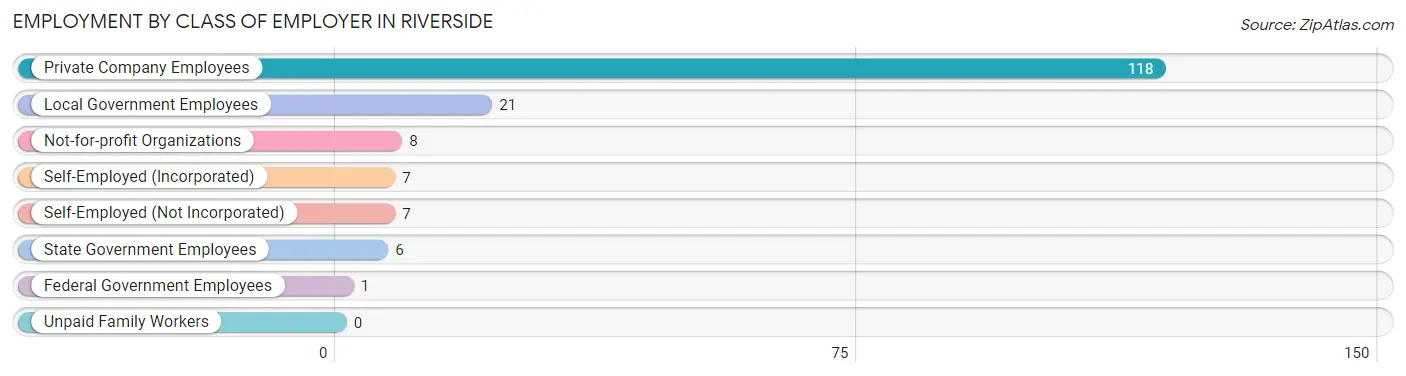
Employment by Class of Employer in Riverside
Among the 168 employed individuals in Riverside, private company employees (118 | 70.2%), local government employees (21 | 12.5%), and not-for-profit organizations (8 | 4.8%) make up the most common classes of employment.
| Employer Class | # Employees | % Employees |
| Private Company Employees | 118 | 70.2% |
| Self-Employed (Incorporated) | 7 | 4.2% |
| Self-Employed (Not Incorporated) | 7 | 4.2% |
| Not-for-profit Organizations | 8 | 4.8% |
| Local Government Employees | 21 | 12.5% |
| State Government Employees | 6 | 3.6% |
| Federal Government Employees | 1 | 0.6% |
| Unpaid Family Workers | 0 | 0.0% |
| Total | 168 | 100.0% |
Employment Status by Age in Riverside
According to the labor force statistics for Riverside, out of the total population over 16 years of age (297), 60.6% or 180 individuals are in the labor force, with 6.1% or 11 of them unemployed. The age group with the highest labor force participation rate is 20 to 24 years, with 100.0% or 22 individuals in the labor force. Within the labor force, the 30 to 34 years age range has the highest percentage of unemployed individuals, with 12.8% or 5 of them being unemployed.
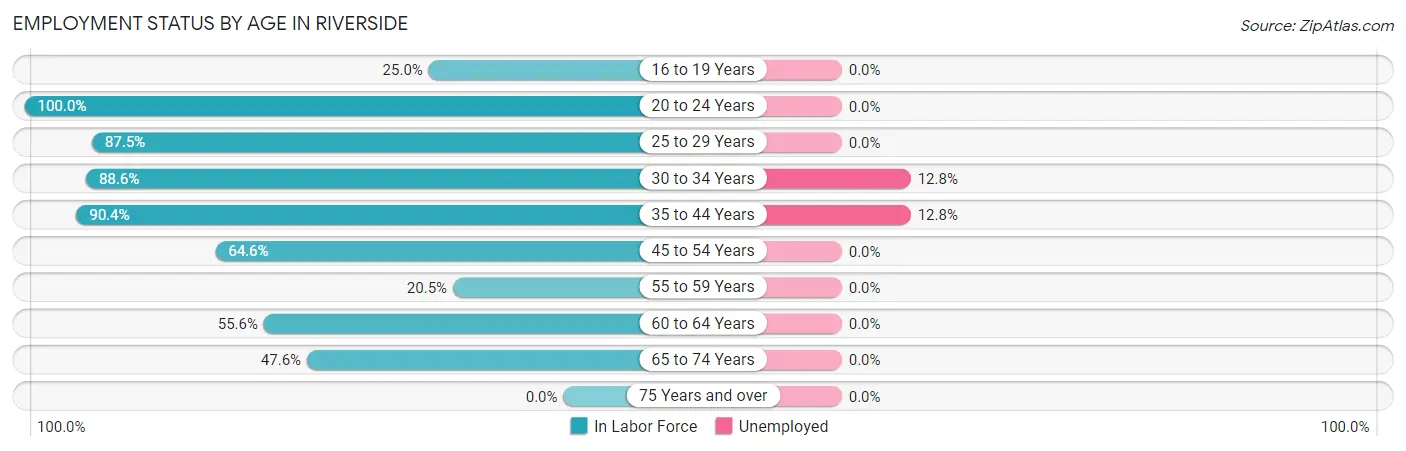
| Age Bracket | In Labor Force | Unemployed |
| 16 to 19 Years | 3 (25.0%) | 0 (0.0%) |
| 20 to 24 Years | 22 (100.0%) | 0 (0.0%) |
| 25 to 29 Years | 14 (87.5%) | 0 (0.0%) |
| 30 to 34 Years | 39 (88.6%) | 5 (12.8%) |
| 35 to 44 Years | 47 (90.4%) | 6 (12.8%) |
| 45 to 54 Years | 31 (64.6%) | 0 (0.0%) |
| 55 to 59 Years | 9 (20.5%) | 0 (0.0%) |
| 60 to 64 Years | 5 (55.6%) | 0 (0.0%) |
| 65 to 74 Years | 10 (47.6%) | 0 (0.0%) |
| 75 Years and over | 0 (0.0%) | 0 (0.0%) |
| Total | 180 (60.6%) | 11 (6.1%) |
Employment Status by Educational Attainment in Riverside
According to labor force statistics for Riverside, 68.1% of individuals (145) out of the total population between 25 and 64 years of age (213) are in the labor force, with 7.6% or 11 of them being unemployed. The group with the highest labor force participation rate are those with the educational attainment of less than high school, with 88.6% or 31 individuals in the labor force. Within the labor force, individuals with high school diploma education have the highest percentage of unemployment, with 16.4% or 9 of them being unemployed.
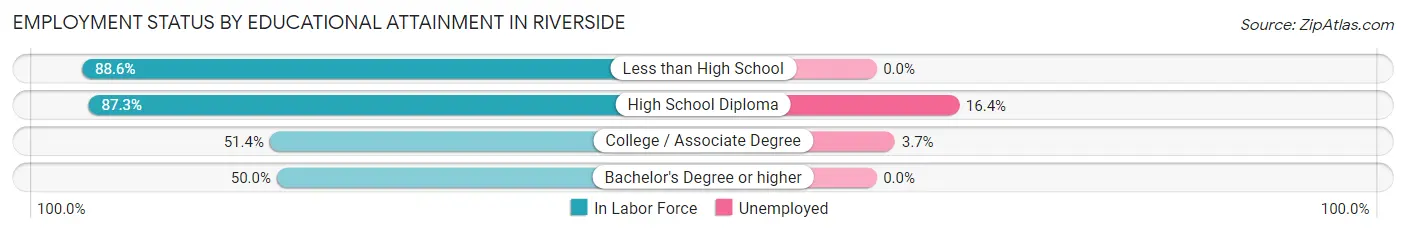
| Educational Attainment | In Labor Force | Unemployed |
| Less than High School | 31 (88.6%) | 0 (0.0%) |
| High School Diploma | 55 (87.3%) | 10 (16.4%) |
| College / Associate Degree | 54 (51.4%) | 4 (3.7%) |
| Bachelor's Degree or higher | 5 (50.0%) | 0 (0.0%) |
| Total | 145 (68.1%) | 16 (7.6%) |
Employment Occupations by Sex in Riverside
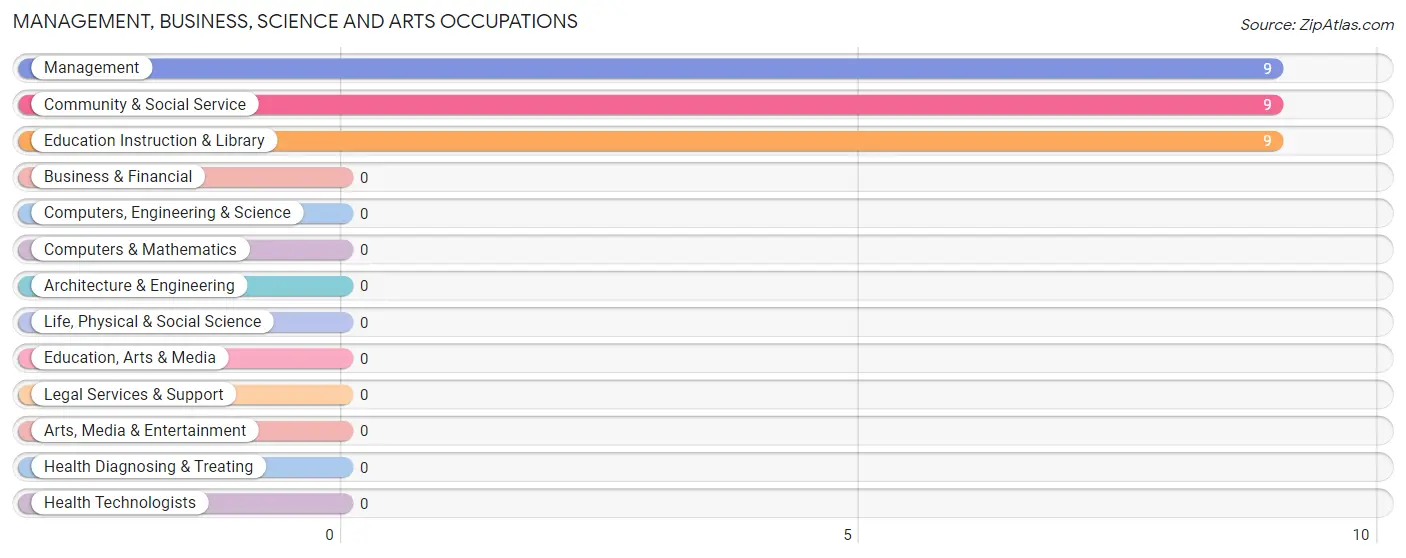
Management, Business, Science and Arts Occupations
The most common Management, Business, Science and Arts occupations in Riverside are Management (9 | 5.3%), Community & Social Service (9 | 5.3%), and Education Instruction & Library (9 | 5.3%).
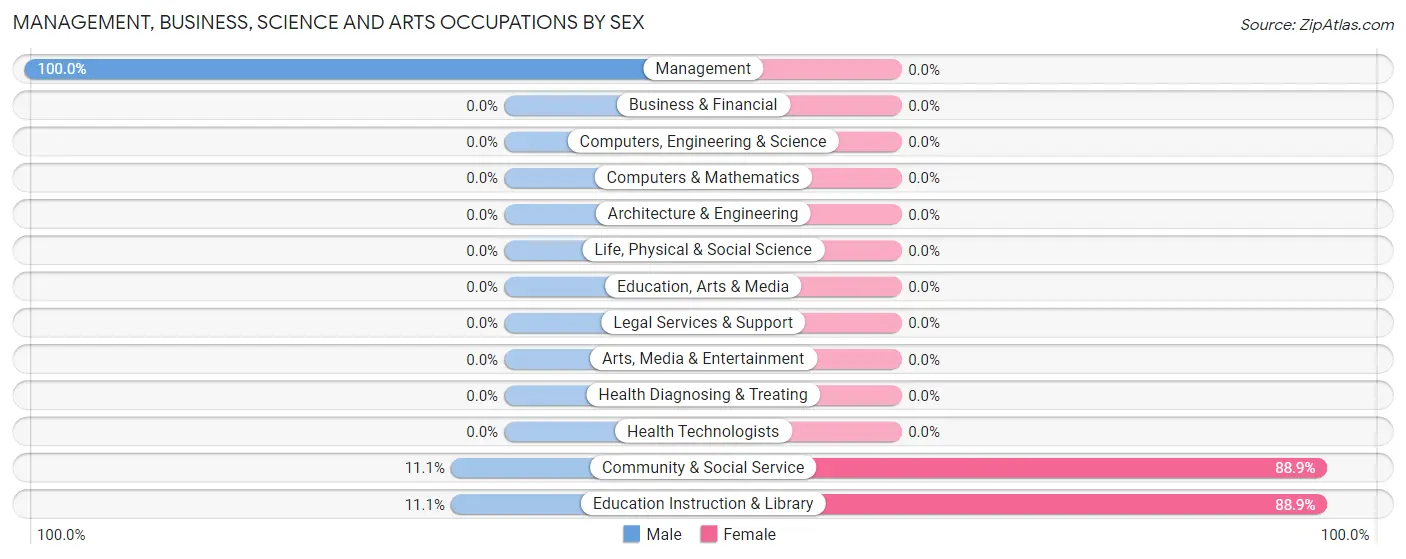
Management, Business, Science and Arts Occupations by Sex
Within the Management, Business, Science and Arts occupations in Riverside, the most male-oriented occupations are Management (100.0%), Community & Social Service (11.1%), and Education Instruction & Library (11.1%), while the most female-oriented occupations are Community & Social Service (88.9%), and Education Instruction & Library (88.9%).
| Occupation | Male | Female |
| Management | 9 (100.0%) | 0 (0.0%) |
| Business & Financial | 0 (0.0%) | 0 (0.0%) |
| Computers, Engineering & Science | 0 (0.0%) | 0 (0.0%) |
| Computers & Mathematics | 0 (0.0%) | 0 (0.0%) |
| Architecture & Engineering | 0 (0.0%) | 0 (0.0%) |
| Life, Physical & Social Science | 0 (0.0%) | 0 (0.0%) |
| Community & Social Service | 1 (11.1%) | 8 (88.9%) |
| Education, Arts & Media | 0 (0.0%) | 0 (0.0%) |
| Legal Services & Support | 0 (0.0%) | 0 (0.0%) |
| Education Instruction & Library | 1 (11.1%) | 8 (88.9%) |
| Arts, Media & Entertainment | 0 (0.0%) | 0 (0.0%) |
| Health Diagnosing & Treating | 0 (0.0%) | 0 (0.0%) |
| Health Technologists | 0 (0.0%) | 0 (0.0%) |
| Total (Category) | 10 (55.6%) | 8 (44.4%) |
| Total (Overall) | 102 (60.4%) | 67 (39.6%) |
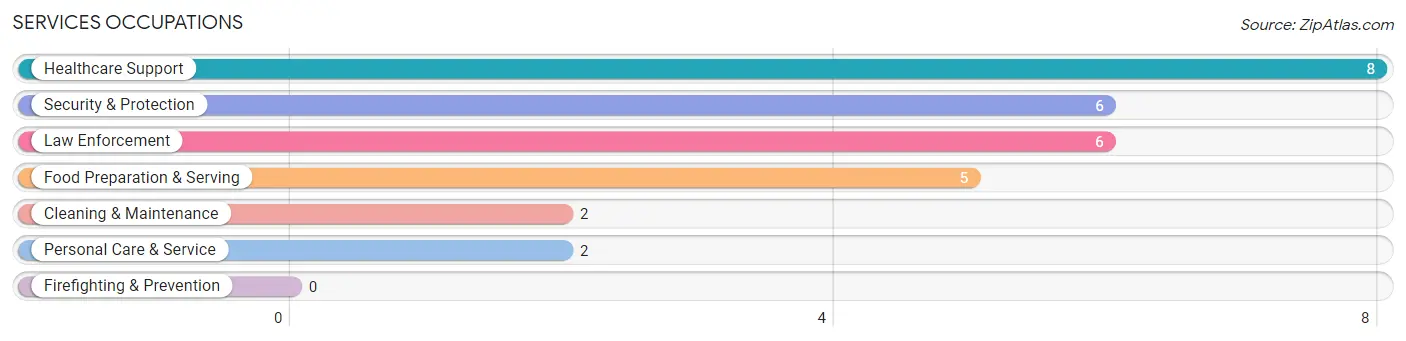
Services Occupations
The most common Services occupations in Riverside are Healthcare Support (8 | 4.7%), Security & Protection (6 | 3.5%), Law Enforcement (6 | 3.5%), Food Preparation & Serving (5 | 3.0%), and Cleaning & Maintenance (2 | 1.2%).
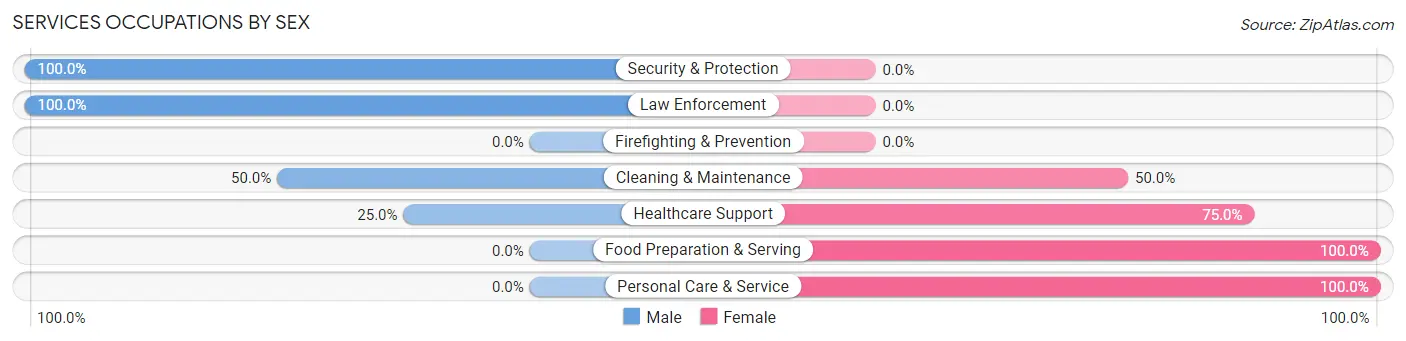
Services Occupations by Sex
Within the Services occupations in Riverside, the most male-oriented occupations are Security & Protection (100.0%), Law Enforcement (100.0%), and Cleaning & Maintenance (50.0%), while the most female-oriented occupations are Food Preparation & Serving (100.0%), Personal Care & Service (100.0%), and Healthcare Support (75.0%).
| Occupation | Male | Female |
| Healthcare Support | 2 (25.0%) | 6 (75.0%) |
| Security & Protection | 6 (100.0%) | 0 (0.0%) |
| Firefighting & Prevention | 0 (0.0%) | 0 (0.0%) |
| Law Enforcement | 6 (100.0%) | 0 (0.0%) |
| Food Preparation & Serving | 0 (0.0%) | 5 (100.0%) |
| Cleaning & Maintenance | 1 (50.0%) | 1 (50.0%) |
| Personal Care & Service | 0 (0.0%) | 2 (100.0%) |
| Total (Category) | 9 (39.1%) | 14 (60.9%) |
| Total (Overall) | 102 (60.4%) | 67 (39.6%) |
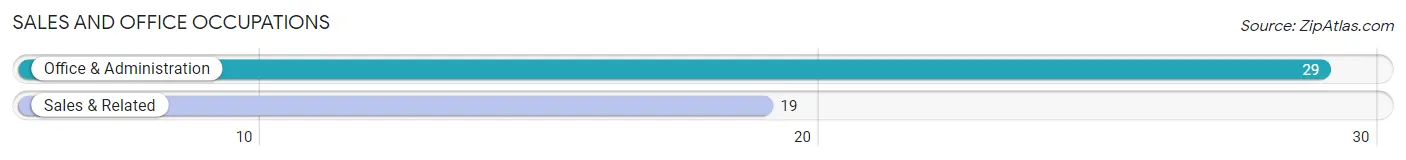
Sales and Office Occupations
The most common Sales and Office occupations in Riverside are Office & Administration (29 | 17.2%), and Sales & Related (19 | 11.2%).
Sales and Office Occupations by Sex
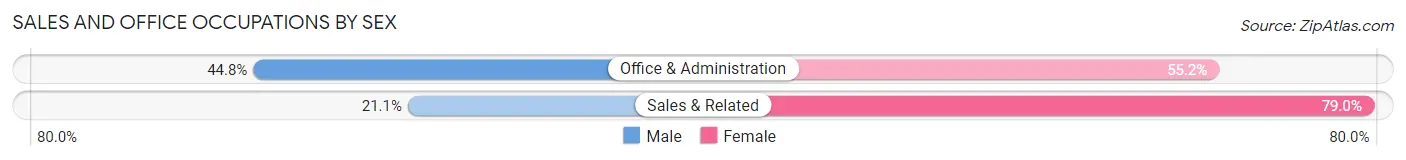
| Occupation | Male | Female |
| Sales & Related | 4 (21.0%) | 15 (78.9%) |
| Office & Administration | 13 (44.8%) | 16 (55.2%) |
| Total (Category) | 17 (35.4%) | 31 (64.6%) |
| Total (Overall) | 102 (60.4%) | 67 (39.6%) |
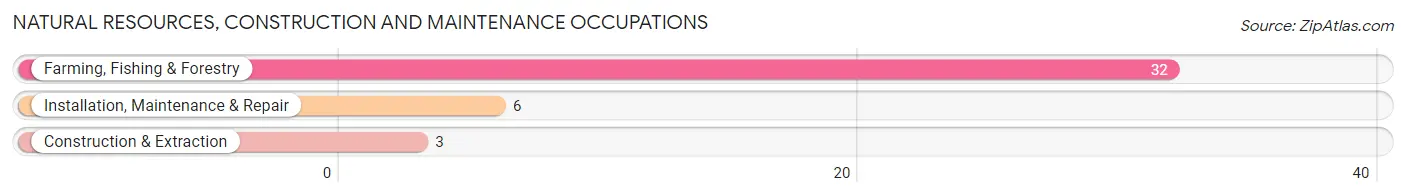
Natural Resources, Construction and Maintenance Occupations
The most common Natural Resources, Construction and Maintenance occupations in Riverside are Farming, Fishing & Forestry (32 | 18.9%), Installation, Maintenance & Repair (6 | 3.5%), and Construction & Extraction (3 | 1.8%).
Natural Resources, Construction and Maintenance Occupations by Sex
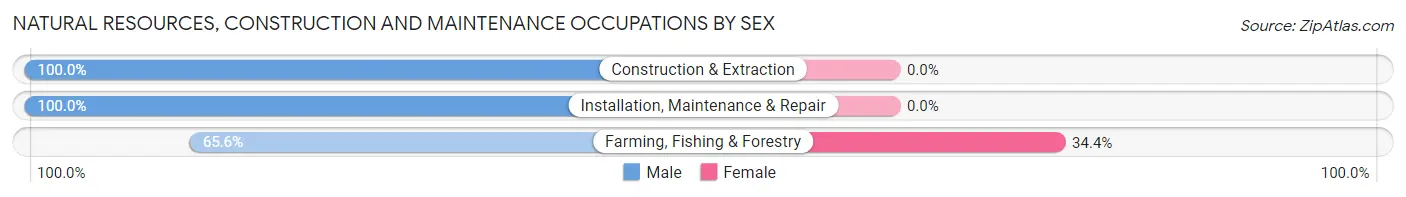
| Occupation | Male | Female |
| Farming, Fishing & Forestry | 21 (65.6%) | 11 (34.4%) |
| Construction & Extraction | 3 (100.0%) | 0 (0.0%) |
| Installation, Maintenance & Repair | 6 (100.0%) | 0 (0.0%) |
| Total (Category) | 30 (73.2%) | 11 (26.8%) |
| Total (Overall) | 102 (60.4%) | 67 (39.6%) |
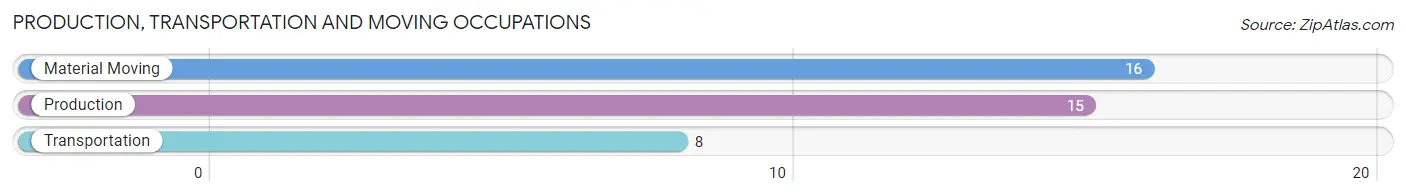
Production, Transportation and Moving Occupations
The most common Production, Transportation and Moving occupations in Riverside are Material Moving (16 | 9.5%), Production (15 | 8.9%), and Transportation (8 | 4.7%).
Production, Transportation and Moving Occupations by Sex
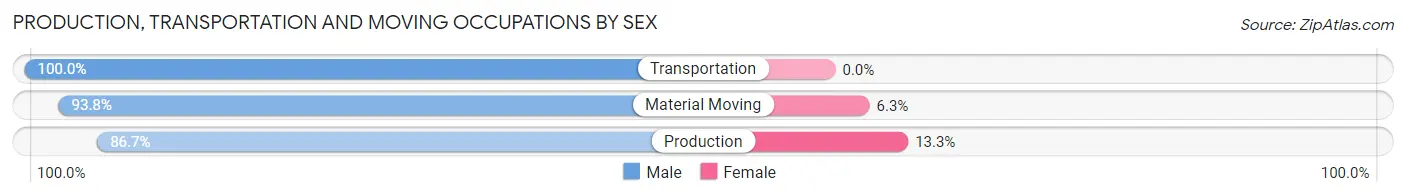
| Occupation | Male | Female |
| Production | 13 (86.7%) | 2 (13.3%) |
| Transportation | 8 (100.0%) | 0 (0.0%) |
| Material Moving | 15 (93.8%) | 1 (6.2%) |
| Total (Category) | 36 (92.3%) | 3 (7.7%) |
| Total (Overall) | 102 (60.4%) | 67 (39.6%) |
Employment Industries by Sex in Riverside
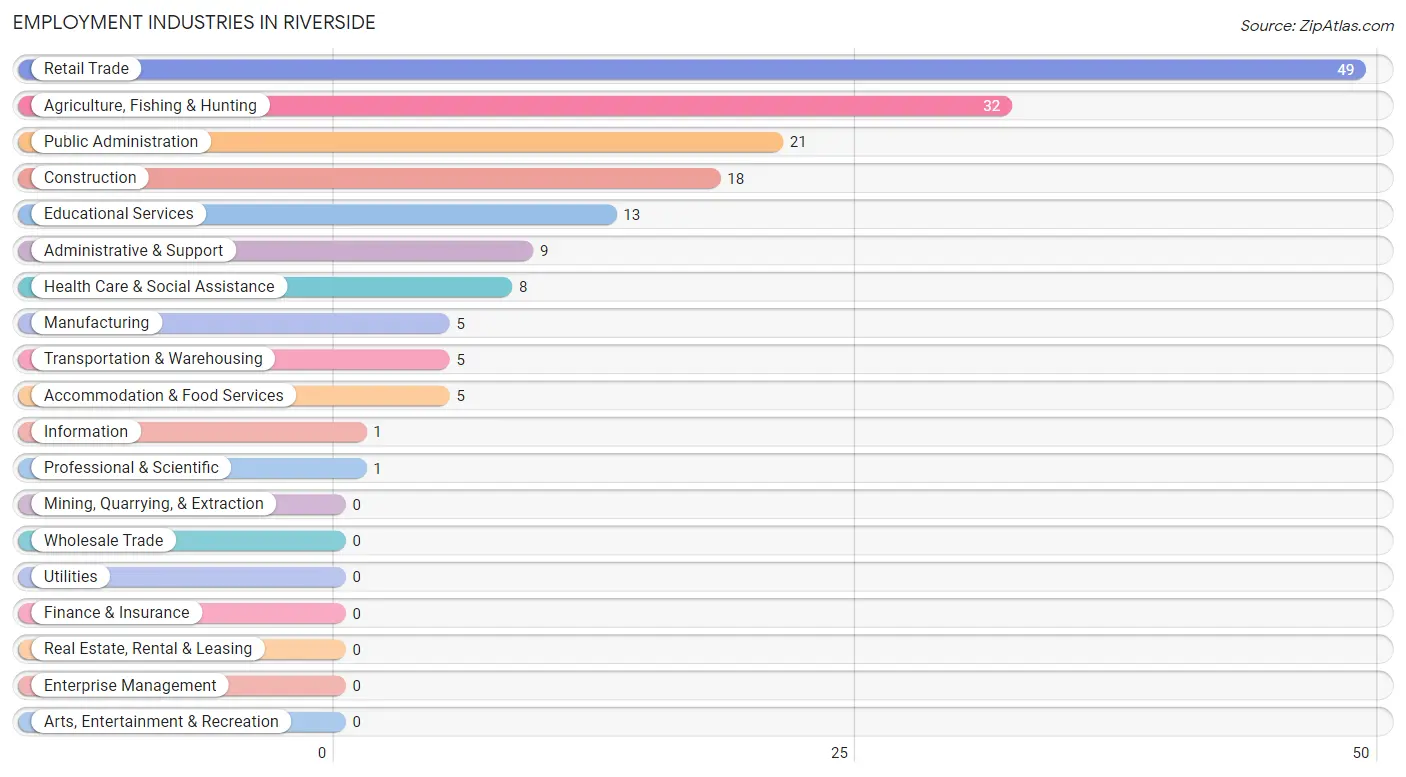
Employment Industries in Riverside
The major employment industries in Riverside include Retail Trade (49 | 29.0%), Agriculture, Fishing & Hunting (32 | 18.9%), Public Administration (21 | 12.4%), Construction (18 | 10.6%), and Educational Services (13 | 7.7%).
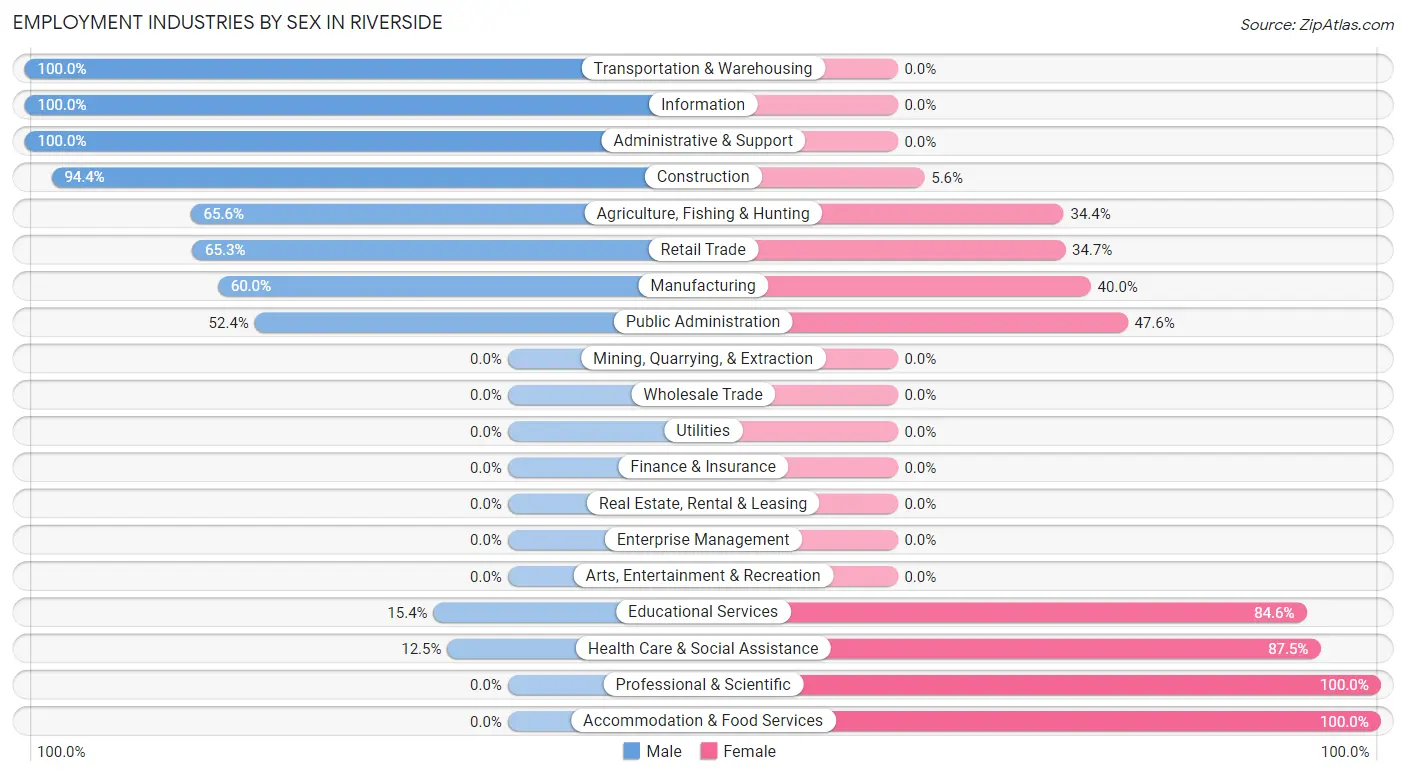
Employment Industries by Sex in Riverside
The Riverside industries that see more men than women are Transportation & Warehousing (100.0%), Information (100.0%), and Administrative & Support (100.0%), whereas the industries that tend to have a higher number of women are Professional & Scientific (100.0%), Accommodation & Food Services (100.0%), and Health Care & Social Assistance (87.5%).
| Industry | Male | Female |
| Agriculture, Fishing & Hunting | 21 (65.6%) | 11 (34.4%) |
| Mining, Quarrying, & Extraction | 0 (0.0%) | 0 (0.0%) |
| Construction | 17 (94.4%) | 1 (5.6%) |
| Manufacturing | 3 (60.0%) | 2 (40.0%) |
| Wholesale Trade | 0 (0.0%) | 0 (0.0%) |
| Retail Trade | 32 (65.3%) | 17 (34.7%) |
| Transportation & Warehousing | 5 (100.0%) | 0 (0.0%) |
| Utilities | 0 (0.0%) | 0 (0.0%) |
| Information | 1 (100.0%) | 0 (0.0%) |
| Finance & Insurance | 0 (0.0%) | 0 (0.0%) |
| Real Estate, Rental & Leasing | 0 (0.0%) | 0 (0.0%) |
| Professional & Scientific | 0 (0.0%) | 1 (100.0%) |
| Enterprise Management | 0 (0.0%) | 0 (0.0%) |
| Administrative & Support | 9 (100.0%) | 0 (0.0%) |
| Educational Services | 2 (15.4%) | 11 (84.6%) |
| Health Care & Social Assistance | 1 (12.5%) | 7 (87.5%) |
| Arts, Entertainment & Recreation | 0 (0.0%) | 0 (0.0%) |
| Accommodation & Food Services | 0 (0.0%) | 5 (100.0%) |
| Public Administration | 11 (52.4%) | 10 (47.6%) |
| Total | 102 (60.4%) | 67 (39.6%) |
Education in Riverside
School Enrollment in Riverside
The most common levels of schooling among the 135 students in Riverside are middle school (64 | 47.4%), kindergarten (23 | 17.0%), and elementary school (19 | 14.1%).
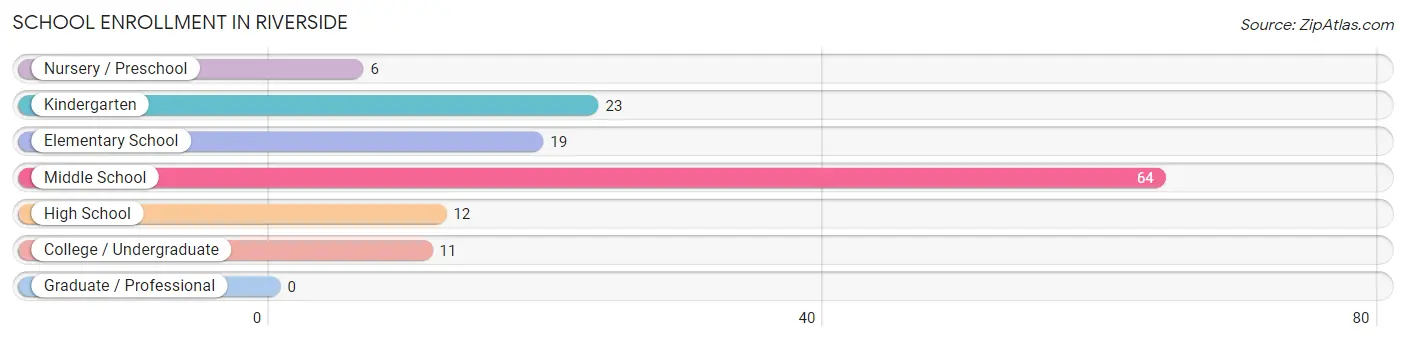
| School Level | # Students | % Students |
| Nursery / Preschool | 6 | 4.4% |
| Kindergarten | 23 | 17.0% |
| Elementary School | 19 | 14.1% |
| Middle School | 64 | 47.4% |
| High School | 12 | 8.9% |
| College / Undergraduate | 11 | 8.2% |
| Graduate / Professional | 0 | 0.0% |
| Total | 135 | 100.0% |
School Enrollment by Age by Funding Source in Riverside
Out of a total of 135 students who are enrolled in schools in Riverside, 20 (14.8%) attend a private institution, while the remaining 115 (85.2%) are enrolled in public schools. The age group of 5 to 9 year old has the highest likelihood of being enrolled in private schools, with 14 (29.8% in the age bracket) enrolled. Conversely, the age group of 15 to 17 year olds has the lowest likelihood of being enrolled in a private school, with 8 (100.0% in the age bracket) attending a public institution.
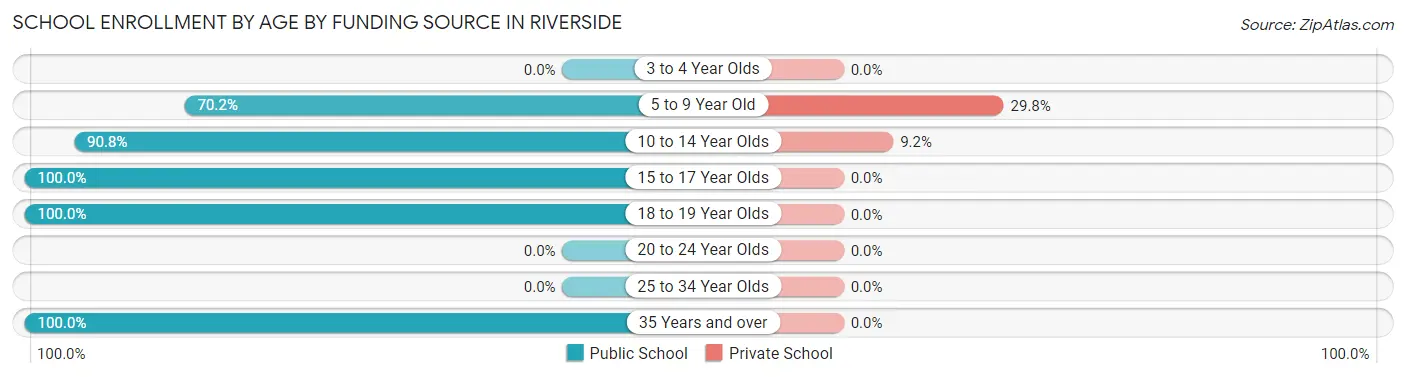
| Age Bracket | Public School | Private School |
| 3 to 4 Year Olds | 0 (0.0%) | 0 (0.0%) |
| 5 to 9 Year Old | 33 (70.2%) | 14 (29.8%) |
| 10 to 14 Year Olds | 59 (90.8%) | 6 (9.2%) |
| 15 to 17 Year Olds | 8 (100.0%) | 0 (0.0%) |
| 18 to 19 Year Olds | 4 (100.0%) | 0 (0.0%) |
| 20 to 24 Year Olds | 0 (0.0%) | 0 (0.0%) |
| 25 to 34 Year Olds | 0 (0.0%) | 0 (0.0%) |
| 35 Years and over | 11 (100.0%) | 0 (0.0%) |
| Total | 115 (85.2%) | 20 (14.8%) |
Educational Attainment by Field of Study in Riverside
Business (5 | 33.3%), literature & languages (4 | 26.7%), liberal arts & history (4 | 26.7%), education (1 | 6.7%), and arts & humanities (1 | 6.7%) are the most common fields of study among 15 individuals in Riverside who have obtained a bachelor's degree or higher.
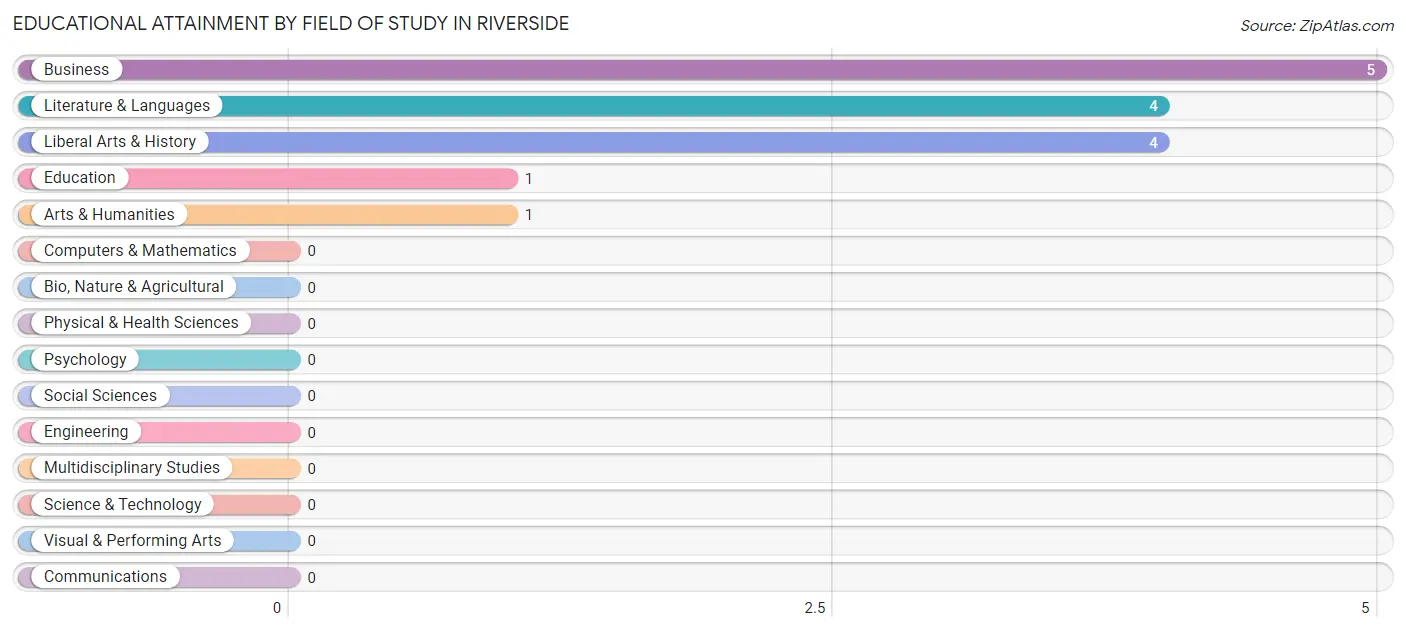
| Field of Study | # Graduates | % Graduates |
| Computers & Mathematics | 0 | 0.0% |
| Bio, Nature & Agricultural | 0 | 0.0% |
| Physical & Health Sciences | 0 | 0.0% |
| Psychology | 0 | 0.0% |
| Social Sciences | 0 | 0.0% |
| Engineering | 0 | 0.0% |
| Multidisciplinary Studies | 0 | 0.0% |
| Science & Technology | 0 | 0.0% |
| Business | 5 | 33.3% |
| Education | 1 | 6.7% |
| Literature & Languages | 4 | 26.7% |
| Liberal Arts & History | 4 | 26.7% |
| Visual & Performing Arts | 0 | 0.0% |
| Communications | 0 | 0.0% |
| Arts & Humanities | 1 | 6.7% |
| Total | 15 | 100.0% |
Transportation & Commute in Riverside
Vehicle Availability by Sex in Riverside
The most prevalent vehicle ownership categories in Riverside are males with 2 vehicles (33, accounting for 32.7%) and females with 2 vehicles (22, making up 49.2%).
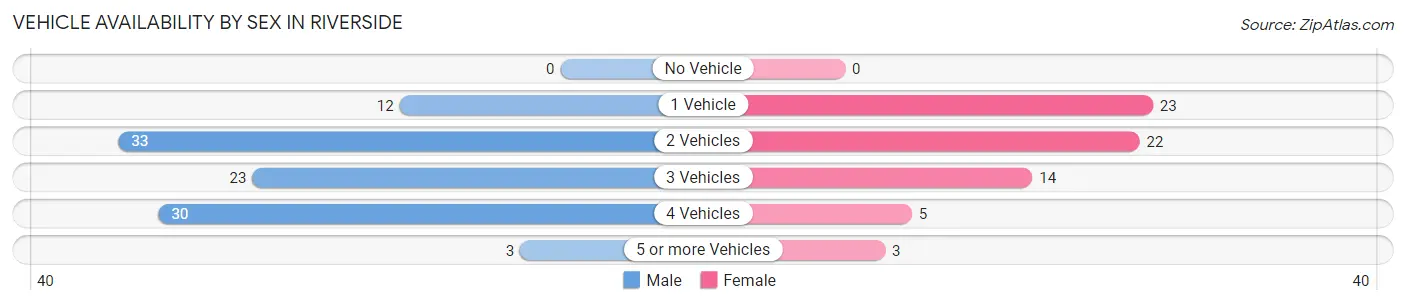
| Vehicles Available | Male | Female |
| No Vehicle | 0 (0.0%) | 0 (0.0%) |
| 1 Vehicle | 12 (11.9%) | 23 (34.3%) |
| 2 Vehicles | 33 (32.7%) | 22 (32.8%) |
| 3 Vehicles | 23 (22.8%) | 14 (20.9%) |
| 4 Vehicles | 30 (29.7%) | 5 (7.5%) |
| 5 or more Vehicles | 3 (3.0%) | 3 (4.5%) |
| Total | 101 (100.0%) | 67 (100.0%) |
Commute Time in Riverside
The most frequently occuring commute durations in Riverside are 15 to 19 minutes (62 commuters, 38.0%), 10 to 14 minutes (41 commuters, 25.2%), and 20 to 24 minutes (25 commuters, 15.3%).
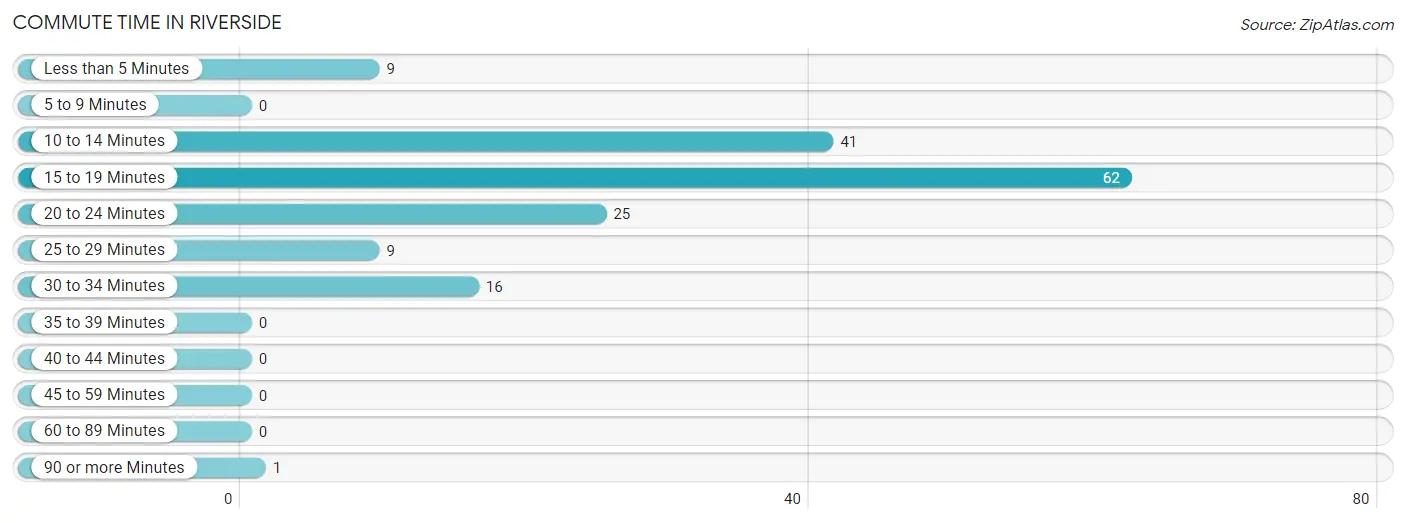
| Commute Time | # Commuters | % Commuters |
| Less than 5 Minutes | 9 | 5.5% |
| 5 to 9 Minutes | 0 | 0.0% |
| 10 to 14 Minutes | 41 | 25.2% |
| 15 to 19 Minutes | 62 | 38.0% |
| 20 to 24 Minutes | 25 | 15.3% |
| 25 to 29 Minutes | 9 | 5.5% |
| 30 to 34 Minutes | 16 | 9.8% |
| 35 to 39 Minutes | 0 | 0.0% |
| 40 to 44 Minutes | 0 | 0.0% |
| 45 to 59 Minutes | 0 | 0.0% |
| 60 to 89 Minutes | 0 | 0.0% |
| 90 or more Minutes | 1 | 0.6% |
Commute Time by Sex in Riverside
The most common commute times in Riverside are 15 to 19 minutes (45 commuters, 46.4%) for males and 10 to 14 minutes (18 commuters, 27.3%) for females.
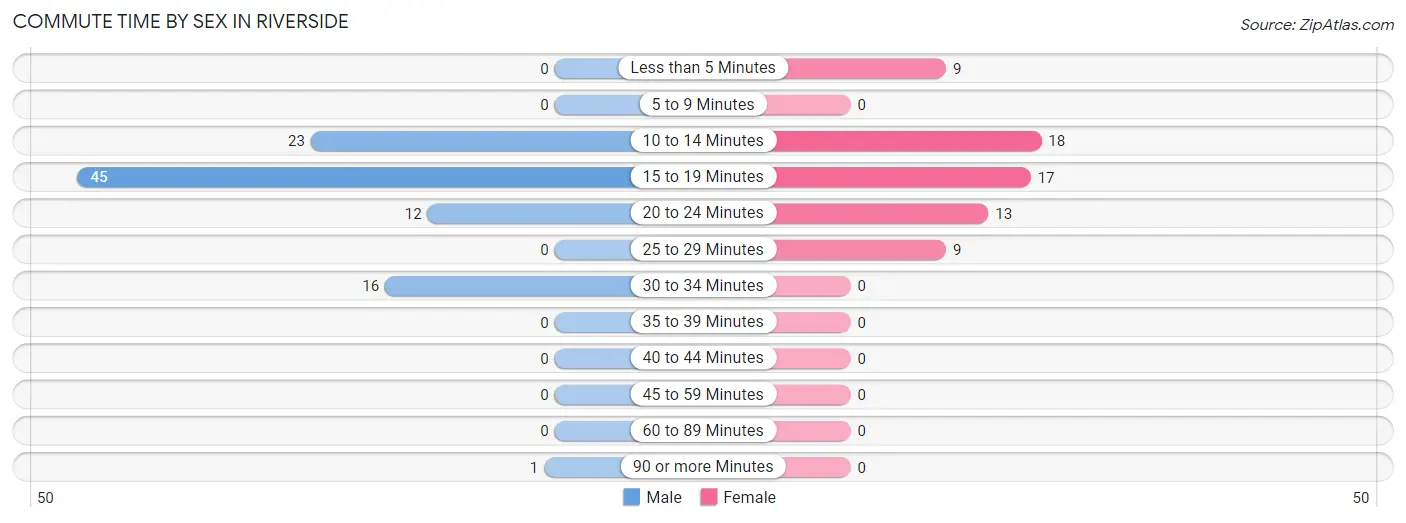
| Commute Time | Male | Female |
| Less than 5 Minutes | 0 (0.0%) | 9 (13.6%) |
| 5 to 9 Minutes | 0 (0.0%) | 0 (0.0%) |
| 10 to 14 Minutes | 23 (23.7%) | 18 (27.3%) |
| 15 to 19 Minutes | 45 (46.4%) | 17 (25.8%) |
| 20 to 24 Minutes | 12 (12.4%) | 13 (19.7%) |
| 25 to 29 Minutes | 0 (0.0%) | 9 (13.6%) |
| 30 to 34 Minutes | 16 (16.5%) | 0 (0.0%) |
| 35 to 39 Minutes | 0 (0.0%) | 0 (0.0%) |
| 40 to 44 Minutes | 0 (0.0%) | 0 (0.0%) |
| 45 to 59 Minutes | 0 (0.0%) | 0 (0.0%) |
| 60 to 89 Minutes | 0 (0.0%) | 0 (0.0%) |
| 90 or more Minutes | 1 (1.0%) | 0 (0.0%) |
Time of Departure to Work by Sex in Riverside
The most frequent times of departure to work in Riverside are 7:00 AM to 7:29 AM (27, 27.8%) for males and 12:00 PM to 3:59 PM (16, 24.2%) for females.
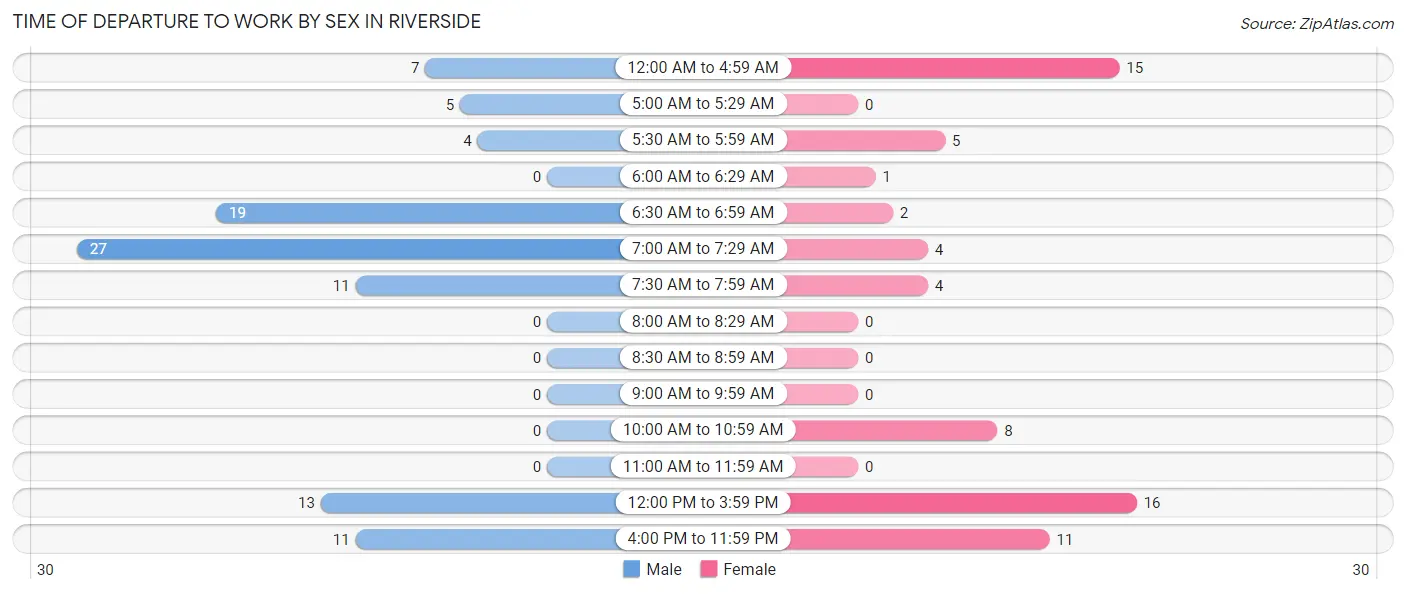
| Time of Departure | Male | Female |
| 12:00 AM to 4:59 AM | 7 (7.2%) | 15 (22.7%) |
| 5:00 AM to 5:29 AM | 5 (5.1%) | 0 (0.0%) |
| 5:30 AM to 5:59 AM | 4 (4.1%) | 5 (7.6%) |
| 6:00 AM to 6:29 AM | 0 (0.0%) | 1 (1.5%) |
| 6:30 AM to 6:59 AM | 19 (19.6%) | 2 (3.0%) |
| 7:00 AM to 7:29 AM | 27 (27.8%) | 4 (6.1%) |
| 7:30 AM to 7:59 AM | 11 (11.3%) | 4 (6.1%) |
| 8:00 AM to 8:29 AM | 0 (0.0%) | 0 (0.0%) |
| 8:30 AM to 8:59 AM | 0 (0.0%) | 0 (0.0%) |
| 9:00 AM to 9:59 AM | 0 (0.0%) | 0 (0.0%) |
| 10:00 AM to 10:59 AM | 0 (0.0%) | 8 (12.1%) |
| 11:00 AM to 11:59 AM | 0 (0.0%) | 0 (0.0%) |
| 12:00 PM to 3:59 PM | 13 (13.4%) | 16 (24.2%) |
| 4:00 PM to 11:59 PM | 11 (11.3%) | 11 (16.7%) |
| Total | 97 (100.0%) | 66 (100.0%) |
Housing Occupancy in Riverside
Occupancy by Ownership in Riverside
Of the total 173 dwellings in Riverside, owner-occupied units account for 71 (41.0%), while renter-occupied units make up 102 (59.0%).
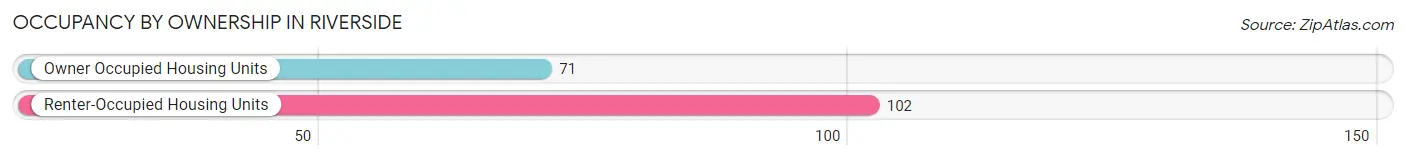
| Occupancy | # Housing Units | % Housing Units |
| Owner Occupied Housing Units | 71 | 41.0% |
| Renter-Occupied Housing Units | 102 | 59.0% |
| Total Occupied Housing Units | 173 | 100.0% |
Occupancy by Household Size in Riverside
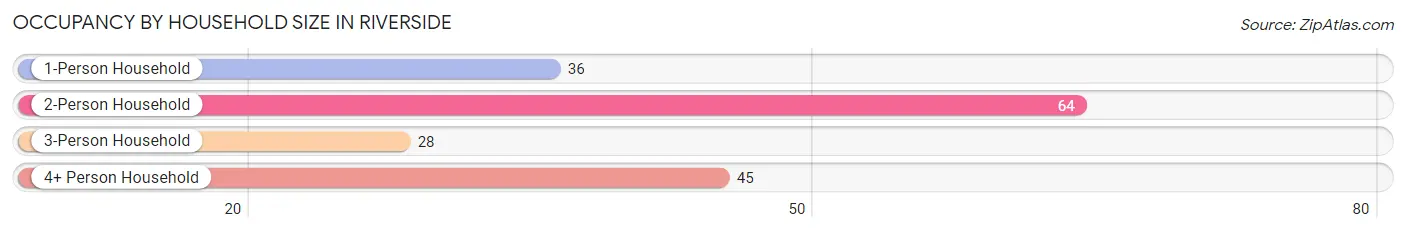
| Household Size | # Housing Units | % Housing Units |
| 1-Person Household | 36 | 20.8% |
| 2-Person Household | 64 | 37.0% |
| 3-Person Household | 28 | 16.2% |
| 4+ Person Household | 45 | 26.0% |
| Total Housing Units | 173 | 100.0% |
Occupancy by Ownership by Household Size in Riverside
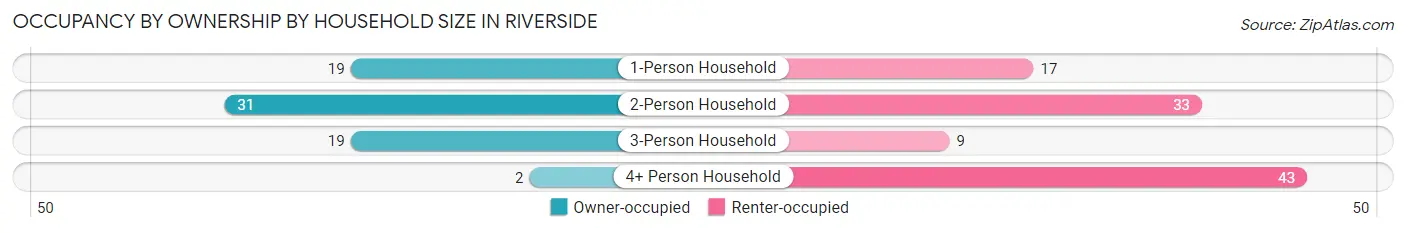
| Household Size | Owner-occupied | Renter-occupied |
| 1-Person Household | 19 (52.8%) | 17 (47.2%) |
| 2-Person Household | 31 (48.4%) | 33 (51.6%) |
| 3-Person Household | 19 (67.9%) | 9 (32.1%) |
| 4+ Person Household | 2 (4.4%) | 43 (95.6%) |
| Total Housing Units | 71 (41.0%) | 102 (59.0%) |
Occupancy by Educational Attainment in Riverside
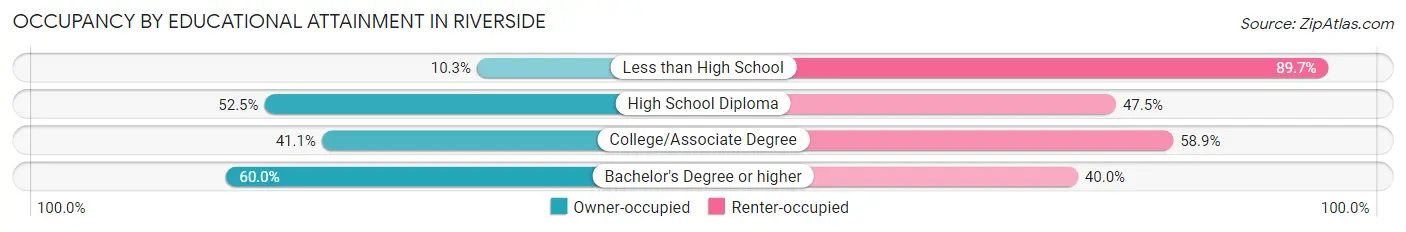
| Household Size | Owner-occupied | Renter-occupied |
| Less than High School | 3 (10.3%) | 26 (89.7%) |
| High School Diploma | 32 (52.5%) | 29 (47.5%) |
| College/Associate Degree | 30 (41.1%) | 43 (58.9%) |
| Bachelor's Degree or higher | 6 (60.0%) | 4 (40.0%) |
Occupancy by Age of Householder in Riverside
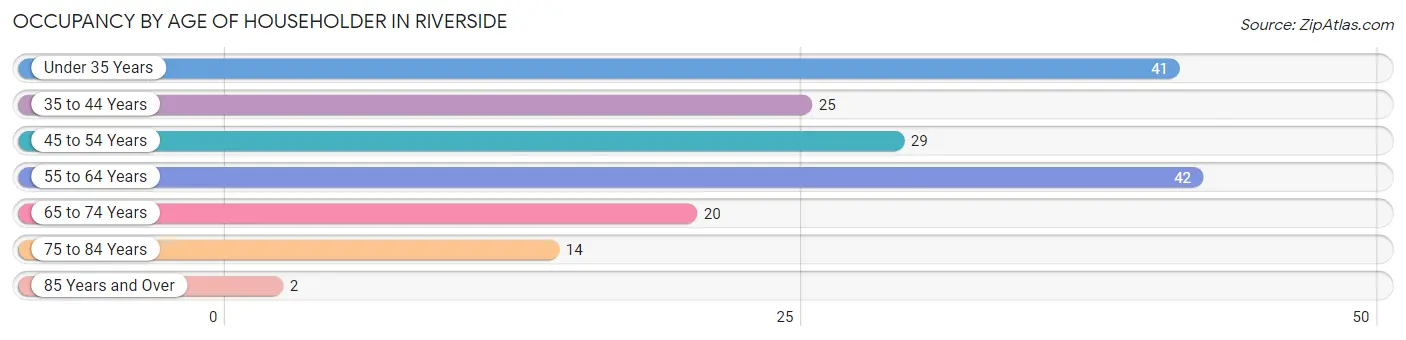
| Age Bracket | # Households | % Households |
| Under 35 Years | 41 | 23.7% |
| 35 to 44 Years | 25 | 14.4% |
| 45 to 54 Years | 29 | 16.8% |
| 55 to 64 Years | 42 | 24.3% |
| 65 to 74 Years | 20 | 11.6% |
| 75 to 84 Years | 14 | 8.1% |
| 85 Years and Over | 2 | 1.2% |
| Total | 173 | 100.0% |
Housing Finances in Riverside
Median Income by Occupancy in Riverside
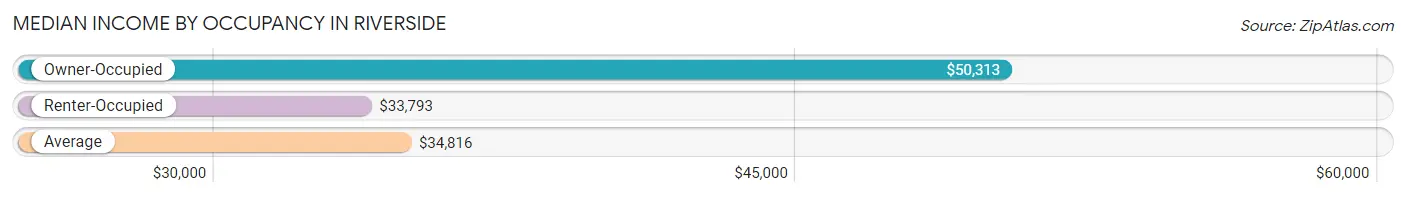
| Occupancy Type | # Households | Median Income |
| Owner-Occupied | 71 (41.0%) | $50,313 |
| Renter-Occupied | 102 (59.0%) | $33,793 |
| Average | 173 (100.0%) | $34,816 |
Occupancy by Householder Income Bracket in Riverside
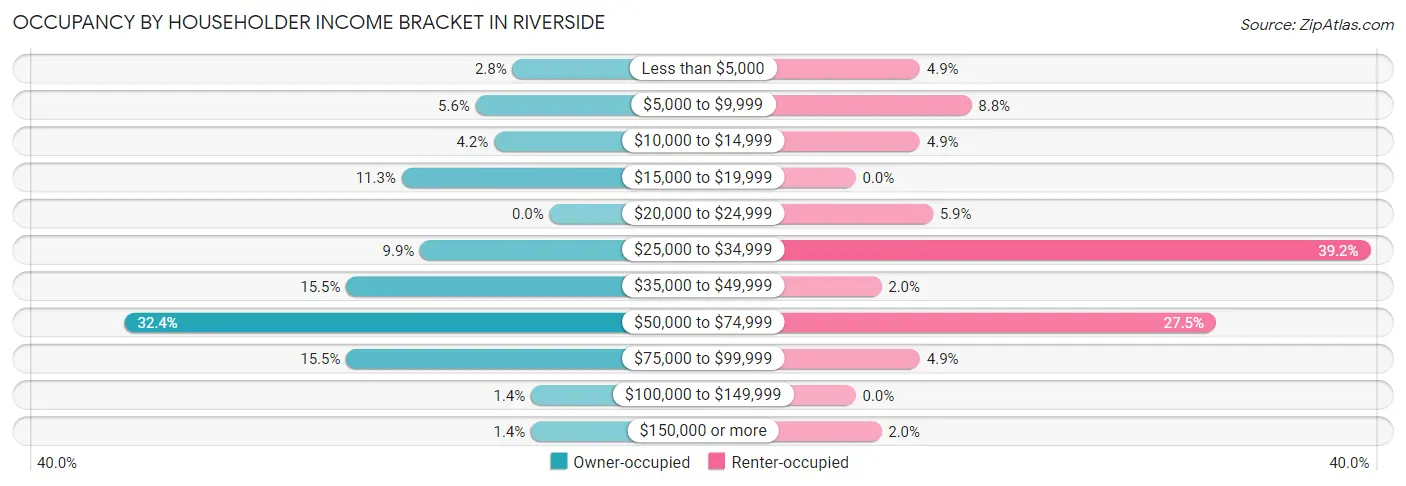
| Income Bracket | Owner-occupied | Renter-occupied |
| Less than $5,000 | 2 (2.8%) | 5 (4.9%) |
| $5,000 to $9,999 | 4 (5.6%) | 9 (8.8%) |
| $10,000 to $14,999 | 3 (4.2%) | 5 (4.9%) |
| $15,000 to $19,999 | 8 (11.3%) | 0 (0.0%) |
| $20,000 to $24,999 | 0 (0.0%) | 6 (5.9%) |
| $25,000 to $34,999 | 7 (9.9%) | 40 (39.2%) |
| $35,000 to $49,999 | 11 (15.5%) | 2 (2.0%) |
| $50,000 to $74,999 | 23 (32.4%) | 28 (27.5%) |
| $75,000 to $99,999 | 11 (15.5%) | 5 (4.9%) |
| $100,000 to $149,999 | 1 (1.4%) | 0 (0.0%) |
| $150,000 or more | 1 (1.4%) | 2 (2.0%) |
| Total | 71 (100.0%) | 102 (100.0%) |
Monthly Housing Cost Tiers in Riverside
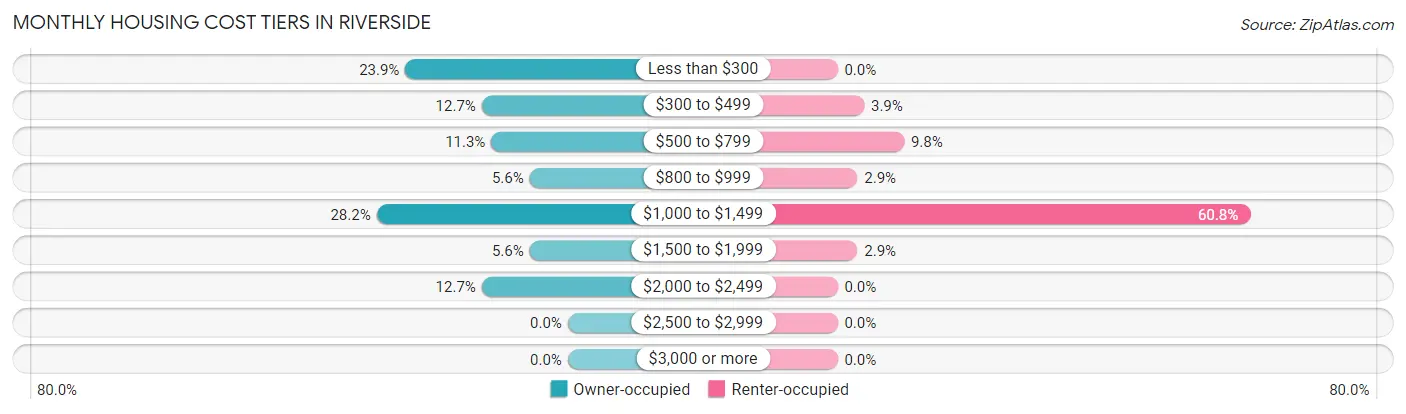
| Monthly Cost | Owner-occupied | Renter-occupied |
| Less than $300 | 17 (23.9%) | 0 (0.0%) |
| $300 to $499 | 9 (12.7%) | 4 (3.9%) |
| $500 to $799 | 8 (11.3%) | 10 (9.8%) |
| $800 to $999 | 4 (5.6%) | 3 (2.9%) |
| $1,000 to $1,499 | 20 (28.2%) | 62 (60.8%) |
| $1,500 to $1,999 | 4 (5.6%) | 3 (2.9%) |
| $2,000 to $2,499 | 9 (12.7%) | 0 (0.0%) |
| $2,500 to $2,999 | 0 (0.0%) | 0 (0.0%) |
| $3,000 or more | 0 (0.0%) | 0 (0.0%) |
| Total | 71 (100.0%) | 102 (100.0%) |
Physical Housing Characteristics in Riverside
Housing Structures in Riverside
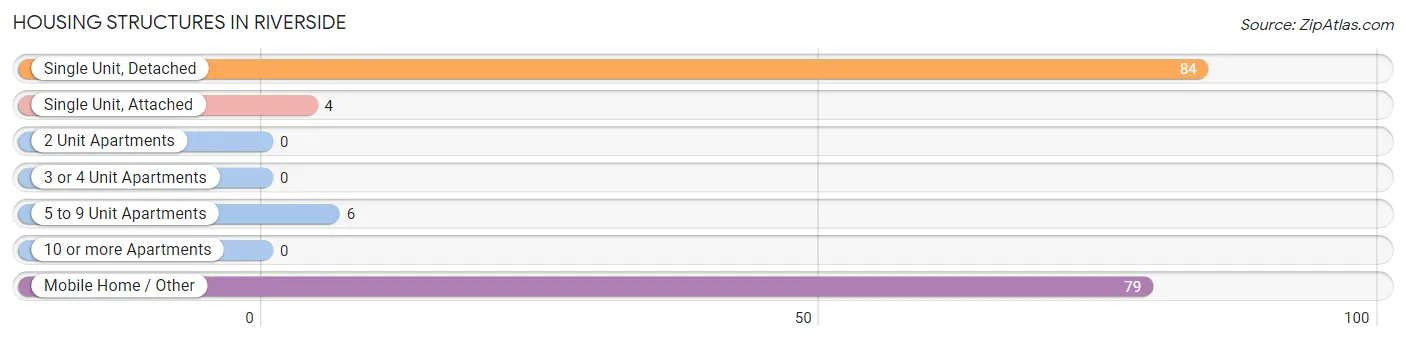
| Structure Type | # Housing Units | % Housing Units |
| Single Unit, Detached | 84 | 48.5% |
| Single Unit, Attached | 4 | 2.3% |
| 2 Unit Apartments | 0 | 0.0% |
| 3 or 4 Unit Apartments | 0 | 0.0% |
| 5 to 9 Unit Apartments | 6 | 3.5% |
| 10 or more Apartments | 0 | 0.0% |
| Mobile Home / Other | 79 | 45.7% |
| Total | 173 | 100.0% |
Housing Structures by Occupancy in Riverside
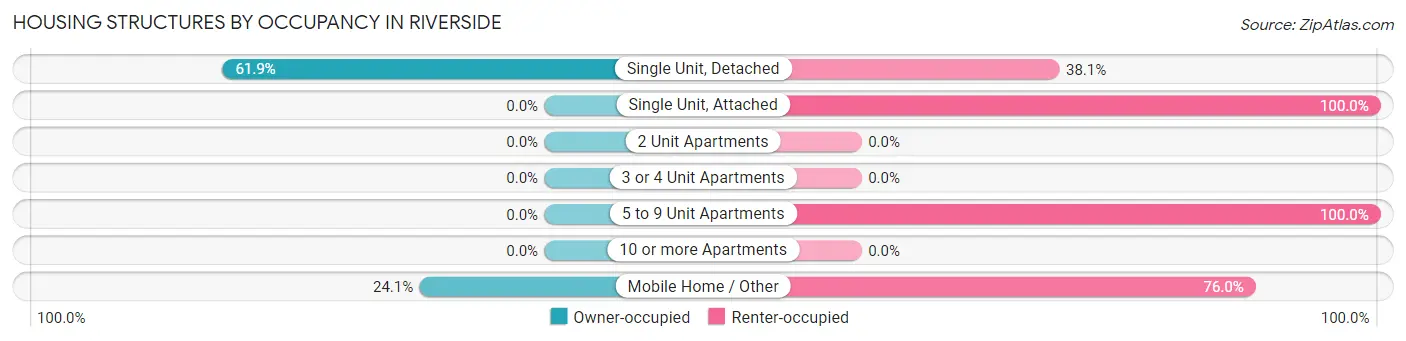
| Structure Type | Owner-occupied | Renter-occupied |
| Single Unit, Detached | 52 (61.9%) | 32 (38.1%) |
| Single Unit, Attached | 0 (0.0%) | 4 (100.0%) |
| 2 Unit Apartments | 0 (0.0%) | 0 (0.0%) |
| 3 or 4 Unit Apartments | 0 (0.0%) | 0 (0.0%) |
| 5 to 9 Unit Apartments | 0 (0.0%) | 6 (100.0%) |
| 10 or more Apartments | 0 (0.0%) | 0 (0.0%) |
| Mobile Home / Other | 19 (24.0%) | 60 (75.9%) |
| Total | 71 (41.0%) | 102 (59.0%) |
Housing Structures by Number of Rooms in Riverside
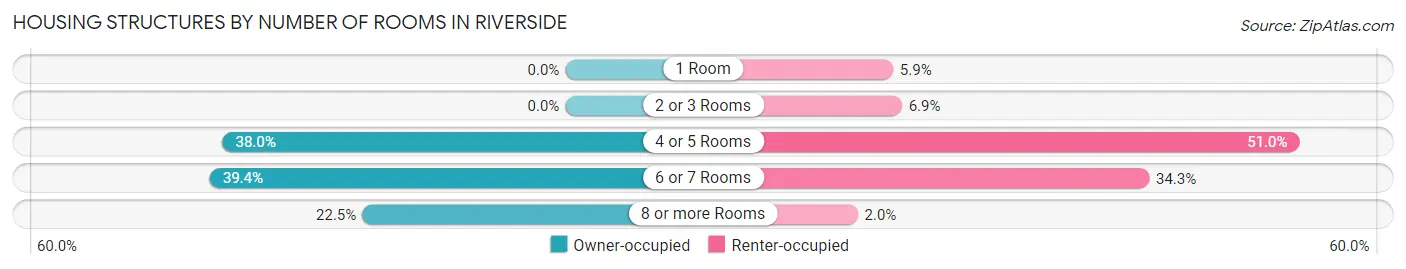
| Number of Rooms | Owner-occupied | Renter-occupied |
| 1 Room | 0 (0.0%) | 6 (5.9%) |
| 2 or 3 Rooms | 0 (0.0%) | 7 (6.9%) |
| 4 or 5 Rooms | 27 (38.0%) | 52 (51.0%) |
| 6 or 7 Rooms | 28 (39.4%) | 35 (34.3%) |
| 8 or more Rooms | 16 (22.5%) | 2 (2.0%) |
| Total | 71 (100.0%) | 102 (100.0%) |
Housing Structure by Heating Type in Riverside
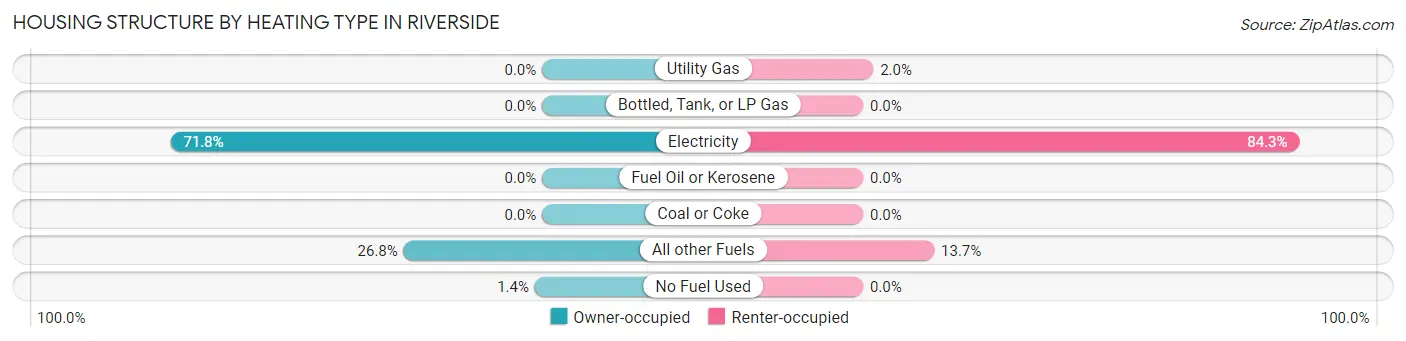
| Heating Type | Owner-occupied | Renter-occupied |
| Utility Gas | 0 (0.0%) | 2 (2.0%) |
| Bottled, Tank, or LP Gas | 0 (0.0%) | 0 (0.0%) |
| Electricity | 51 (71.8%) | 86 (84.3%) |
| Fuel Oil or Kerosene | 0 (0.0%) | 0 (0.0%) |
| Coal or Coke | 0 (0.0%) | 0 (0.0%) |
| All other Fuels | 19 (26.8%) | 14 (13.7%) |
| No Fuel Used | 1 (1.4%) | 0 (0.0%) |
| Total | 71 (100.0%) | 102 (100.0%) |
Household Vehicle Usage in Riverside
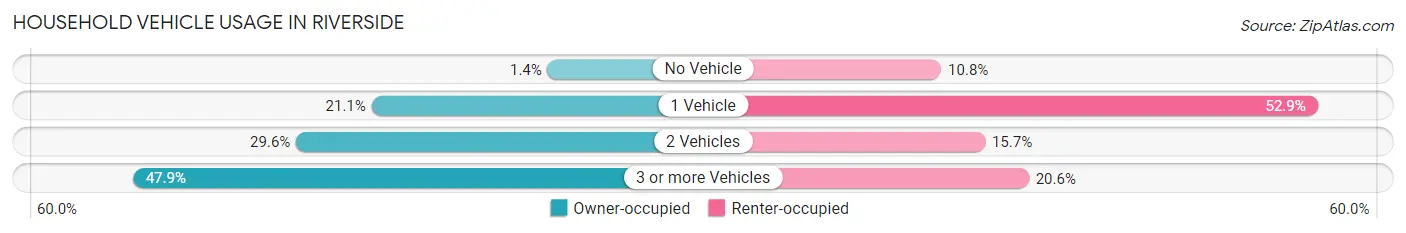
| Vehicles per Household | Owner-occupied | Renter-occupied |
| No Vehicle | 1 (1.4%) | 11 (10.8%) |
| 1 Vehicle | 15 (21.1%) | 54 (52.9%) |
| 2 Vehicles | 21 (29.6%) | 16 (15.7%) |
| 3 or more Vehicles | 34 (47.9%) | 21 (20.6%) |
| Total | 71 (100.0%) | 102 (100.0%) |
Real Estate & Mortgages in Riverside
Real Estate and Mortgage Overview in Riverside
| Characteristic | Without Mortgage | With Mortgage |
| Housing Units | 32 | 39 |
| Median Property Value | $131,800 | $217,300 |
| Median Household Income | $51,875 | $1 |
| Monthly Housing Costs | $283 | $0 |
| Real Estate Taxes | $1,183 | $0 |
Property Value by Mortgage Status in Riverside
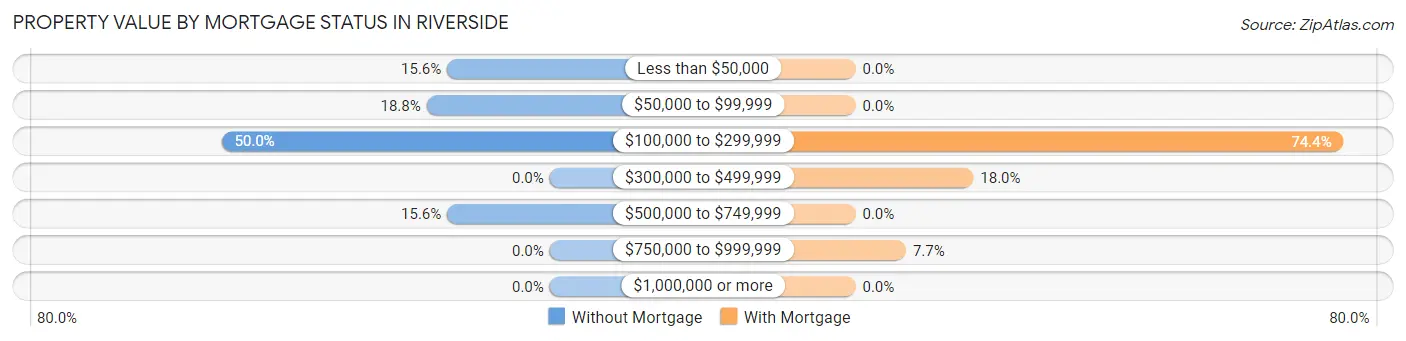
| Property Value | Without Mortgage | With Mortgage |
| Less than $50,000 | 5 (15.6%) | 0 (0.0%) |
| $50,000 to $99,999 | 6 (18.8%) | 0 (0.0%) |
| $100,000 to $299,999 | 16 (50.0%) | 29 (74.4%) |
| $300,000 to $499,999 | 0 (0.0%) | 7 (17.9%) |
| $500,000 to $749,999 | 5 (15.6%) | 0 (0.0%) |
| $750,000 to $999,999 | 0 (0.0%) | 3 (7.7%) |
| $1,000,000 or more | 0 (0.0%) | 0 (0.0%) |
| Total | 32 (100.0%) | 39 (100.0%) |
Household Income by Mortgage Status in Riverside
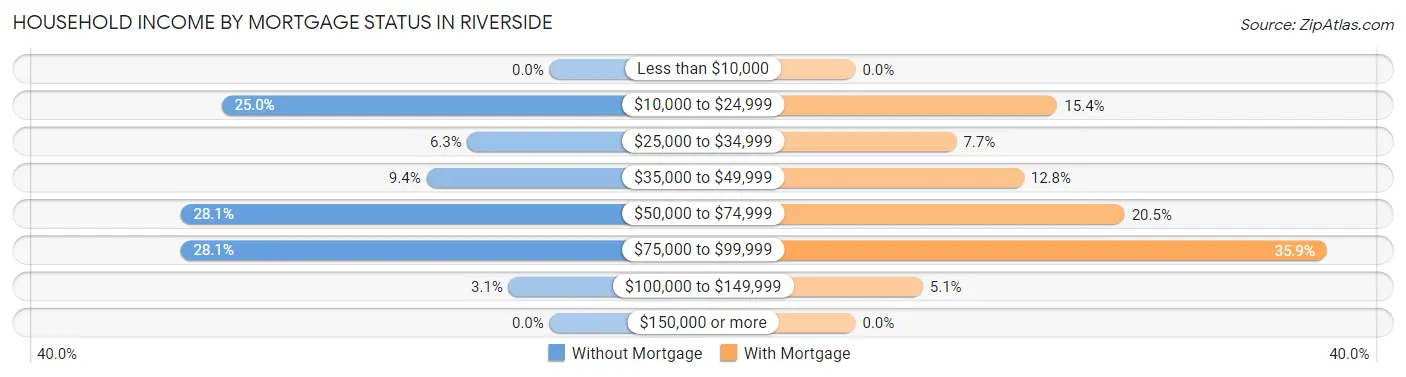
| Household Income | Without Mortgage | With Mortgage |
| Less than $10,000 | 0 (0.0%) | 0 (0.0%) |
| $10,000 to $24,999 | 8 (25.0%) | 6 (15.4%) |
| $25,000 to $34,999 | 2 (6.2%) | 3 (7.7%) |
| $35,000 to $49,999 | 3 (9.4%) | 5 (12.8%) |
| $50,000 to $74,999 | 9 (28.1%) | 8 (20.5%) |
| $75,000 to $99,999 | 9 (28.1%) | 14 (35.9%) |
| $100,000 to $149,999 | 1 (3.1%) | 2 (5.1%) |
| $150,000 or more | 0 (0.0%) | 0 (0.0%) |
| Total | 32 (100.0%) | 39 (100.0%) |
Property Value to Household Income Ratio in Riverside
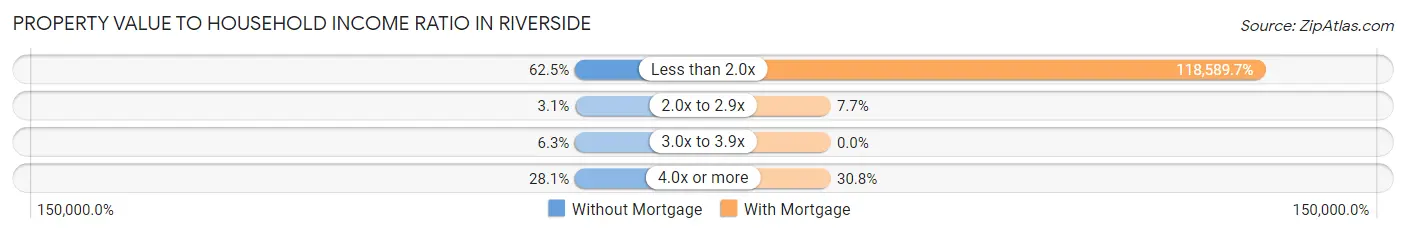
| Value-to-Income Ratio | Without Mortgage | With Mortgage |
| Less than 2.0x | 20 (62.5%) | 46,250 (118,589.7%) |
| 2.0x to 2.9x | 1 (3.1%) | 3 (7.7%) |
| 3.0x to 3.9x | 2 (6.2%) | 0 (0.0%) |
| 4.0x or more | 9 (28.1%) | 12 (30.8%) |
| Total | 32 (100.0%) | 39 (100.0%) |
Real Estate Taxes by Mortgage Status in Riverside
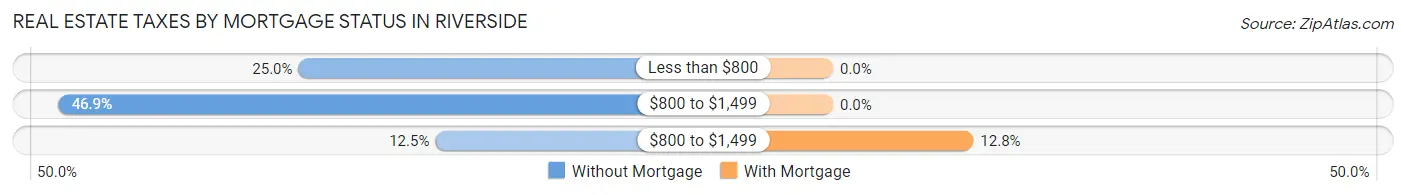
| Property Taxes | Without Mortgage | With Mortgage |
| Less than $800 | 8 (25.0%) | 0 (0.0%) |
| $800 to $1,499 | 15 (46.9%) | 0 (0.0%) |
| $800 to $1,499 | 4 (12.5%) | 5 (12.8%) |
| Total | 32 (100.0%) | 39 (100.0%) |
Health & Disability in Riverside
Health Insurance Coverage by Age in Riverside
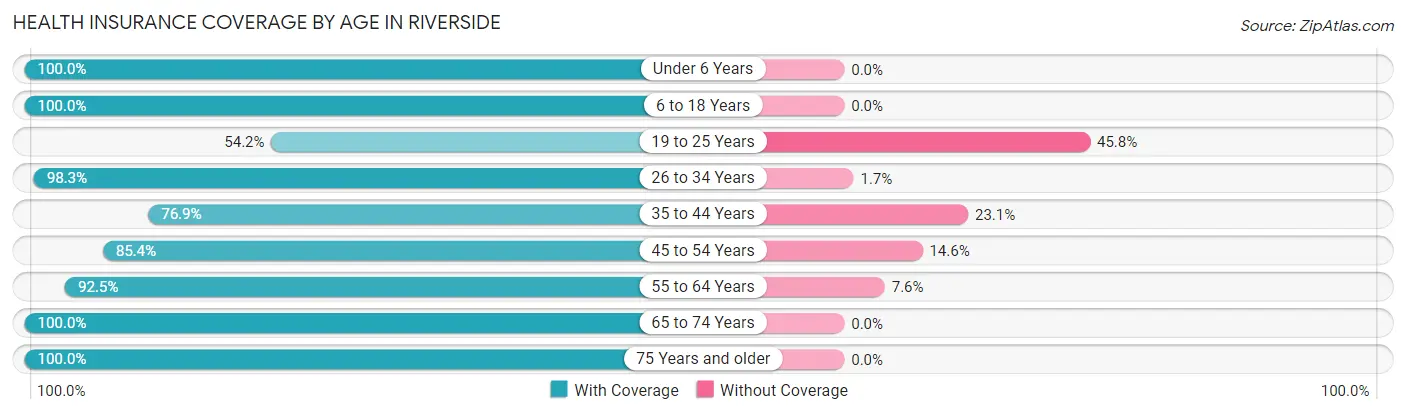
| Age Bracket | With Coverage | Without Coverage |
| Under 6 Years | 28 (100.0%) | 0 (0.0%) |
| 6 to 18 Years | 111 (100.0%) | 0 (0.0%) |
| 19 to 25 Years | 13 (54.2%) | 11 (45.8%) |
| 26 to 34 Years | 57 (98.3%) | 1 (1.7%) |
| 35 to 44 Years | 40 (76.9%) | 12 (23.1%) |
| 45 to 54 Years | 41 (85.4%) | 7 (14.6%) |
| 55 to 64 Years | 49 (92.4%) | 4 (7.5%) |
| 65 to 74 Years | 21 (100.0%) | 0 (0.0%) |
| 75 Years and older | 29 (100.0%) | 0 (0.0%) |
| Total | 389 (91.7%) | 35 (8.3%) |
Health Insurance Coverage by Citizenship Status in Riverside
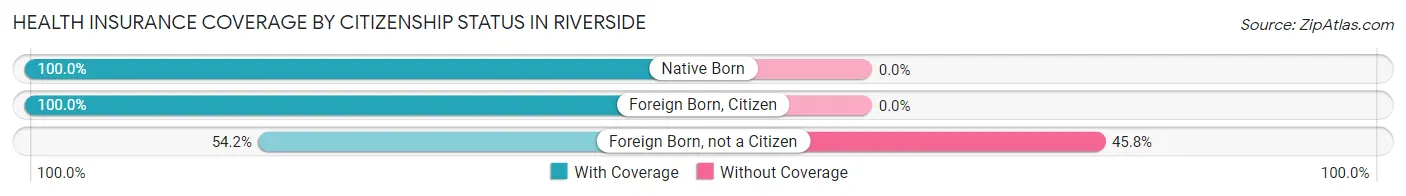
| Citizenship Status | With Coverage | Without Coverage |
| Native Born | 28 (100.0%) | 0 (0.0%) |
| Foreign Born, Citizen | 111 (100.0%) | 0 (0.0%) |
| Foreign Born, not a Citizen | 13 (54.2%) | 11 (45.8%) |
Health Insurance Coverage by Household Income in Riverside
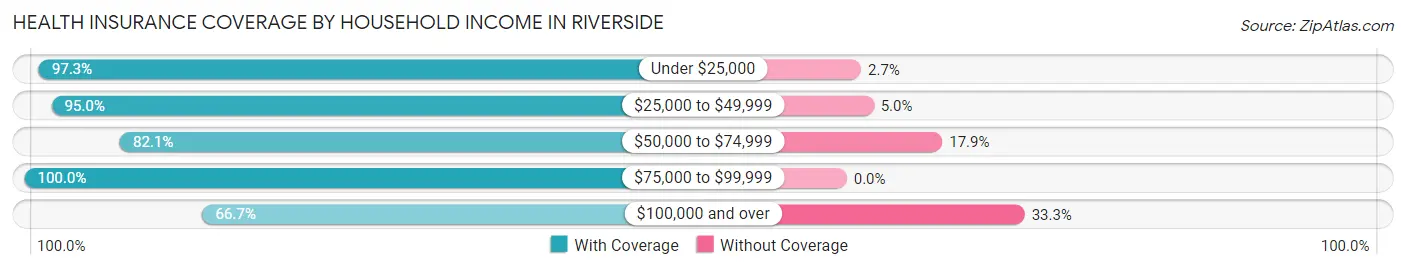
| Household Income | With Coverage | Without Coverage |
| Under $25,000 | 109 (97.3%) | 3 (2.7%) |
| $25,000 to $49,999 | 132 (95.0%) | 7 (5.0%) |
| $50,000 to $74,999 | 101 (82.1%) | 22 (17.9%) |
| $75,000 to $99,999 | 41 (100.0%) | 0 (0.0%) |
| $100,000 and over | 6 (66.7%) | 3 (33.3%) |
Public vs Private Health Insurance Coverage by Age in Riverside
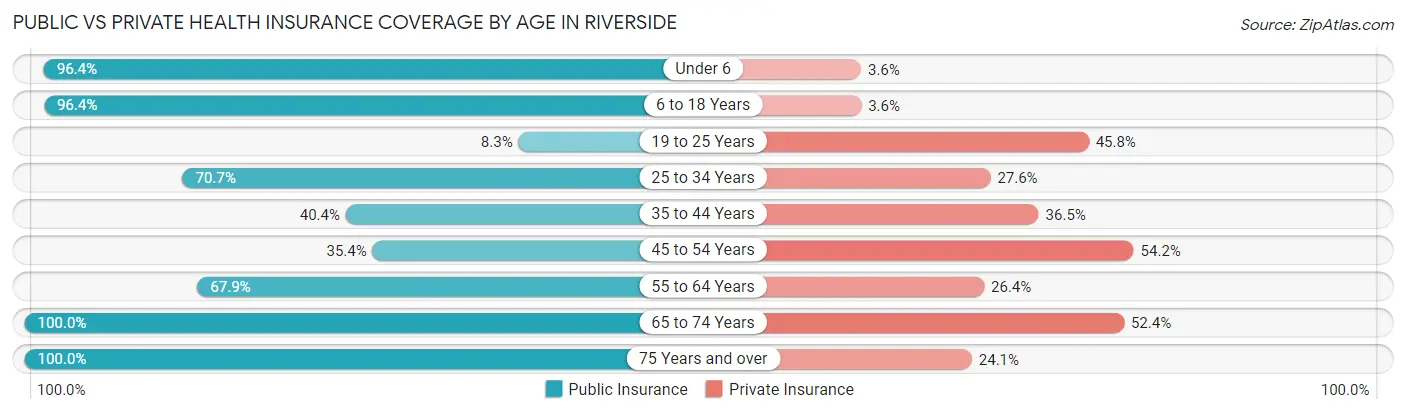
| Age Bracket | Public Insurance | Private Insurance |
| Under 6 | 27 (96.4%) | 1 (3.6%) |
| 6 to 18 Years | 107 (96.4%) | 4 (3.6%) |
| 19 to 25 Years | 2 (8.3%) | 11 (45.8%) |
| 25 to 34 Years | 41 (70.7%) | 16 (27.6%) |
| 35 to 44 Years | 21 (40.4%) | 19 (36.5%) |
| 45 to 54 Years | 17 (35.4%) | 26 (54.2%) |
| 55 to 64 Years | 36 (67.9%) | 14 (26.4%) |
| 65 to 74 Years | 21 (100.0%) | 11 (52.4%) |
| 75 Years and over | 29 (100.0%) | 7 (24.1%) |
| Total | 301 (71.0%) | 109 (25.7%) |
Disability Status by Sex by Age in Riverside
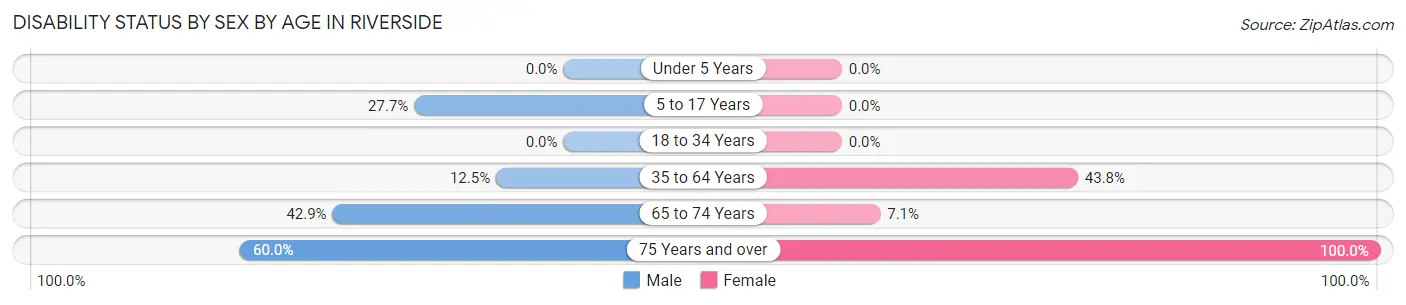
| Age Bracket | Male | Female |
| Under 5 Years | 0 (0.0%) | 0 (0.0%) |
| 5 to 17 Years | 18 (27.7%) | 0 (0.0%) |
| 18 to 34 Years | 0 (0.0%) | 0 (0.0%) |
| 35 to 64 Years | 8 (12.5%) | 39 (43.8%) |
| 65 to 74 Years | 3 (42.9%) | 1 (7.1%) |
| 75 Years and over | 12 (60.0%) | 9 (100.0%) |
Disability Class by Sex by Age in Riverside
Disability Class: Hearing Difficulty
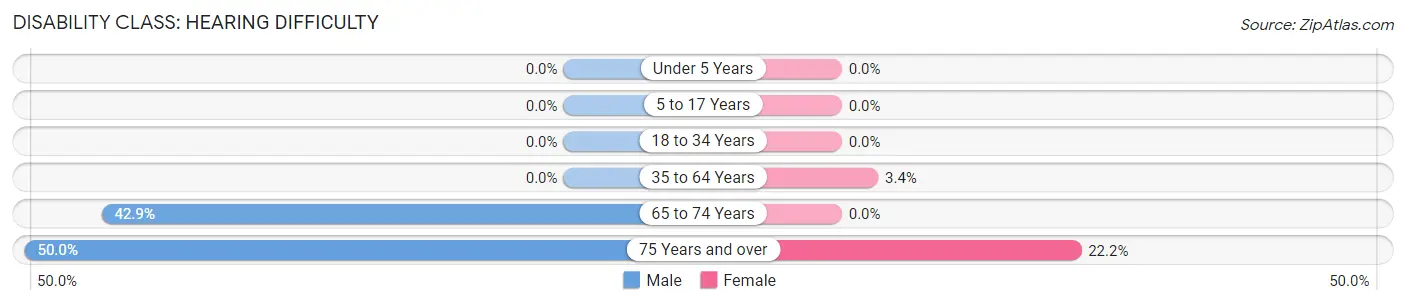
| Age Bracket | Male | Female |
| Under 5 Years | 0 (0.0%) | 0 (0.0%) |
| 5 to 17 Years | 0 (0.0%) | 0 (0.0%) |
| 18 to 34 Years | 0 (0.0%) | 0 (0.0%) |
| 35 to 64 Years | 0 (0.0%) | 3 (3.4%) |
| 65 to 74 Years | 3 (42.9%) | 0 (0.0%) |
| 75 Years and over | 10 (50.0%) | 2 (22.2%) |
Disability Class: Vision Difficulty
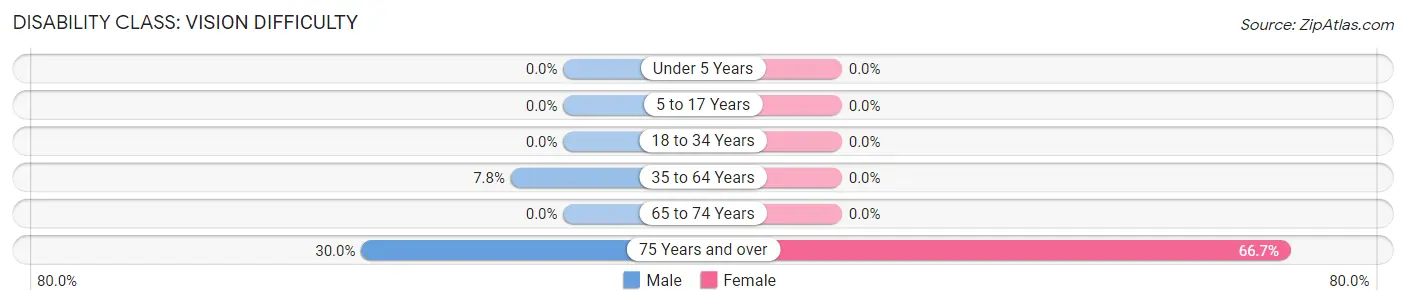
| Age Bracket | Male | Female |
| Under 5 Years | 0 (0.0%) | 0 (0.0%) |
| 5 to 17 Years | 0 (0.0%) | 0 (0.0%) |
| 18 to 34 Years | 0 (0.0%) | 0 (0.0%) |
| 35 to 64 Years | 5 (7.8%) | 0 (0.0%) |
| 65 to 74 Years | 0 (0.0%) | 0 (0.0%) |
| 75 Years and over | 6 (30.0%) | 6 (66.7%) |
Disability Class: Cognitive Difficulty
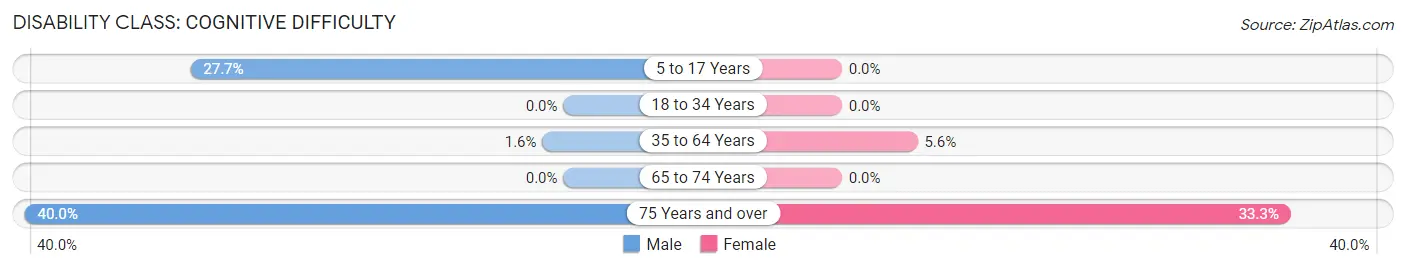
| Age Bracket | Male | Female |
| 5 to 17 Years | 18 (27.7%) | 0 (0.0%) |
| 18 to 34 Years | 0 (0.0%) | 0 (0.0%) |
| 35 to 64 Years | 1 (1.6%) | 5 (5.6%) |
| 65 to 74 Years | 0 (0.0%) | 0 (0.0%) |
| 75 Years and over | 8 (40.0%) | 3 (33.3%) |
Disability Class: Ambulatory Difficulty
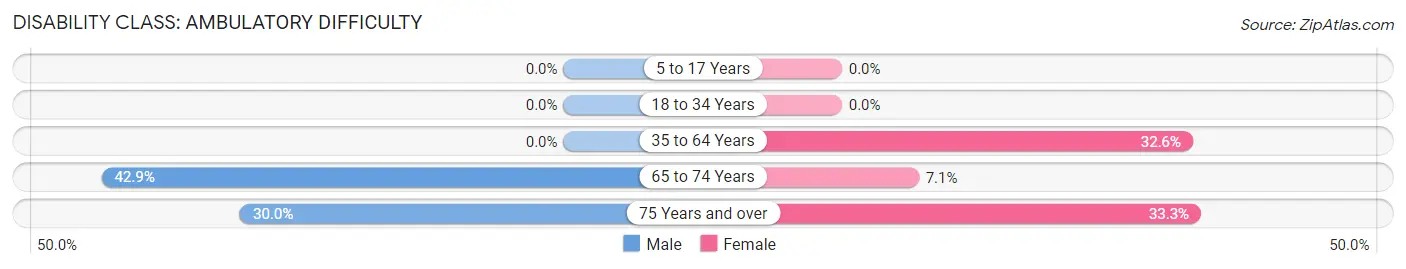
| Age Bracket | Male | Female |
| 5 to 17 Years | 0 (0.0%) | 0 (0.0%) |
| 18 to 34 Years | 0 (0.0%) | 0 (0.0%) |
| 35 to 64 Years | 0 (0.0%) | 29 (32.6%) |
| 65 to 74 Years | 3 (42.9%) | 1 (7.1%) |
| 75 Years and over | 6 (30.0%) | 3 (33.3%) |
Disability Class: Self-Care Difficulty
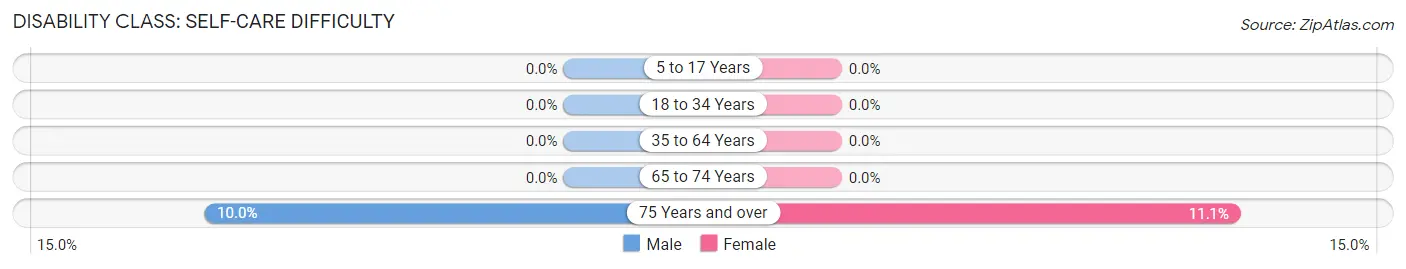
| Age Bracket | Male | Female |
| 5 to 17 Years | 0 (0.0%) | 0 (0.0%) |
| 18 to 34 Years | 0 (0.0%) | 0 (0.0%) |
| 35 to 64 Years | 0 (0.0%) | 0 (0.0%) |
| 65 to 74 Years | 0 (0.0%) | 0 (0.0%) |
| 75 Years and over | 2 (10.0%) | 1 (11.1%) |
Technology Access in Riverside
Computing Device Access in Riverside
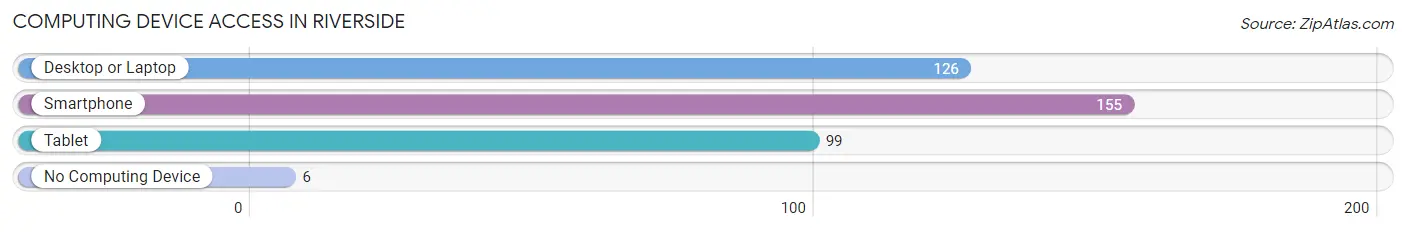
| Device Type | # Households | % Households |
| Desktop or Laptop | 126 | 72.8% |
| Smartphone | 155 | 89.6% |
| Tablet | 99 | 57.2% |
| No Computing Device | 6 | 3.5% |
| Total | 173 | 100.0% |
Internet Access in Riverside
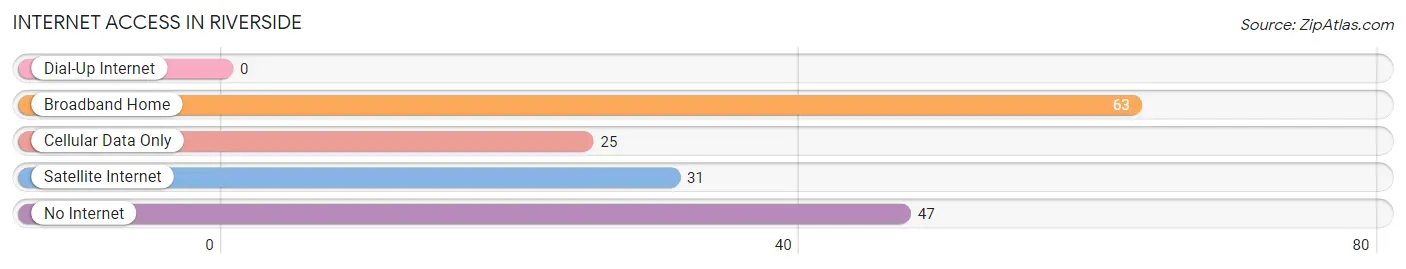
| Internet Type | # Households | % Households |
| Dial-Up Internet | 0 | 0.0% |
| Broadband Home | 63 | 36.4% |
| Cellular Data Only | 25 | 14.4% |
| Satellite Internet | 31 | 17.9% |
| No Internet | 47 | 27.2% |
| Total | 173 | 100.0% |
Riverside Summary
Riverside is a small town located in the state of Washington, United States. It is situated in the eastern part of the state, in the county of Spokane. The town is located on the Spokane River, and is surrounded by the rolling hills of the Palouse region. The population of Riverside was 1,845 at the 2010 census.
Geography
Riverside is located at 47°41'25"N 117°17'45"W (47.690278, -117.295833). According to the United States Census Bureau, the town has a total area of 1.2 square miles (3.1 km2), all of it land.
Riverside is located in the Palouse region of Washington, which is characterized by rolling hills and fertile soil. The town is situated on the Spokane River, which is a tributary of the Columbia River. The Spokane River is a popular destination for fishing, boating, and other recreational activities.
Climate
Riverside has a semi-arid climate, with hot summers and cold winters. The average annual temperature is 48.2°F (9°C). The average annual precipitation is 16.3 inches (414 mm).
Demographics
As of the 2010 census, there were 1,845 people, 745 households, and 486 families residing in the town. The population density was 1,539.2 people per square mile (593.3/km2). There were 817 housing units at an average density of 681.3 per square mile (263.3/km2). The racial makeup of the town was 94.2% White, 0.3% African American, 0.7% Native American, 0.4% Asian, 0.1% Pacific Islander, 1.2% from other races, and 3.1% from two or more races. Hispanic or Latino of any race were 3.7% of the population.
Economy
Riverside is a small town with a limited economy. The primary industries in the town are agriculture and tourism. The town is home to several farms, which produce a variety of crops, including wheat, barley, and hay. The town is also a popular destination for tourists, who come to enjoy the scenic beauty of the Palouse region.
The town is home to several small businesses, including restaurants, shops, and a grocery store. The town also has a post office, a library, and a bank.
History
Riverside was founded in 1883 by a group of settlers from the Midwest. The town was named after the nearby Spokane River. The town grew rapidly in the early years, and by the turn of the century, it had become a thriving community.
In the early 1900s, Riverside was a major stop on the Spokane, Portland and Seattle Railway. The railway brought in new settlers and businesses, and the town continued to grow.
In the 1950s, Riverside began to decline as the railway stopped running and the population began to move away. The town has since stabilized, and today it is a quiet, rural community.
Common Questions
What is Per Capita Income in Riverside?
Per Capita income in Riverside is $18,268.
What is the Median Family Income in Riverside?
Median Family Income in Riverside is $33,824.
What is the Median Household income in Riverside?
Median Household Income in Riverside is $34,816.
What is Income or Wage Gap in Riverside?
Income or Wage Gap in Riverside is 17.3%.
Women in Riverside earn 82.7 cents for every dollar earned by a man.
What is Inequality or Gini Index in Riverside?
Inequality or Gini Index in Riverside is 0.39.
What is the Total Population of Riverside?
Total Population of Riverside is 424.
What is the Total Male Population of Riverside?
Total Male Population of Riverside is 213.
What is the Total Female Population of Riverside?
Total Female Population of Riverside is 211.
What is the Ratio of Males per 100 Females in Riverside?
There are 100.95 Males per 100 Females in Riverside.
What is the Ratio of Females per 100 Males in Riverside?
There are 99.06 Females per 100 Males in Riverside.
What is the Median Population Age in Riverside?
Median Population Age in Riverside is 34.6 Years.
What is the Average Family Size in Riverside
Average Family Size in Riverside is 2.7 People.
What is the Average Household Size in Riverside
Average Household Size in Riverside is 2.5 People.
How Large is the Labor Force in Riverside?
There are 180 People in the Labor Forcein in Riverside.
What is the Percentage of People in the Labor Force in Riverside?
60.6% of People are in the Labor Force in Riverside.
What is the Unemployment Rate in Riverside?
Unemployment Rate in Riverside is 6.1%.