Zip Codes with the Highest Percentage of Population with a Degree in Liberal Arts and History in Renton, WA
RELATED REPORTS & OPTIONS
Liberal Arts and History
Renton
Compare Zip Codes
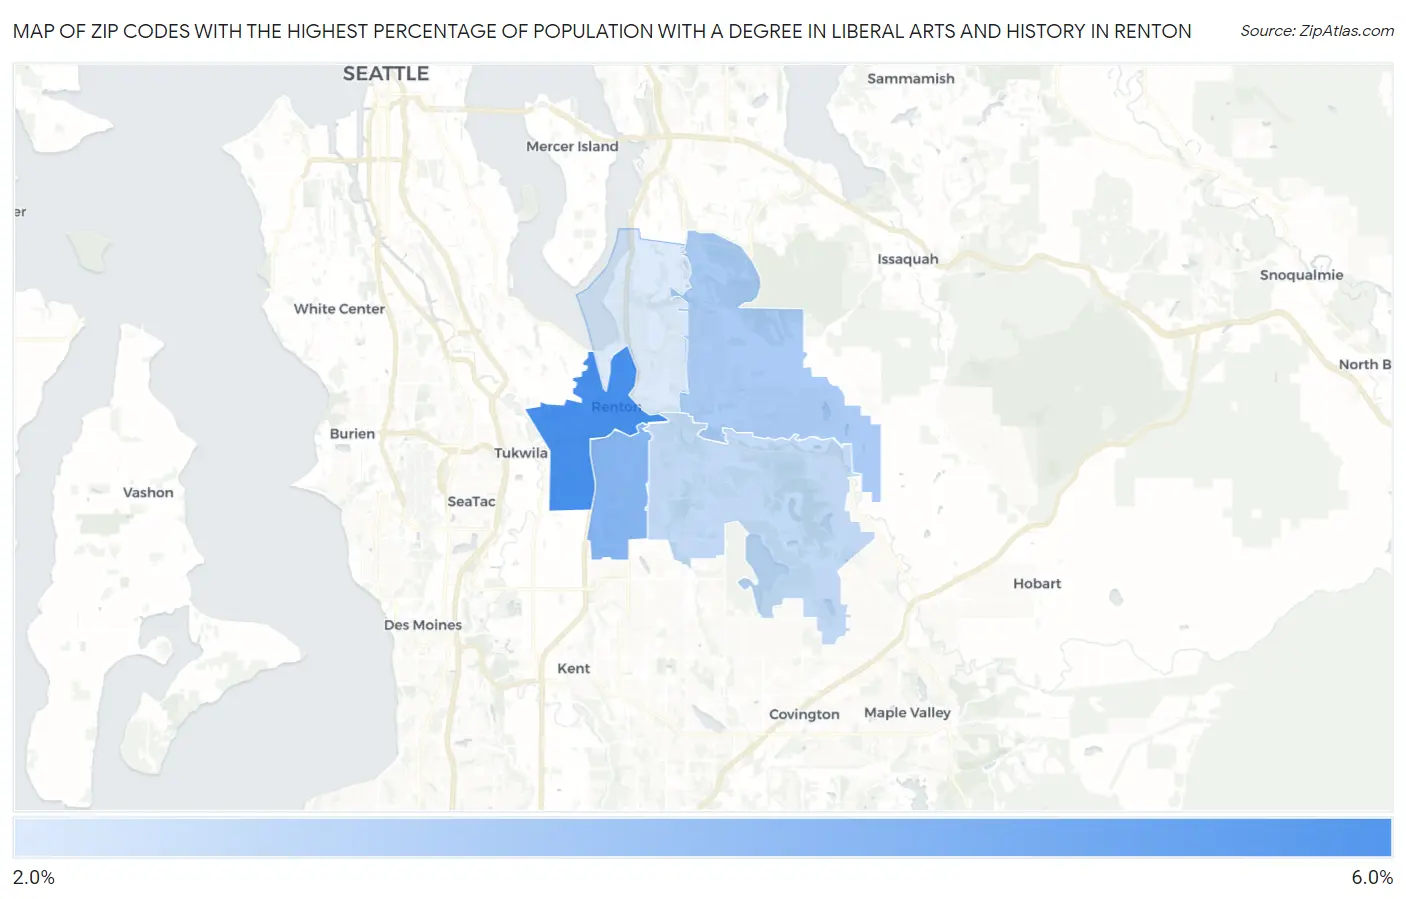
Map of Zip Codes with the Highest Percentage of Population with a Degree in Liberal Arts and History in Renton
2.6%
6.0%
Zip Codes with the Highest Percentage of Population with a Degree in Liberal Arts and History in Renton, WA
| Zip Code | % Graduates | vs State | vs National | |
| 1. | 98057 | 6.0% | 5.1%(+0.822)#195 | 4.9%(+1.10)#8,604 |
| 2. | 98055 | 4.5% | 5.1%(-0.618)#291 | 4.9%(-0.342)#12,886 |
| 3. | 98059 | 3.7% | 5.1%(-1.42)#365 | 4.9%(-1.14)#15,771 |
| 4. | 98058 | 3.2% | 5.1%(-1.99)#395 | 4.9%(-1.71)#17,795 |
| 5. | 98056 | 2.6% | 5.1%(-2.54)#415 | 4.9%(-2.27)#19,636 |
1
Common Questions
What are the Top 3 Zip Codes with the Highest Percentage of Population with a Degree in Liberal Arts and History in Renton, WA?
Top 3 Zip Codes with the Highest Percentage of Population with a Degree in Liberal Arts and History in Renton, WA are:
What zip code has the Highest Percentage of Population with a Degree in Liberal Arts and History in Renton, WA?
98057 has the Highest Percentage of Population with a Degree in Liberal Arts and History in Renton, WA with 6.0%.
What is the Percentage of Population with a Degree in Liberal Arts and History in Renton, WA?
Percentage of Population with a Degree in Liberal Arts and History in Renton is 4.0%.
What is the Percentage of Population with a Degree in Liberal Arts and History in Washington?
Percentage of Population with a Degree in Liberal Arts and History in Washington is 5.1%.
What is the Percentage of Population with a Degree in Liberal Arts and History in the United States?
Percentage of Population with a Degree in Liberal Arts and History in the United States is 4.9%.