Skamokawa Valley, WA Map & Demographics
Skamokawa Valley Map
Skamokawa Valley Overview
$20,798
PER CAPITA INCOME
0.46
INEQUALITY / GINI INDEX
288
TOTAL POPULATION
167
MALE POPULATION
121
FEMALE POPULATION
138.02
MALES / 100 FEMALES
72.46
FEMALES / 100 MALES
61.8
MEDIAN AGE
2.5
AVG FAMILY SIZE
2.1
AVG HOUSEHOLD SIZE
34
LABOR FORCE [ PEOPLE ]
13.3%
PERCENT IN LABOR FORCE
Income in Skamokawa Valley
Income Overview in Skamokawa Valley
| Characteristic | Number | Measure |
| Per Capita Income | 288 | $20,798 |
| Median Family Income | 97 | $0 |
| Mean Family Income | 97 | $48,245 |
| Median Household Income | 134 | $0 |
| Mean Household Income | 134 | $45,535 |
| Income Deficit | 97 | $0 |
| Wage / Income Gap (%) | 288 | 0.00% |
| Wage / Income Gap ($) | 288 | 100.00¢ per $1 |
| Gini / Inequality Index | 288 | 0.46 |
Earnings by Sex in Skamokawa Valley
| Sex | Number | Average Earnings |
| Male | 50 (70.4%) | $0 |
| Female | 21 (29.6%) | $0 |
| Total | 71 (100.0%) | $0 |
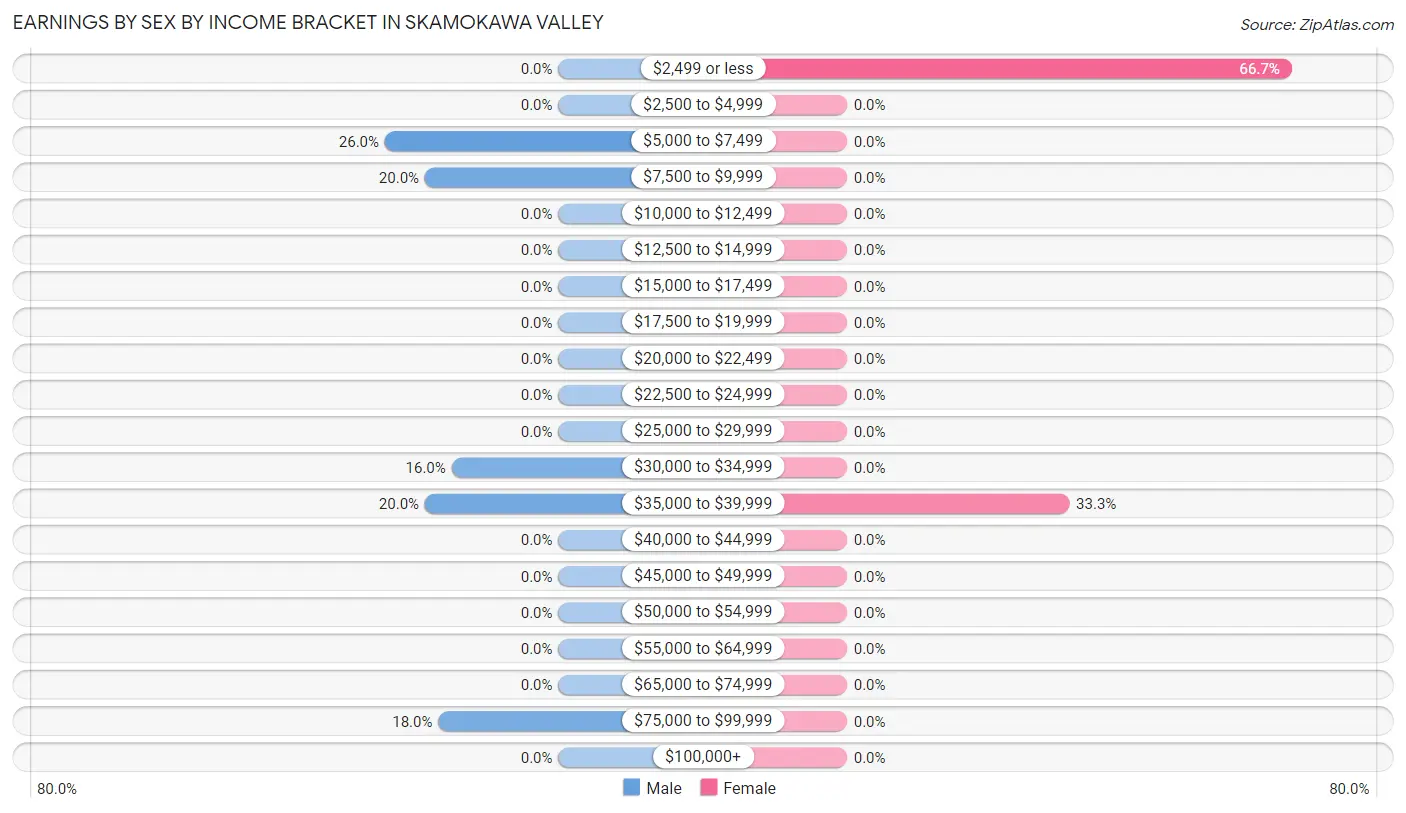
Earnings by Sex by Income Bracket in Skamokawa Valley
The most common earnings brackets in Skamokawa Valley are $5,000 to $7,499 for men (13 | 26.0%) and $2,499 or less for women (14 | 66.7%).
| Income | Male | Female |
| $2,499 or less | 0 (0.0%) | 14 (66.7%) |
| $2,500 to $4,999 | 0 (0.0%) | 0 (0.0%) |
| $5,000 to $7,499 | 13 (26.0%) | 0 (0.0%) |
| $7,500 to $9,999 | 10 (20.0%) | 0 (0.0%) |
| $10,000 to $12,499 | 0 (0.0%) | 0 (0.0%) |
| $12,500 to $14,999 | 0 (0.0%) | 0 (0.0%) |
| $15,000 to $17,499 | 0 (0.0%) | 0 (0.0%) |
| $17,500 to $19,999 | 0 (0.0%) | 0 (0.0%) |
| $20,000 to $22,499 | 0 (0.0%) | 0 (0.0%) |
| $22,500 to $24,999 | 0 (0.0%) | 0 (0.0%) |
| $25,000 to $29,999 | 0 (0.0%) | 0 (0.0%) |
| $30,000 to $34,999 | 8 (16.0%) | 0 (0.0%) |
| $35,000 to $39,999 | 10 (20.0%) | 7 (33.3%) |
| $40,000 to $44,999 | 0 (0.0%) | 0 (0.0%) |
| $45,000 to $49,999 | 0 (0.0%) | 0 (0.0%) |
| $50,000 to $54,999 | 0 (0.0%) | 0 (0.0%) |
| $55,000 to $64,999 | 0 (0.0%) | 0 (0.0%) |
| $65,000 to $74,999 | 0 (0.0%) | 0 (0.0%) |
| $75,000 to $99,999 | 9 (18.0%) | 0 (0.0%) |
| $100,000+ | 0 (0.0%) | 0 (0.0%) |
| Total | 50 (100.0%) | 21 (100.0%) |
Earnings by Sex by Educational Attainment in Skamokawa Valley
| Educational Attainment | Male Income | Female Income |
| Less than High School | - | - |
| High School Diploma | - | - |
| College or Associate's Degree | - | - |
| Bachelor's Degree | - | - |
| Graduate Degree | - | - |
| Total | - | - |
Family Income in Skamokawa Valley
Family Income Brackets in Skamokawa Valley
According to the Skamokawa Valley family income data, there are 42 families falling into the $15,000 to $24,999 income range, which is the most common income bracket and makes up 43.3% of all families.
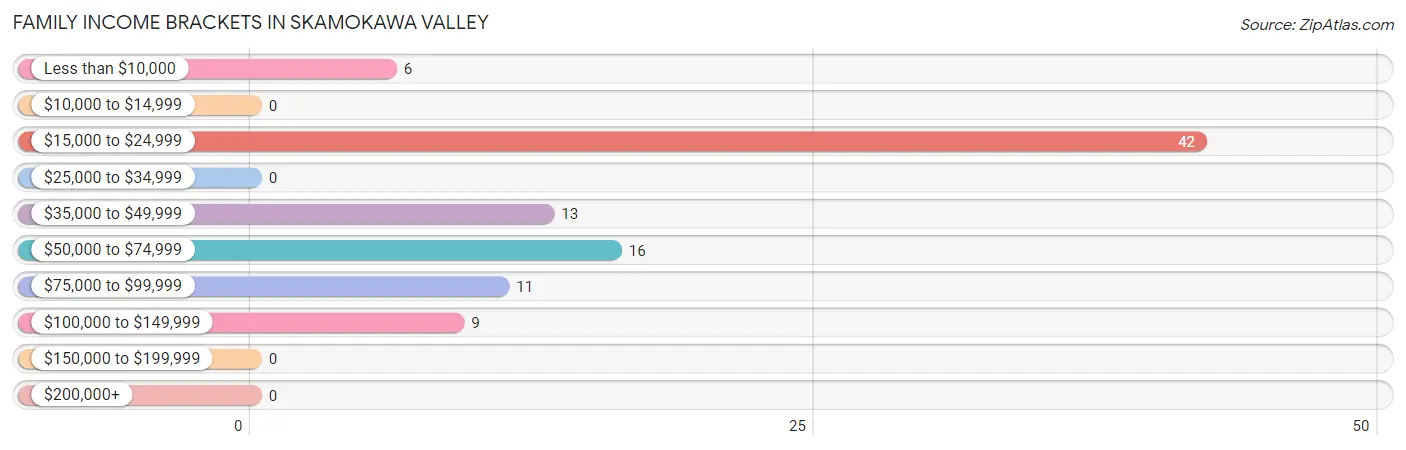
| Income Bracket | # Families | % Families |
| Less than $10,000 | 6 | 6.2% |
| $10,000 to $14,999 | 0 | 0.0% |
| $15,000 to $24,999 | 42 | 43.3% |
| $25,000 to $34,999 | 0 | 0.0% |
| $35,000 to $49,999 | 13 | 13.4% |
| $50,000 to $74,999 | 16 | 16.5% |
| $75,000 to $99,999 | 11 | 11.3% |
| $100,000 to $149,999 | 9 | 9.3% |
| $150,000 to $199,999 | 0 | 0.0% |
| $200,000+ | 0 | 0.0% |
Family Income by Famaliy Size in Skamokawa Valley
| Income Bracket | # Families | Median Income |
| 2-Person Families | 74 (76.3%) | $0 |
| 3-Person Families | 13 (13.4%) | $0 |
| 4-Person Families | 0 (0.0%) | $0 |
| 5-Person Families | 0 (0.0%) | $0 |
| 6-Person Families | 0 (0.0%) | $0 |
| 7+ Person Families | 10 (10.3%) | $0 |
| Total | 97 (100.0%) | $0 |
Family Income by Number of Earners in Skamokawa Valley
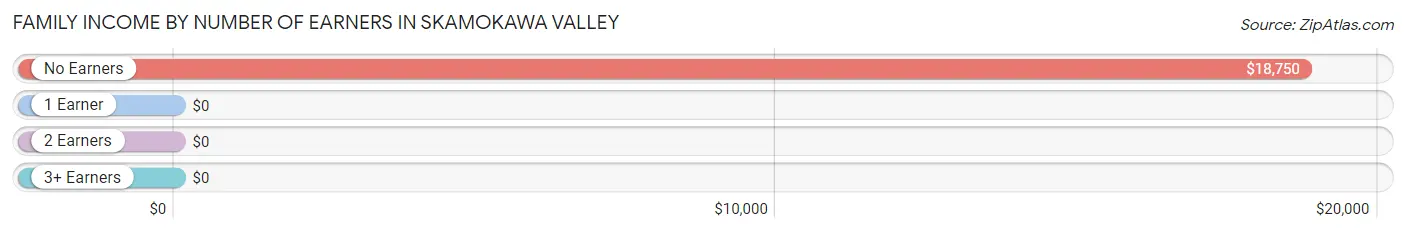
| Number of Earners | # Families | Median Income |
| No Earners | 54 (55.7%) | $18,750 |
| 1 Earner | 24 (24.7%) | $0 |
| 2 Earners | 19 (19.6%) | $0 |
| 3+ Earners | 0 (0.0%) | $0 |
| Total | 97 (100.0%) | $0 |
Household Income in Skamokawa Valley
Household Income Brackets in Skamokawa Valley
With 62 households falling in the category, the $15,000 to $24,999 income range is the most frequent in Skamokawa Valley, accounting for 46.3% of all households.
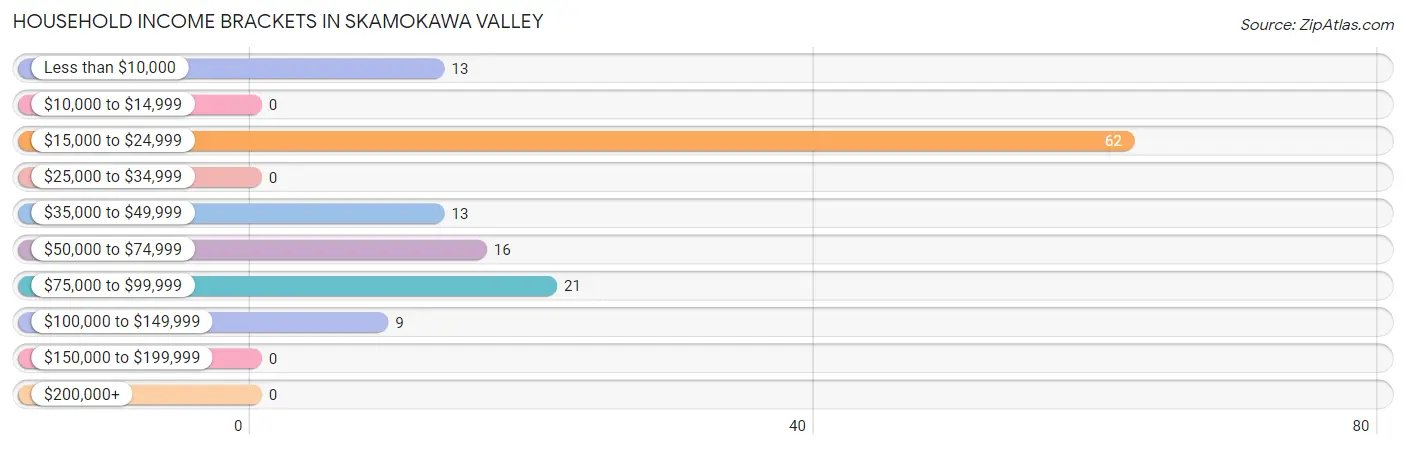
| Income Bracket | # Households | % Households |
| Less than $10,000 | 13 | 9.7% |
| $10,000 to $14,999 | 0 | 0.0% |
| $15,000 to $24,999 | 62 | 46.3% |
| $25,000 to $34,999 | 0 | 0.0% |
| $35,000 to $49,999 | 13 | 9.7% |
| $50,000 to $74,999 | 16 | 11.9% |
| $75,000 to $99,999 | 21 | 15.7% |
| $100,000 to $149,999 | 9 | 6.7% |
| $150,000 to $199,999 | 0 | 0.0% |
| $200,000+ | 0 | 0.0% |
Household Income by Householder Age in Skamokawa Valley
The median household income in Skamokawa Valley is $0, with the highest median household income of $46,346 found in the 65+ years age bracket for the primary householder. A total of 54 households (40.3%) fall into this category.
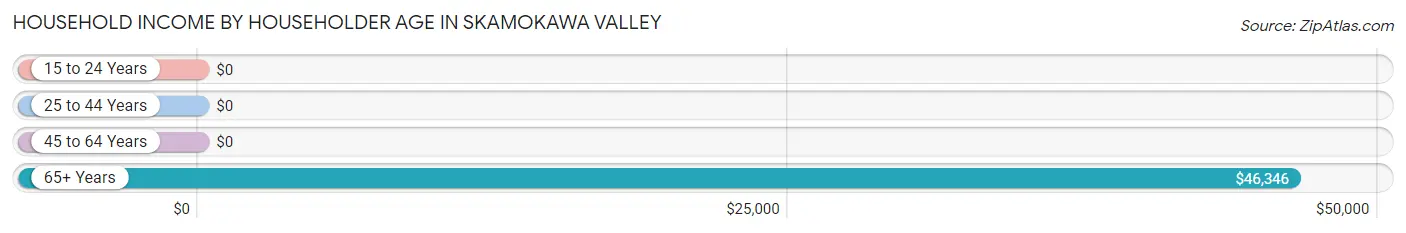
| Income Bracket | # Households | Median Income |
| 15 to 24 Years | 0 (0.0%) | $0 |
| 25 to 44 Years | 0 (0.0%) | $0 |
| 45 to 64 Years | 80 (59.7%) | $0 |
| 65+ Years | 54 (40.3%) | $46,346 |
| Total | 134 (100.0%) | $0 |
Poverty in Skamokawa Valley
Income Below Poverty by Sex and Age in Skamokawa Valley
With 28.7% poverty level for males and 43.0% for females among the residents of Skamokawa Valley, 55 to 64 year old males and 45 to 54 year old females are the most vulnerable to poverty, with 42 males (59.2%) and 7 females (100.0%) in their respective age groups living below the poverty level.
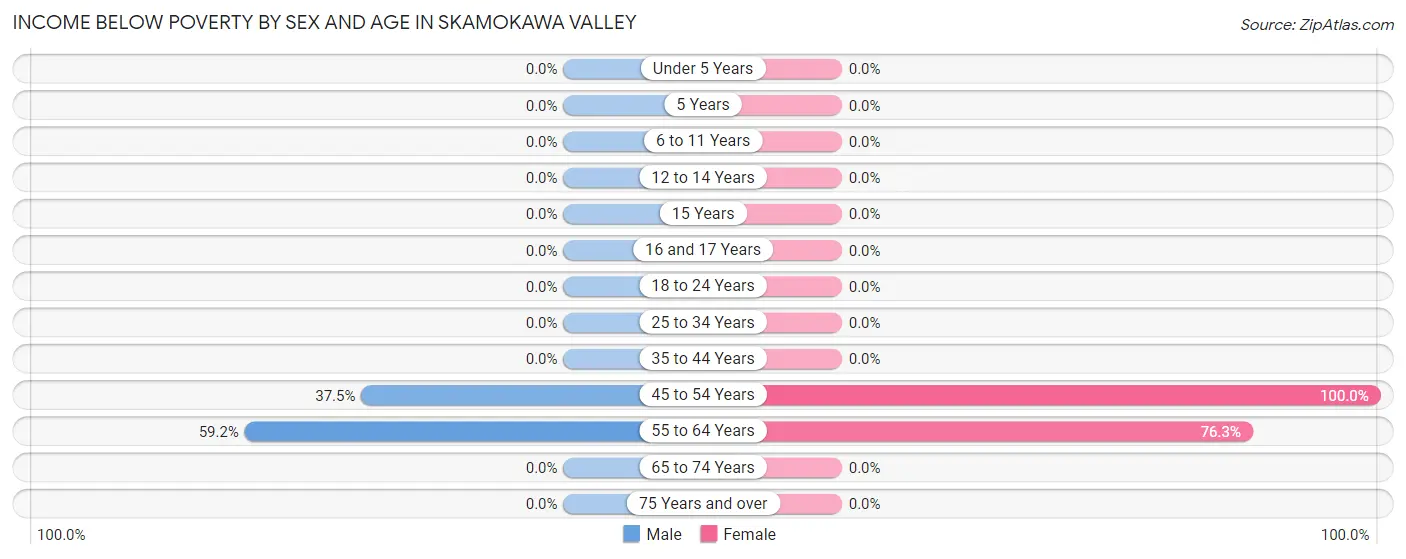
| Age Bracket | Male | Female |
| Under 5 Years | 0 (0.0%) | 0 (0.0%) |
| 5 Years | 0 (0.0%) | 0 (0.0%) |
| 6 to 11 Years | 0 (0.0%) | 0 (0.0%) |
| 12 to 14 Years | 0 (0.0%) | 0 (0.0%) |
| 15 Years | 0 (0.0%) | 0 (0.0%) |
| 16 and 17 Years | 0 (0.0%) | 0 (0.0%) |
| 18 to 24 Years | 0 (0.0%) | 0 (0.0%) |
| 25 to 34 Years | 0 (0.0%) | 0 (0.0%) |
| 35 to 44 Years | 0 (0.0%) | 0 (0.0%) |
| 45 to 54 Years | 6 (37.5%) | 7 (100.0%) |
| 55 to 64 Years | 42 (59.2%) | 45 (76.3%) |
| 65 to 74 Years | 0 (0.0%) | 0 (0.0%) |
| 75 Years and over | 0 (0.0%) | 0 (0.0%) |
| Total | 48 (28.7%) | 52 (43.0%) |
Income Above Poverty by Sex and Age in Skamokawa Valley
According to the poverty statistics in Skamokawa Valley, males aged 6 to 11 years and females aged 6 to 11 years are the age groups that are most secure financially, with 100.0% of males and 100.0% of females in these age groups living above the poverty line.
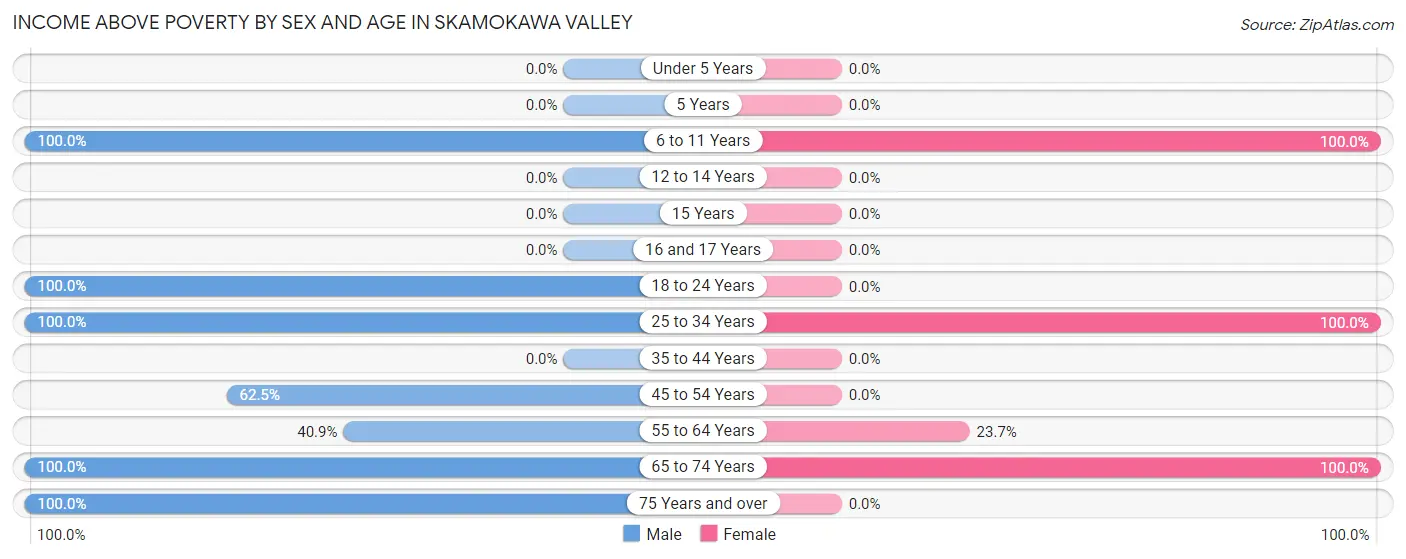
| Age Bracket | Male | Female |
| Under 5 Years | 0 (0.0%) | 0 (0.0%) |
| 5 Years | 0 (0.0%) | 0 (0.0%) |
| 6 to 11 Years | 13 (100.0%) | 19 (100.0%) |
| 12 to 14 Years | 0 (0.0%) | 0 (0.0%) |
| 15 Years | 0 (0.0%) | 0 (0.0%) |
| 16 and 17 Years | 0 (0.0%) | 0 (0.0%) |
| 18 to 24 Years | 8 (100.0%) | 0 (0.0%) |
| 25 to 34 Years | 18 (100.0%) | 9 (100.0%) |
| 35 to 44 Years | 0 (0.0%) | 0 (0.0%) |
| 45 to 54 Years | 10 (62.5%) | 0 (0.0%) |
| 55 to 64 Years | 29 (40.8%) | 14 (23.7%) |
| 65 to 74 Years | 21 (100.0%) | 27 (100.0%) |
| 75 Years and over | 20 (100.0%) | 0 (0.0%) |
| Total | 119 (71.3%) | 69 (57.0%) |
Income Below Poverty Among Married-Couple Families in Skamokawa Valley
The poverty statistics for married-couple families in Skamokawa Valley show that 61.5% or 48 of the total 78 families live below the poverty line. Families with no children have the highest poverty rate of 70.6%, comprising of 48 families. On the other hand, families with 3 or 4 children have the lowest poverty rate of 0.0%, which includes 0 families.
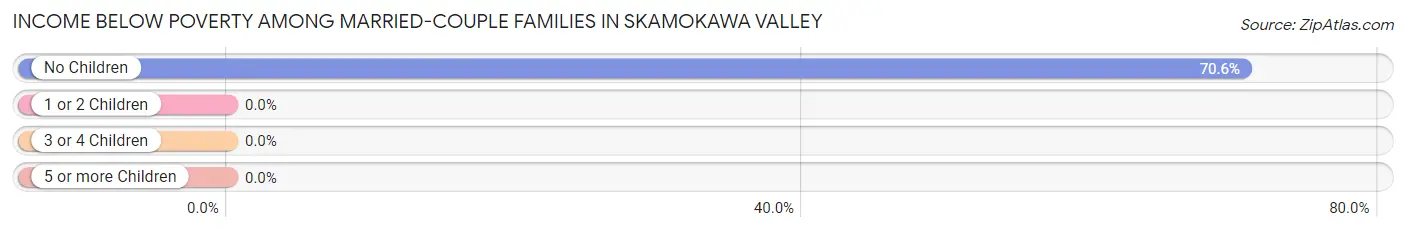
| Children | Above Poverty | Below Poverty |
| No Children | 20 (29.4%) | 48 (70.6%) |
| 1 or 2 Children | 0 (0.0%) | 0 (0.0%) |
| 3 or 4 Children | 10 (100.0%) | 0 (0.0%) |
| 5 or more Children | 0 (0.0%) | 0 (0.0%) |
| Total | 30 (38.5%) | 48 (61.5%) |
Income Below Poverty Among Single-Parent Households in Skamokawa Valley
| Children | Single Father | Single Mother |
| No Children | 0 (0.0%) | 0 (0.0%) |
| 1 or 2 Children | 0 (0.0%) | 0 (0.0%) |
| 3 or 4 Children | 0 (0.0%) | 0 (0.0%) |
| 5 or more Children | 0 (0.0%) | 0 (0.0%) |
| Total | 0 (0.0%) | 0 (0.0%) |
Income Below Poverty Among Married-Couple vs Single-Parent Households in Skamokawa Valley
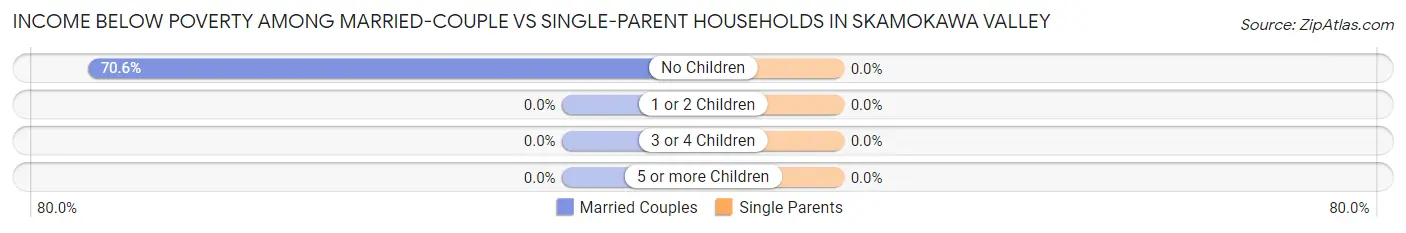
| Children | Married-Couple Families | Single-Parent Households |
| No Children | 48 (70.6%) | 0 (0.0%) |
| 1 or 2 Children | 0 (0.0%) | 0 (0.0%) |
| 3 or 4 Children | 0 (0.0%) | 0 (0.0%) |
| 5 or more Children | 0 (0.0%) | 0 (0.0%) |
| Total | 48 (61.5%) | 0 (0.0%) |
Race in Skamokawa Valley
The most populous races in Skamokawa Valley are White / Caucasian (252 | 87.5%), Two or more Races (29 | 10.1%), and Native / Alaskan (7 | 2.4%).
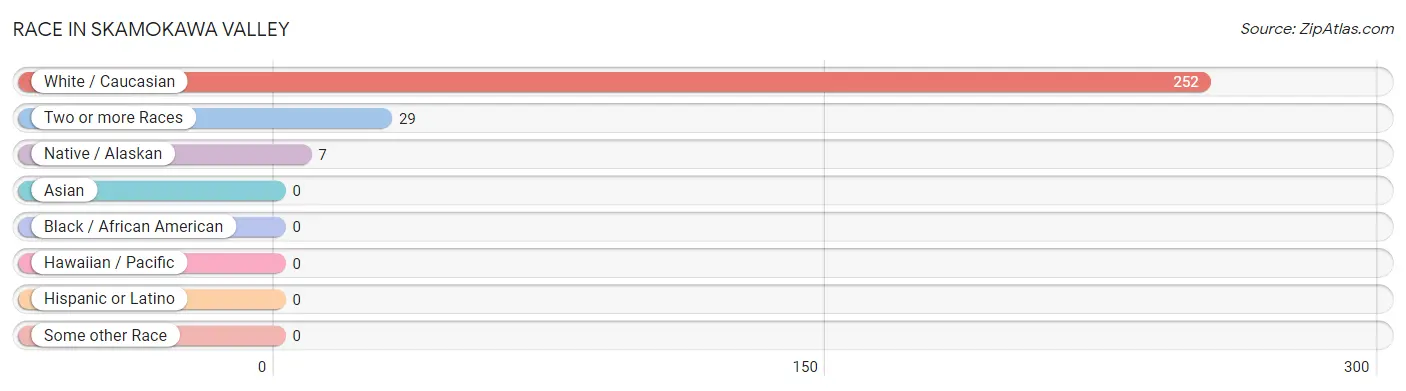
| Race | # Population | % Population |
| Asian | 0 | 0.0% |
| Black / African American | 0 | 0.0% |
| Hawaiian / Pacific | 0 | 0.0% |
| Hispanic or Latino | 0 | 0.0% |
| Native / Alaskan | 7 | 2.4% |
| White / Caucasian | 252 | 87.5% |
| Two or more Races | 29 | 10.1% |
| Some other Race | 0 | 0.0% |
| Total | 288 | 100.0% |
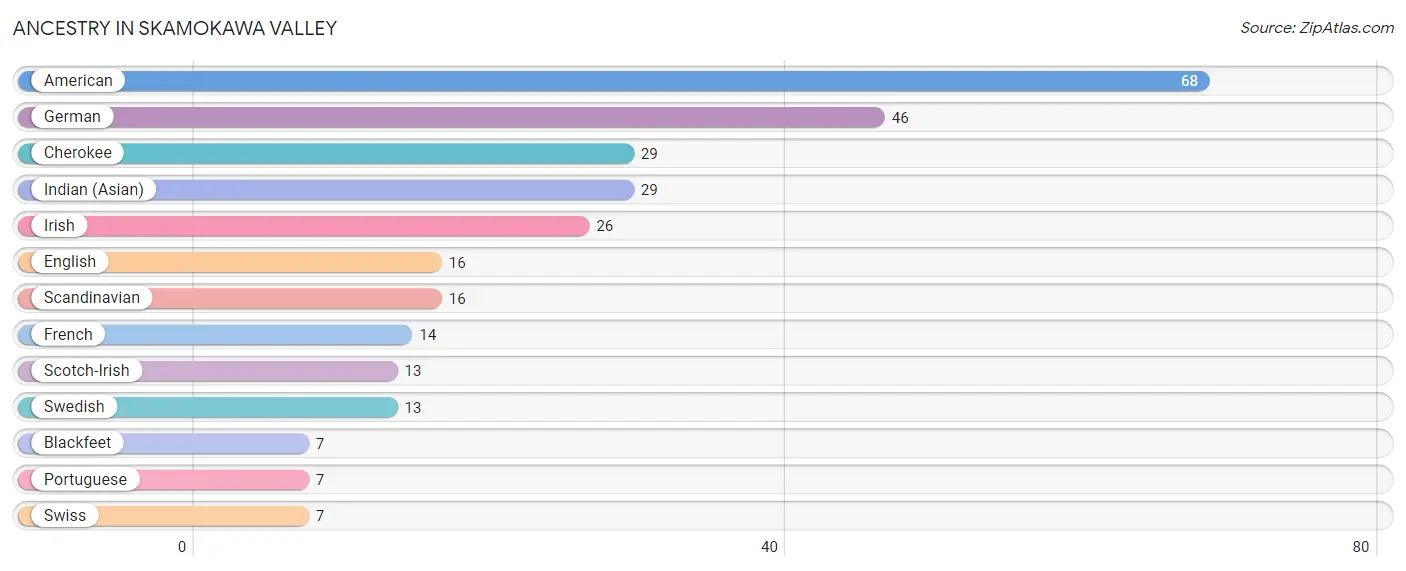
Ancestry in Skamokawa Valley
The most populous ancestries reported in Skamokawa Valley are American (68 | 23.6%), German (46 | 16.0%), Cherokee (29 | 10.1%), Indian (Asian) (29 | 10.1%), and Irish (26 | 9.0%), together accounting for 68.8% of all Skamokawa Valley residents.
| Ancestry | # Population | % Population |
| American | 68 | 23.6% |
| Blackfeet | 7 | 2.4% |
| Cherokee | 29 | 10.1% |
| English | 16 | 5.6% |
| French | 14 | 4.9% |
| German | 46 | 16.0% |
| Indian (Asian) | 29 | 10.1% |
| Irish | 26 | 9.0% |
| Portuguese | 7 | 2.4% |
| Scandinavian | 16 | 5.6% |
| Scotch-Irish | 13 | 4.5% |
| Swedish | 13 | 4.5% |
| Swiss | 7 | 2.4% | View All 13 Rows |
Immigrants in Skamokawa Valley
The most numerous immigrant groups reported in Skamokawa Valley came from , and Canada (4 | 1.4%), together accounting for 1.4% of all Skamokawa Valley residents.

| Immigration Origin | # Population | % Population |
| Canada | 4 | 1.4% | View All 1 Rows |
Sex and Age in Skamokawa Valley
Sex and Age in Skamokawa Valley
The most populous age groups in Skamokawa Valley are 60 to 64 Years (71 | 42.5%) for men and 60 to 64 Years (52 | 43.0%) for women.
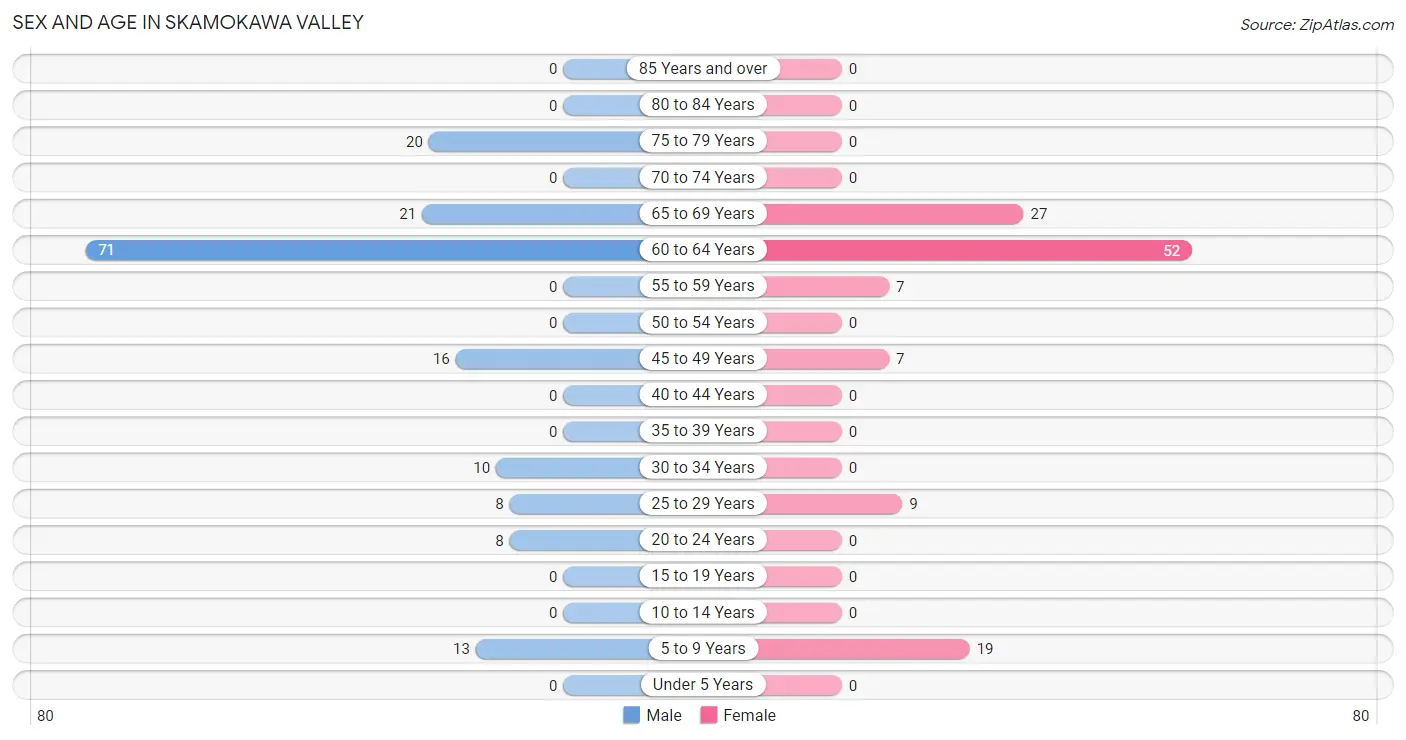
| Age Bracket | Male | Female |
| Under 5 Years | 0 (0.0%) | 0 (0.0%) |
| 5 to 9 Years | 13 (7.8%) | 19 (15.7%) |
| 10 to 14 Years | 0 (0.0%) | 0 (0.0%) |
| 15 to 19 Years | 0 (0.0%) | 0 (0.0%) |
| 20 to 24 Years | 8 (4.8%) | 0 (0.0%) |
| 25 to 29 Years | 8 (4.8%) | 9 (7.4%) |
| 30 to 34 Years | 10 (6.0%) | 0 (0.0%) |
| 35 to 39 Years | 0 (0.0%) | 0 (0.0%) |
| 40 to 44 Years | 0 (0.0%) | 0 (0.0%) |
| 45 to 49 Years | 16 (9.6%) | 7 (5.8%) |
| 50 to 54 Years | 0 (0.0%) | 0 (0.0%) |
| 55 to 59 Years | 0 (0.0%) | 7 (5.8%) |
| 60 to 64 Years | 71 (42.5%) | 52 (43.0%) |
| 65 to 69 Years | 21 (12.6%) | 27 (22.3%) |
| 70 to 74 Years | 0 (0.0%) | 0 (0.0%) |
| 75 to 79 Years | 20 (12.0%) | 0 (0.0%) |
| 80 to 84 Years | 0 (0.0%) | 0 (0.0%) |
| 85 Years and over | 0 (0.0%) | 0 (0.0%) |
| Total | 167 (100.0%) | 121 (100.0%) |
Families and Households in Skamokawa Valley
Median Family Size in Skamokawa Valley
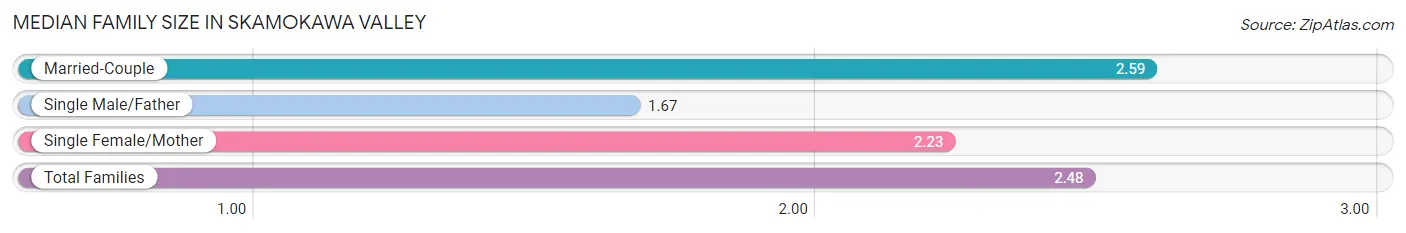
The median family size in Skamokawa Valley is 2.48 persons per family, with married-couple families (78 | 80.4%) accounting for the largest median family size of 2.59 persons per family. On the other hand, single male/father families (6 | 6.2%) represent the smallest median family size with 1.67 persons per family.
| Family Type | # Families | Family Size |
| Married-Couple | 78 (80.4%) | 2.59 |
| Single Male/Father | 6 (6.2%) | 1.67 |
| Single Female/Mother | 13 (13.4%) | 2.23 |
| Total Families | 97 (100.0%) | 2.48 |
Median Household Size in Skamokawa Valley
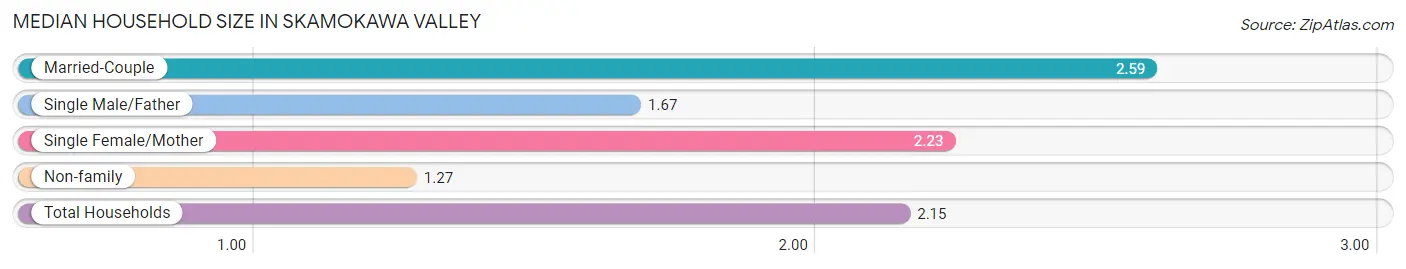
The median household size in Skamokawa Valley is 2.15 persons per household, with married-couple households (78 | 58.2%) accounting for the largest median household size of 2.59 persons per household. non-family households (37 | 27.6%) represent the smallest median household size with 1.27 persons per household.
| Household Type | # Households | Household Size |
| Married-Couple | 78 (58.2%) | 2.59 |
| Single Male/Father | 6 (4.5%) | 1.67 |
| Single Female/Mother | 13 (9.7%) | 2.23 |
| Non-family | 37 (27.6%) | 1.27 |
| Total Households | 134 (100.0%) | 2.15 |
Household Size by Marriage Status in Skamokawa Valley
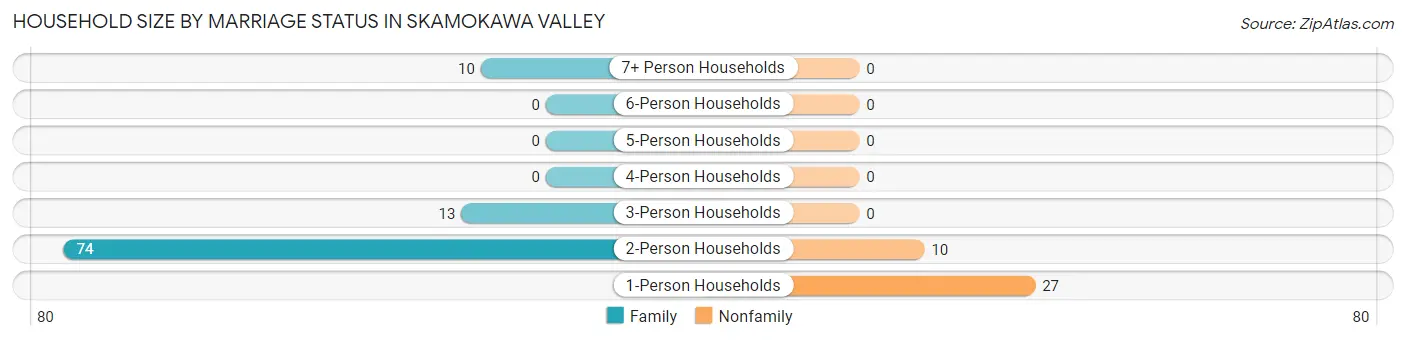
Out of a total of 134 households in Skamokawa Valley, 97 (72.4%) are family households, while 37 (27.6%) are nonfamily households. The most numerous type of family households are 2-person households, comprising 74, and the most common type of nonfamily households are 1-person households, comprising 27.
| Household Size | Family Households | Nonfamily Households |
| 1-Person Households | - | 27 (20.2%) |
| 2-Person Households | 74 (55.2%) | 10 (7.5%) |
| 3-Person Households | 13 (9.7%) | 0 (0.0%) |
| 4-Person Households | 0 (0.0%) | 0 (0.0%) |
| 5-Person Households | 0 (0.0%) | 0 (0.0%) |
| 6-Person Households | 0 (0.0%) | 0 (0.0%) |
| 7+ Person Households | 10 (7.5%) | 0 (0.0%) |
| Total | 97 (72.4%) | 37 (27.6%) |
Female Fertility in Skamokawa Valley
Fertility by Age in Skamokawa Valley
| Age Bracket | Women with Births | Births / 1,000 Women |
| 15 to 19 years | 0 (0.0%) | 0.0 |
| 20 to 34 years | 0 (0.0%) | 0.0 |
| 35 to 50 years | 0 (0.0%) | 0.0 |
| Total | 0 (0.0%) | 0.0 |
Fertility by Age by Marriage Status in Skamokawa Valley
| Age Bracket | Married | Unmarried |
| 15 to 19 years | 0 (0.0%) | 0 (0.0%) |
| 20 to 34 years | 0 (0.0%) | 0 (0.0%) |
| 35 to 50 years | 0 (0.0%) | 0 (0.0%) |
| Total | 0 (0.0%) | 0 (0.0%) |
Fertility by Education in Skamokawa Valley
| Educational Attainment | Women with Births | Births / 1,000 Women |
| Less than High School | 0 (0.0%) | 0.0 |
| High School Diploma | 0 (0.0%) | 0.0 |
| College or Associate's Degree | 0 (0.0%) | 0.0 |
| Bachelor's Degree | 0 (0.0%) | 0.0 |
| Graduate Degree | 0 (0.0%) | 0.0 |
| Total | 0 (0.0%) | 0.0 |
Fertility by Education by Marriage Status in Skamokawa Valley
| Educational Attainment | Married | Unmarried |
| Less than High School | 0 (0.0%) | 0 (0.0%) |
| High School Diploma | 0 (0.0%) | 0 (0.0%) |
| College or Associate's Degree | 0 (0.0%) | 0 (0.0%) |
| Bachelor's Degree | 0 (0.0%) | 0 (0.0%) |
| Graduate Degree | 0 (0.0%) | 0 (0.0%) |
| Total | 0 (0.0%) | 0 (0.0%) |
Employment Characteristics in Skamokawa Valley
Employment by Class of Employer in Skamokawa Valley
Among the 34 employed individuals in Skamokawa Valley, private company employees (15 | 44.1%), self-employed (incorporated) (10 | 29.4%), and state government employees (9 | 26.5%) make up the most common classes of employment.
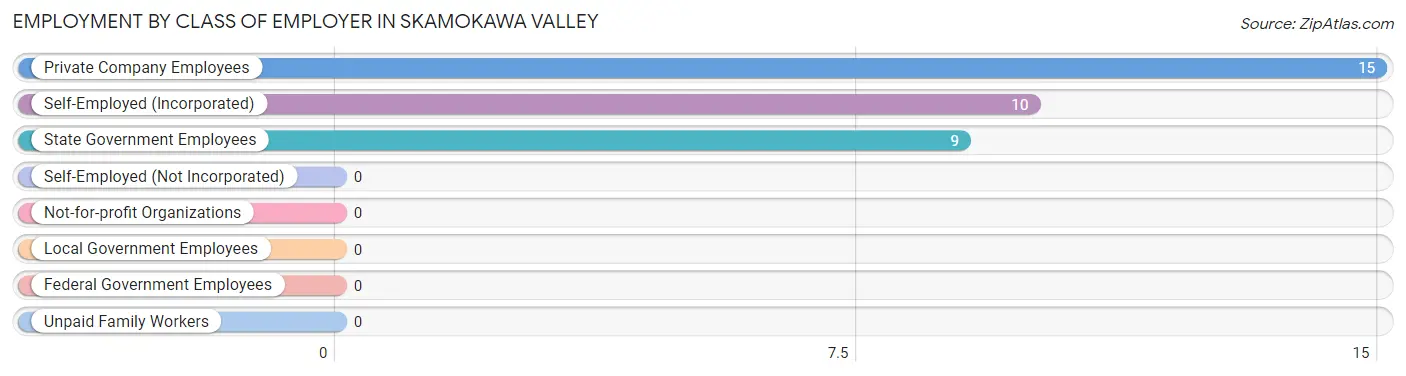
| Employer Class | # Employees | % Employees |
| Private Company Employees | 15 | 44.1% |
| Self-Employed (Incorporated) | 10 | 29.4% |
| Self-Employed (Not Incorporated) | 0 | 0.0% |
| Not-for-profit Organizations | 0 | 0.0% |
| Local Government Employees | 0 | 0.0% |
| State Government Employees | 9 | 26.5% |
| Federal Government Employees | 0 | 0.0% |
| Unpaid Family Workers | 0 | 0.0% |
| Total | 34 | 100.0% |
Employment Status by Age in Skamokawa Valley
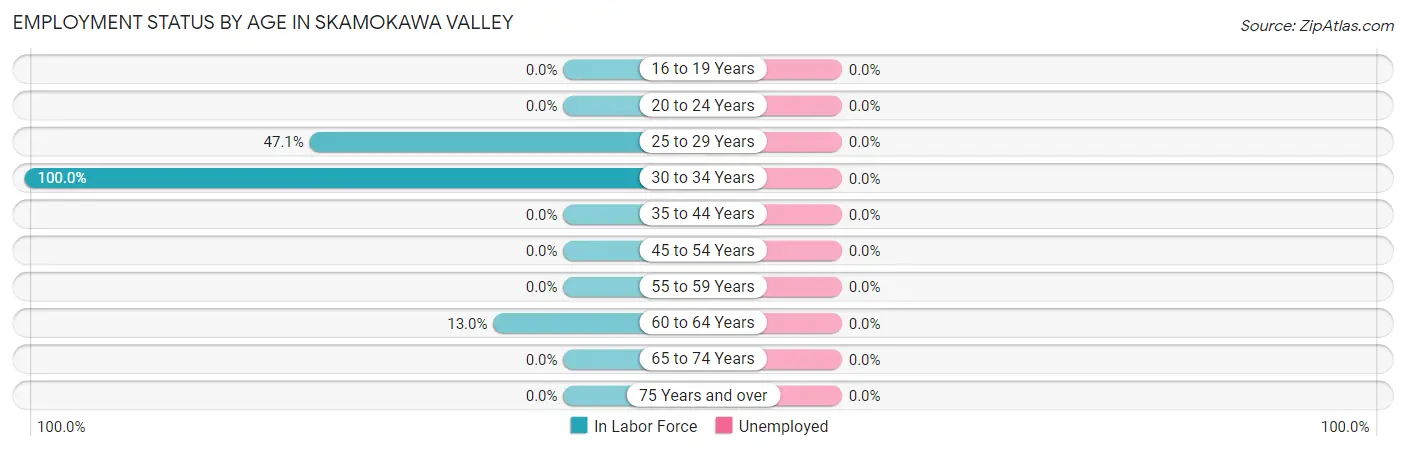
| Age Bracket | In Labor Force | Unemployed |
| 16 to 19 Years | 0 (0.0%) | 0 (0.0%) |
| 20 to 24 Years | 0 (0.0%) | 0 (0.0%) |
| 25 to 29 Years | 8 (47.1%) | 0 (0.0%) |
| 30 to 34 Years | 10 (100.0%) | 0 (0.0%) |
| 35 to 44 Years | 0 (0.0%) | 0 (0.0%) |
| 45 to 54 Years | 0 (0.0%) | 0 (0.0%) |
| 55 to 59 Years | 0 (0.0%) | 0 (0.0%) |
| 60 to 64 Years | 16 (13.0%) | 0 (0.0%) |
| 65 to 74 Years | 0 (0.0%) | 0 (0.0%) |
| 75 Years and over | 0 (0.0%) | 0 (0.0%) |
| Total | 34 (13.3%) | 0 (0.0%) |
Employment Status by Educational Attainment in Skamokawa Valley
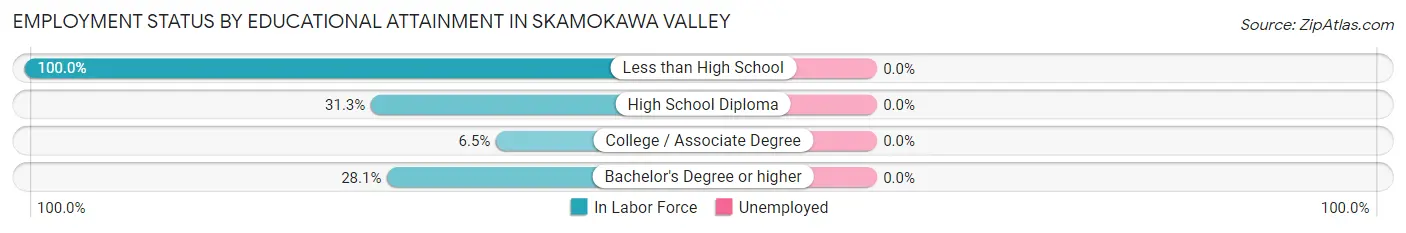
| Educational Attainment | In Labor Force | Unemployed |
| Less than High School | 8 (100.0%) | 0 (0.0%) |
| High School Diploma | 10 (31.3%) | 0 (0.0%) |
| College / Associate Degree | 7 (6.5%) | 0 (0.0%) |
| Bachelor's Degree or higher | 9 (28.1%) | 0 (0.0%) |
| Total | 34 (18.9%) | 0 (0.0%) |
Employment Occupations by Sex in Skamokawa Valley
Management, Business, Science and Arts Occupations
The most common Management, Business, Science and Arts occupations in Skamokawa Valley are , and Management (9 | 26.5%).
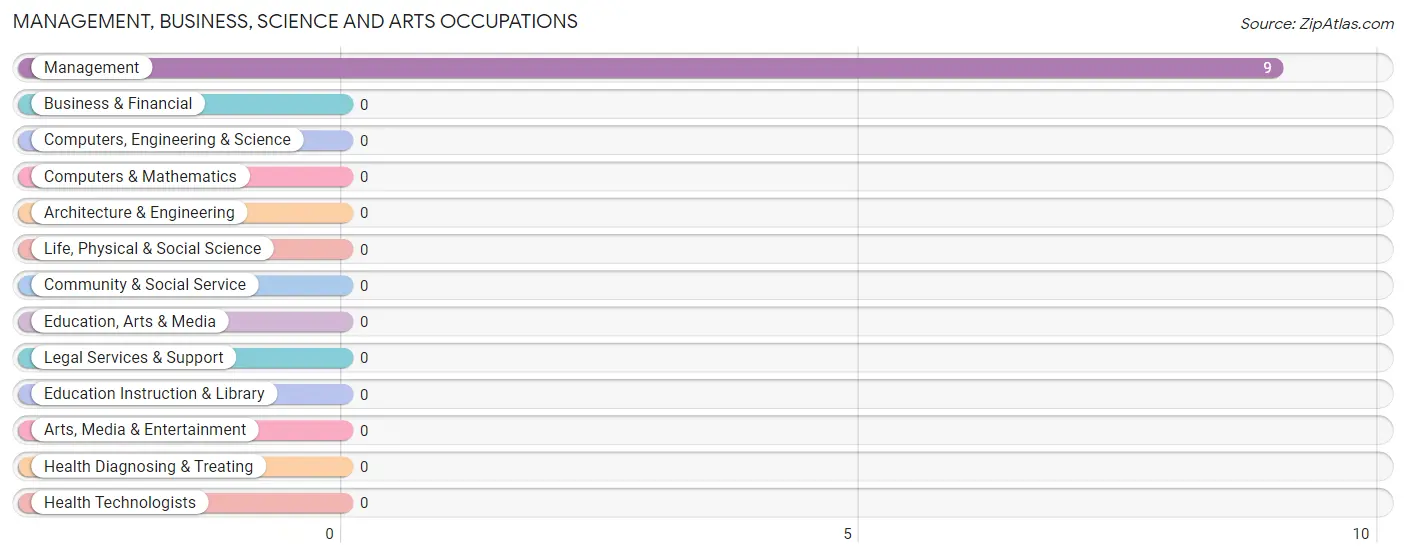
Management, Business, Science and Arts Occupations by Sex
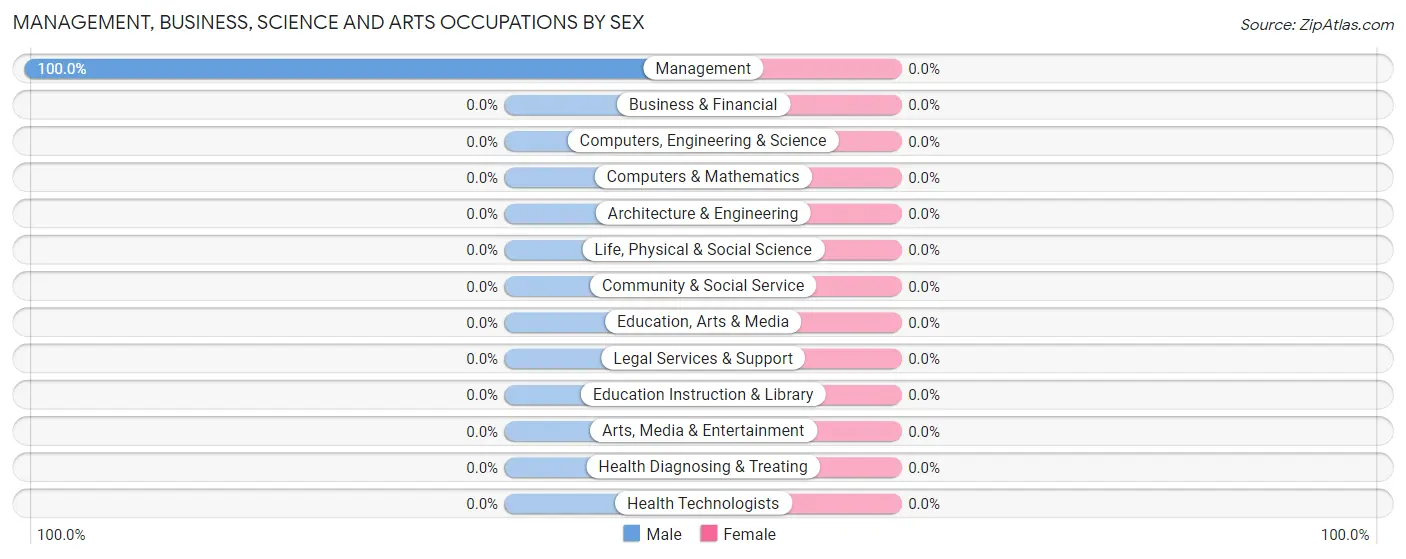
| Occupation | Male | Female |
| Management | 9 (100.0%) | 0 (0.0%) |
| Business & Financial | 0 (0.0%) | 0 (0.0%) |
| Computers, Engineering & Science | 0 (0.0%) | 0 (0.0%) |
| Computers & Mathematics | 0 (0.0%) | 0 (0.0%) |
| Architecture & Engineering | 0 (0.0%) | 0 (0.0%) |
| Life, Physical & Social Science | 0 (0.0%) | 0 (0.0%) |
| Community & Social Service | 0 (0.0%) | 0 (0.0%) |
| Education, Arts & Media | 0 (0.0%) | 0 (0.0%) |
| Legal Services & Support | 0 (0.0%) | 0 (0.0%) |
| Education Instruction & Library | 0 (0.0%) | 0 (0.0%) |
| Arts, Media & Entertainment | 0 (0.0%) | 0 (0.0%) |
| Health Diagnosing & Treating | 0 (0.0%) | 0 (0.0%) |
| Health Technologists | 0 (0.0%) | 0 (0.0%) |
| Total (Category) | 9 (100.0%) | 0 (0.0%) |
| Total (Overall) | 27 (79.4%) | 7 (20.6%) |
Services Occupations
The most common Services occupations in Skamokawa Valley are , and Healthcare Support (7 | 20.6%).
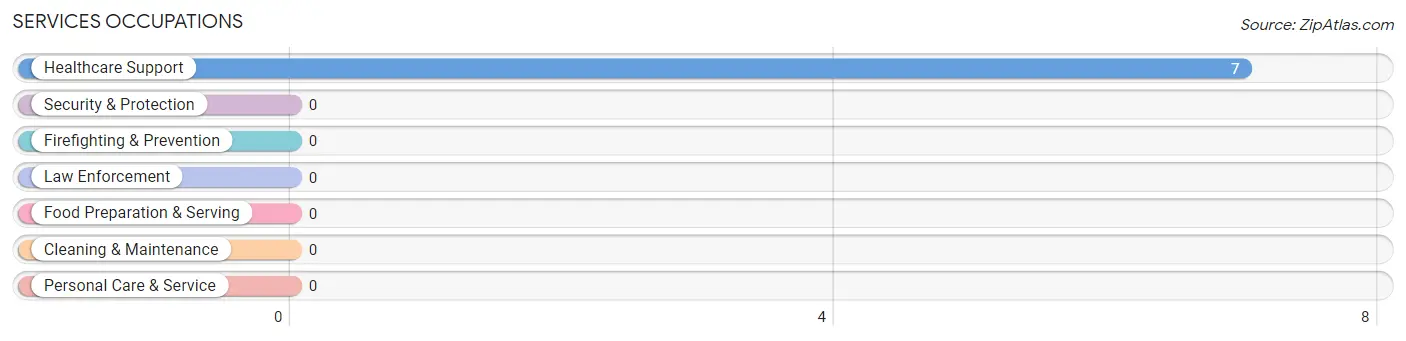
Services Occupations by Sex
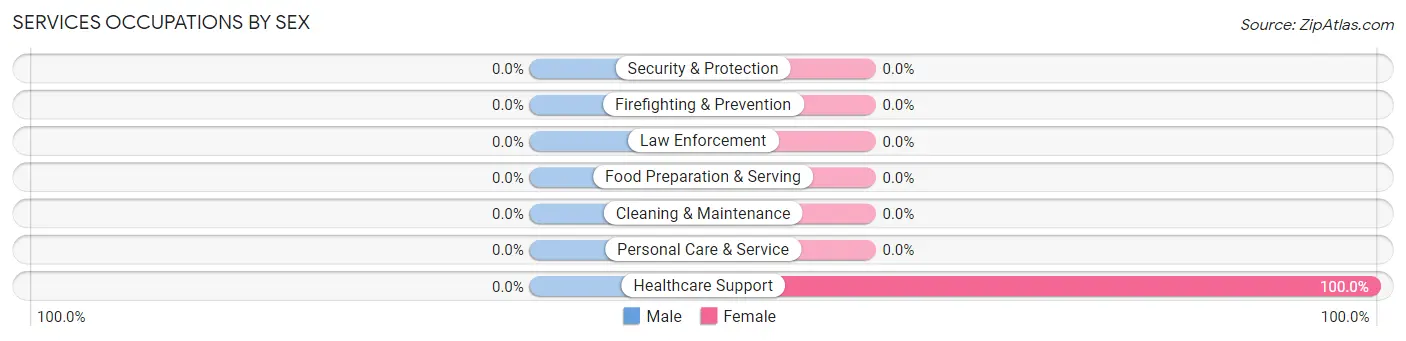
| Occupation | Male | Female |
| Healthcare Support | 0 (0.0%) | 7 (100.0%) |
| Security & Protection | 0 (0.0%) | 0 (0.0%) |
| Firefighting & Prevention | 0 (0.0%) | 0 (0.0%) |
| Law Enforcement | 0 (0.0%) | 0 (0.0%) |
| Food Preparation & Serving | 0 (0.0%) | 0 (0.0%) |
| Cleaning & Maintenance | 0 (0.0%) | 0 (0.0%) |
| Personal Care & Service | 0 (0.0%) | 0 (0.0%) |
| Total (Category) | 0 (0.0%) | 7 (100.0%) |
| Total (Overall) | 27 (79.4%) | 7 (20.6%) |
Sales and Office Occupations
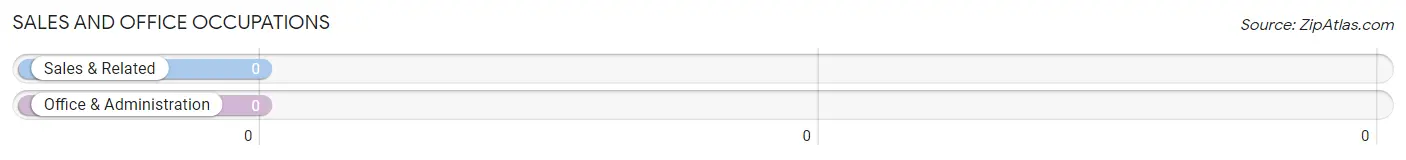
Sales and Office Occupations by Sex
| Occupation | Male | Female |
| Sales & Related | 0 (0.0%) | 0 (0.0%) |
| Office & Administration | 0 (0.0%) | 0 (0.0%) |
| Total (Category) | 0 (0.0%) | 0 (0.0%) |
| Total (Overall) | 27 (79.4%) | 7 (20.6%) |
Natural Resources, Construction and Maintenance Occupations
The most common Natural Resources, Construction and Maintenance occupations in Skamokawa Valley are , and Construction & Extraction (10 | 29.4%).
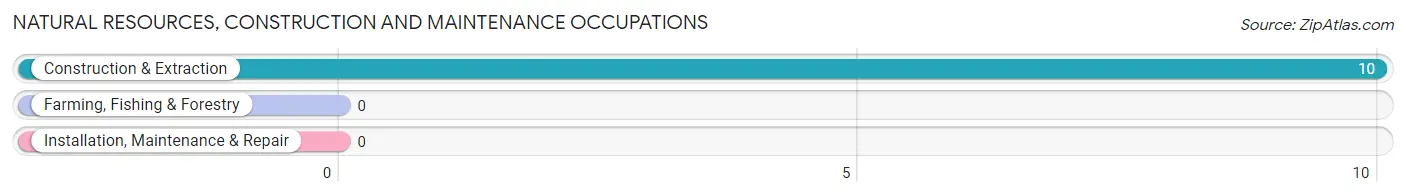
Natural Resources, Construction and Maintenance Occupations by Sex
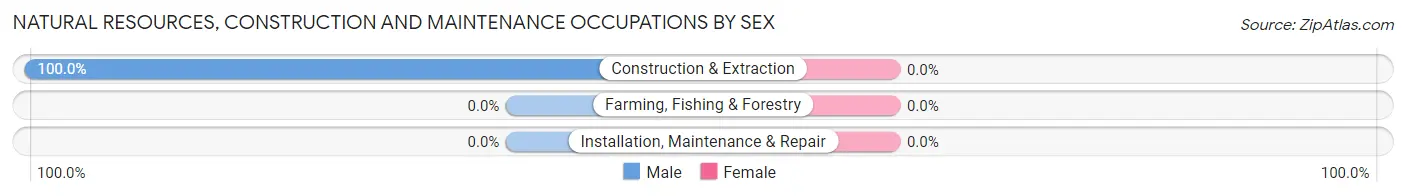
| Occupation | Male | Female |
| Farming, Fishing & Forestry | 0 (0.0%) | 0 (0.0%) |
| Construction & Extraction | 10 (100.0%) | 0 (0.0%) |
| Installation, Maintenance & Repair | 0 (0.0%) | 0 (0.0%) |
| Total (Category) | 10 (100.0%) | 0 (0.0%) |
| Total (Overall) | 27 (79.4%) | 7 (20.6%) |
Production, Transportation and Moving Occupations
The most common Production, Transportation and Moving occupations in Skamokawa Valley are , and Production (8 | 23.5%).
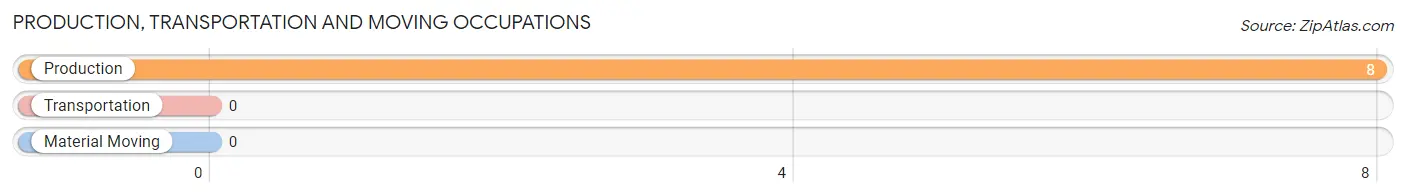
Production, Transportation and Moving Occupations by Sex
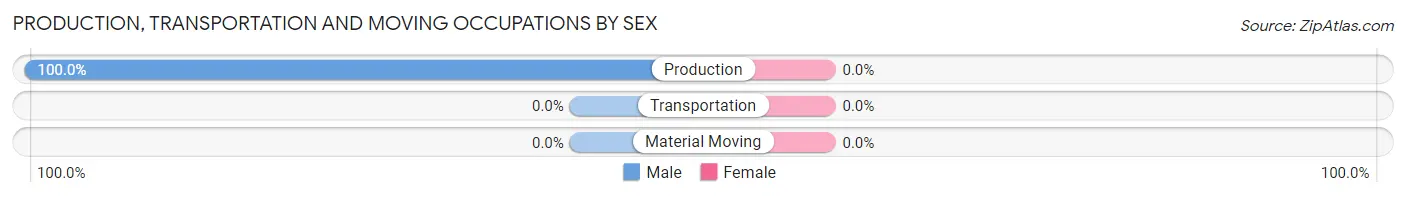
| Occupation | Male | Female |
| Production | 8 (100.0%) | 0 (0.0%) |
| Transportation | 0 (0.0%) | 0 (0.0%) |
| Material Moving | 0 (0.0%) | 0 (0.0%) |
| Total (Category) | 8 (100.0%) | 0 (0.0%) |
| Total (Overall) | 27 (79.4%) | 7 (20.6%) |
Employment Industries by Sex in Skamokawa Valley
Employment Industries in Skamokawa Valley
The major employment industries in Skamokawa Valley include Construction (10 | 29.4%), Public Administration (9 | 26.5%), Manufacturing (8 | 23.5%), and Health Care & Social Assistance (7 | 20.6%).
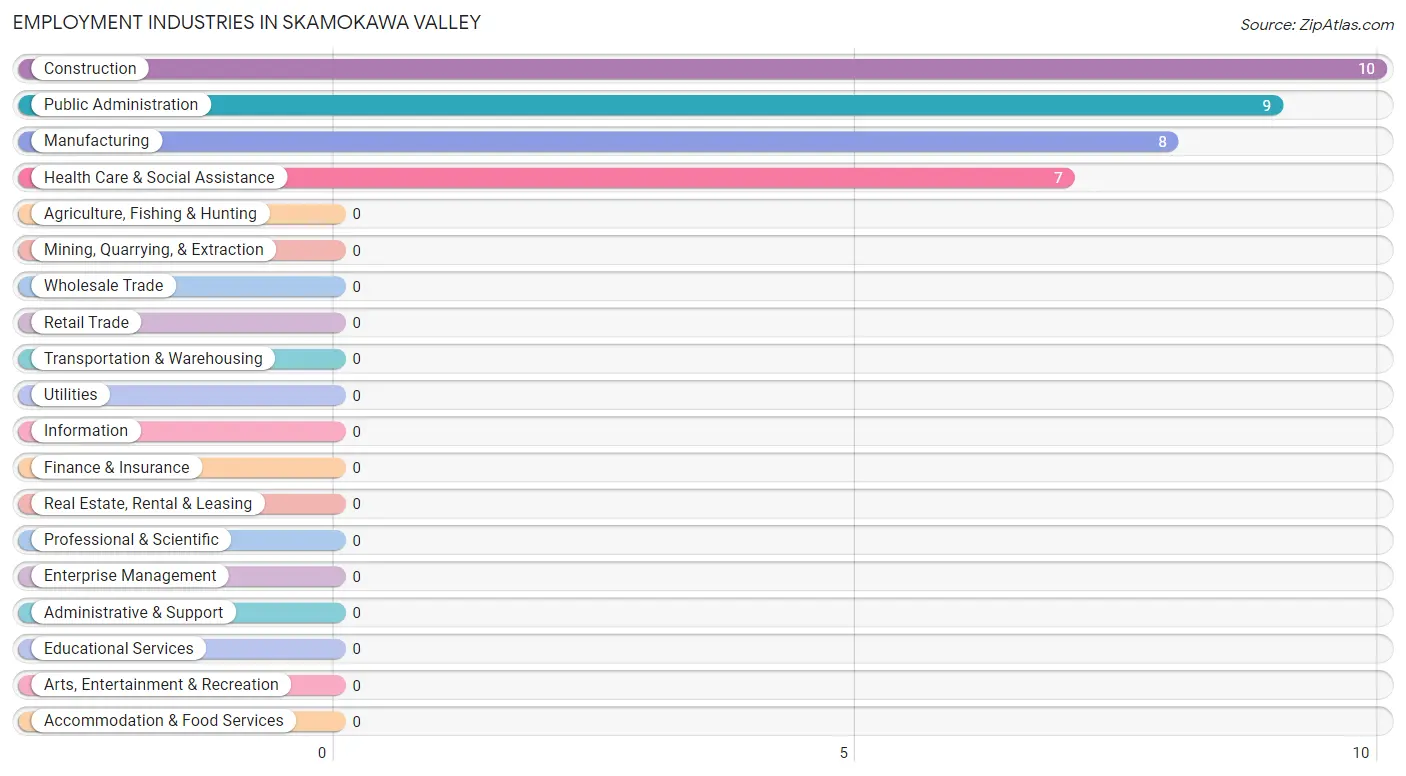
Employment Industries by Sex in Skamokawa Valley
| Industry | Male | Female |
| Agriculture, Fishing & Hunting | 0 (0.0%) | 0 (0.0%) |
| Mining, Quarrying, & Extraction | 0 (0.0%) | 0 (0.0%) |
| Construction | 10 (100.0%) | 0 (0.0%) |
| Manufacturing | 8 (100.0%) | 0 (0.0%) |
| Wholesale Trade | 0 (0.0%) | 0 (0.0%) |
| Retail Trade | 0 (0.0%) | 0 (0.0%) |
| Transportation & Warehousing | 0 (0.0%) | 0 (0.0%) |
| Utilities | 0 (0.0%) | 0 (0.0%) |
| Information | 0 (0.0%) | 0 (0.0%) |
| Finance & Insurance | 0 (0.0%) | 0 (0.0%) |
| Real Estate, Rental & Leasing | 0 (0.0%) | 0 (0.0%) |
| Professional & Scientific | 0 (0.0%) | 0 (0.0%) |
| Enterprise Management | 0 (0.0%) | 0 (0.0%) |
| Administrative & Support | 0 (0.0%) | 0 (0.0%) |
| Educational Services | 0 (0.0%) | 0 (0.0%) |
| Health Care & Social Assistance | 0 (0.0%) | 7 (100.0%) |
| Arts, Entertainment & Recreation | 0 (0.0%) | 0 (0.0%) |
| Accommodation & Food Services | 0 (0.0%) | 0 (0.0%) |
| Public Administration | 9 (100.0%) | 0 (0.0%) |
| Total | 27 (79.4%) | 7 (20.6%) |
Education in Skamokawa Valley
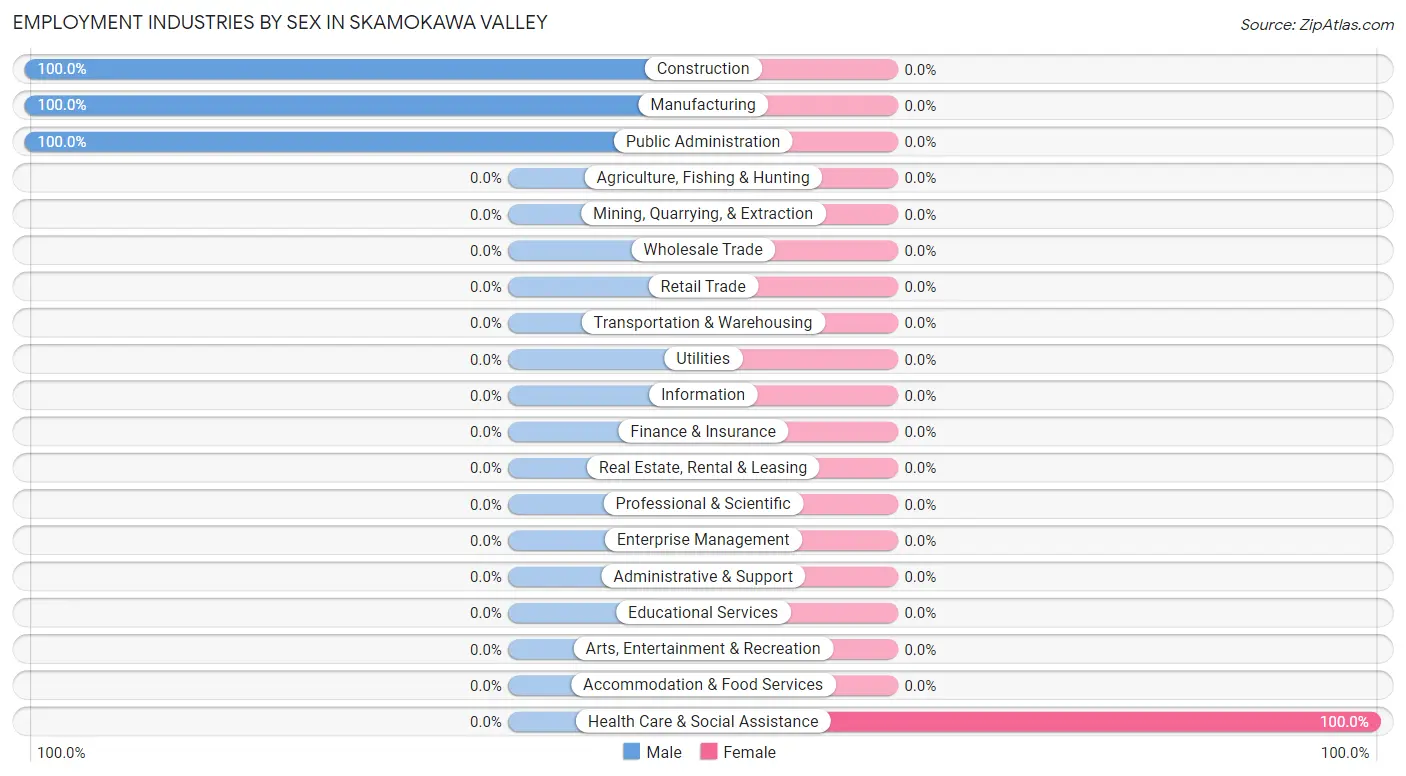
School Enrollment in Skamokawa Valley
The most common levels of schooling among the 32 students in Skamokawa Valley are elementary school (23 | 71.9%), and kindergarten (9 | 28.1%).
| School Level | # Students | % Students |
| Nursery / Preschool | 0 | 0.0% |
| Kindergarten | 9 | 28.1% |
| Elementary School | 23 | 71.9% |
| Middle School | 0 | 0.0% |
| High School | 0 | 0.0% |
| College / Undergraduate | 0 | 0.0% |
| Graduate / Professional | 0 | 0.0% |
| Total | 32 | 100.0% |
School Enrollment by Age by Funding Source in Skamokawa Valley
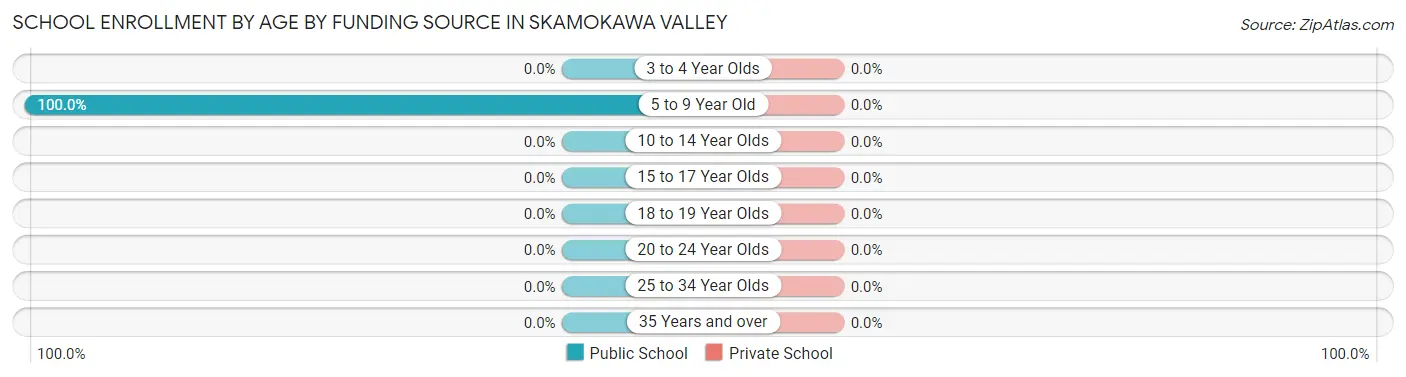
| Age Bracket | Public School | Private School |
| 3 to 4 Year Olds | 0 (0.0%) | 0 (0.0%) |
| 5 to 9 Year Old | 32 (100.0%) | 0 (0.0%) |
| 10 to 14 Year Olds | 0 (0.0%) | 0 (0.0%) |
| 15 to 17 Year Olds | 0 (0.0%) | 0 (0.0%) |
| 18 to 19 Year Olds | 0 (0.0%) | 0 (0.0%) |
| 20 to 24 Year Olds | 0 (0.0%) | 0 (0.0%) |
| 25 to 34 Year Olds | 0 (0.0%) | 0 (0.0%) |
| 35 Years and over | 0 (0.0%) | 0 (0.0%) |
| Total | 32 (100.0%) | 0 (0.0%) |
Educational Attainment by Field of Study in Skamokawa Valley
Education (25 | 43.9%), business (10 | 17.5%), liberal arts & history (9 | 15.8%), social sciences (7 | 12.3%), and bio, nature & agricultural (6 | 10.5%) are the most common fields of study among 57 individuals in Skamokawa Valley who have obtained a bachelor's degree or higher.
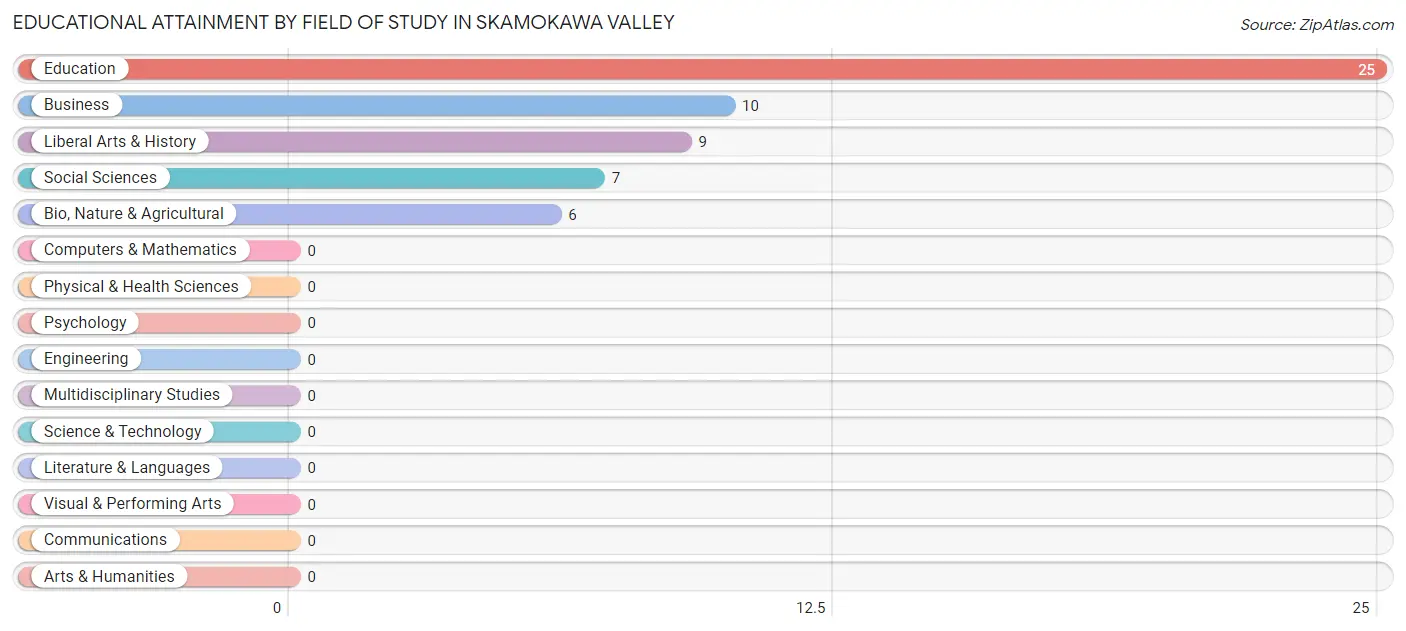
| Field of Study | # Graduates | % Graduates |
| Computers & Mathematics | 0 | 0.0% |
| Bio, Nature & Agricultural | 6 | 10.5% |
| Physical & Health Sciences | 0 | 0.0% |
| Psychology | 0 | 0.0% |
| Social Sciences | 7 | 12.3% |
| Engineering | 0 | 0.0% |
| Multidisciplinary Studies | 0 | 0.0% |
| Science & Technology | 0 | 0.0% |
| Business | 10 | 17.5% |
| Education | 25 | 43.9% |
| Literature & Languages | 0 | 0.0% |
| Liberal Arts & History | 9 | 15.8% |
| Visual & Performing Arts | 0 | 0.0% |
| Communications | 0 | 0.0% |
| Arts & Humanities | 0 | 0.0% |
| Total | 57 | 100.0% |
Transportation & Commute in Skamokawa Valley
Vehicle Availability by Sex in Skamokawa Valley
The most prevalent vehicle ownership categories in Skamokawa Valley are males with 5 or more vehicles (10, accounting for 37.0%) and females with 5 or more vehicles (0, making up 142.9%).
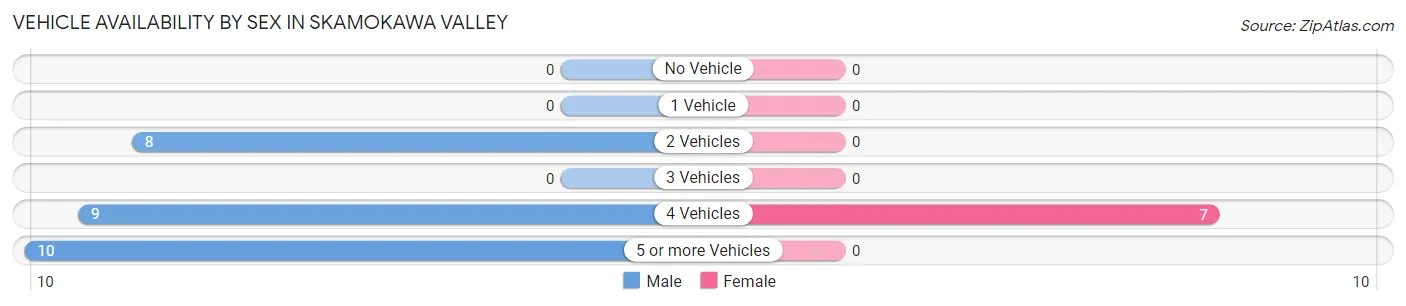
| Vehicles Available | Male | Female |
| No Vehicle | 0 (0.0%) | 0 (0.0%) |
| 1 Vehicle | 0 (0.0%) | 0 (0.0%) |
| 2 Vehicles | 8 (29.6%) | 0 (0.0%) |
| 3 Vehicles | 0 (0.0%) | 0 (0.0%) |
| 4 Vehicles | 9 (33.3%) | 7 (100.0%) |
| 5 or more Vehicles | 10 (37.0%) | 0 (0.0%) |
| Total | 27 (100.0%) | 7 (100.0%) |
Commute Time in Skamokawa Valley
The most frequently occuring commute durations in Skamokawa Valley are 45 to 59 minutes (15 commuters, 44.1%), 90 or more minutes (10 commuters, 29.4%), and 35 to 39 minutes (9 commuters, 26.5%).
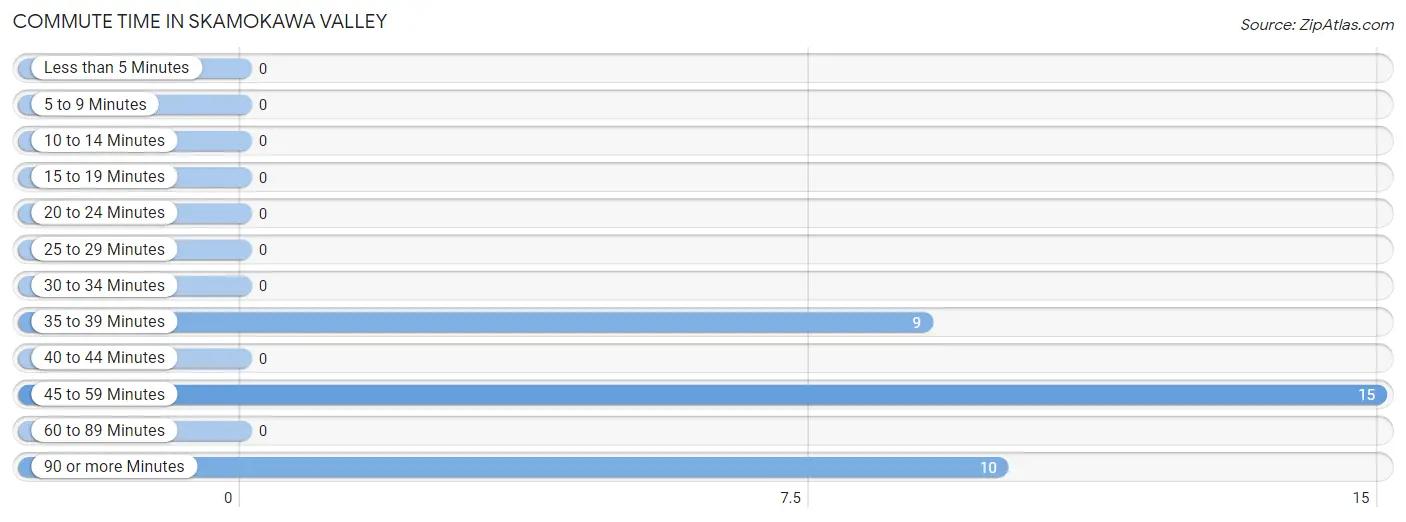
| Commute Time | # Commuters | % Commuters |
| Less than 5 Minutes | 0 | 0.0% |
| 5 to 9 Minutes | 0 | 0.0% |
| 10 to 14 Minutes | 0 | 0.0% |
| 15 to 19 Minutes | 0 | 0.0% |
| 20 to 24 Minutes | 0 | 0.0% |
| 25 to 29 Minutes | 0 | 0.0% |
| 30 to 34 Minutes | 0 | 0.0% |
| 35 to 39 Minutes | 9 | 26.5% |
| 40 to 44 Minutes | 0 | 0.0% |
| 45 to 59 Minutes | 15 | 44.1% |
| 60 to 89 Minutes | 0 | 0.0% |
| 90 or more Minutes | 10 | 29.4% |
Commute Time by Sex in Skamokawa Valley
The most common commute times in Skamokawa Valley are 90 or more minutes (10 commuters, 37.0%) for males and 45 to 59 minutes (7 commuters, 100.0%) for females.
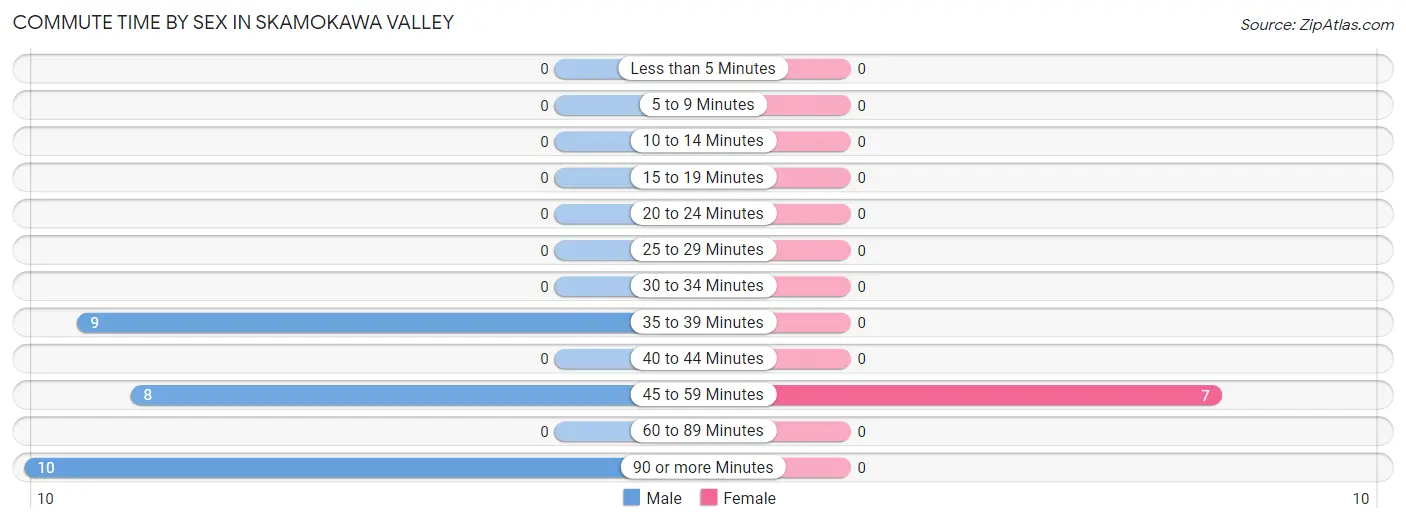
| Commute Time | Male | Female |
| Less than 5 Minutes | 0 (0.0%) | 0 (0.0%) |
| 5 to 9 Minutes | 0 (0.0%) | 0 (0.0%) |
| 10 to 14 Minutes | 0 (0.0%) | 0 (0.0%) |
| 15 to 19 Minutes | 0 (0.0%) | 0 (0.0%) |
| 20 to 24 Minutes | 0 (0.0%) | 0 (0.0%) |
| 25 to 29 Minutes | 0 (0.0%) | 0 (0.0%) |
| 30 to 34 Minutes | 0 (0.0%) | 0 (0.0%) |
| 35 to 39 Minutes | 9 (33.3%) | 0 (0.0%) |
| 40 to 44 Minutes | 0 (0.0%) | 0 (0.0%) |
| 45 to 59 Minutes | 8 (29.6%) | 7 (100.0%) |
| 60 to 89 Minutes | 0 (0.0%) | 0 (0.0%) |
| 90 or more Minutes | 10 (37.0%) | 0 (0.0%) |
Time of Departure to Work by Sex in Skamokawa Valley
The most frequent times of departure to work in Skamokawa Valley are 12:00 AM to 4:59 AM (10, 37.0%) for males and 10:00 AM to 10:59 AM (7, 100.0%) for females.
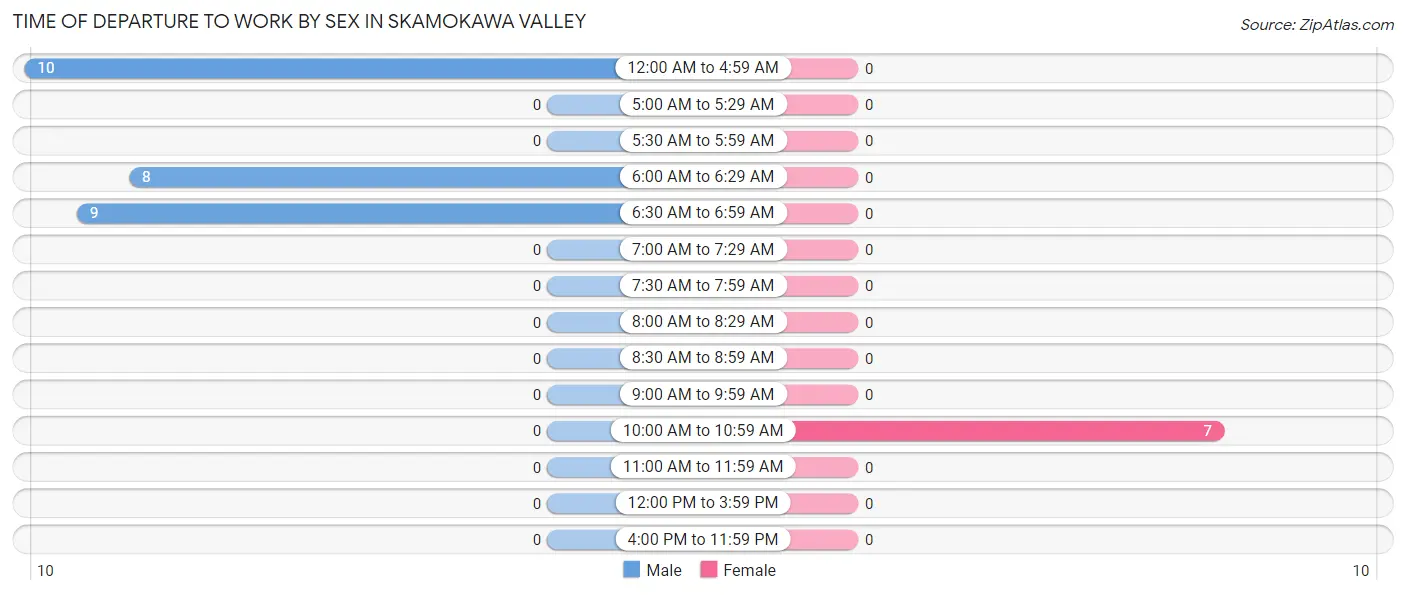
| Time of Departure | Male | Female |
| 12:00 AM to 4:59 AM | 10 (37.0%) | 0 (0.0%) |
| 5:00 AM to 5:29 AM | 0 (0.0%) | 0 (0.0%) |
| 5:30 AM to 5:59 AM | 0 (0.0%) | 0 (0.0%) |
| 6:00 AM to 6:29 AM | 8 (29.6%) | 0 (0.0%) |
| 6:30 AM to 6:59 AM | 9 (33.3%) | 0 (0.0%) |
| 7:00 AM to 7:29 AM | 0 (0.0%) | 0 (0.0%) |
| 7:30 AM to 7:59 AM | 0 (0.0%) | 0 (0.0%) |
| 8:00 AM to 8:29 AM | 0 (0.0%) | 0 (0.0%) |
| 8:30 AM to 8:59 AM | 0 (0.0%) | 0 (0.0%) |
| 9:00 AM to 9:59 AM | 0 (0.0%) | 0 (0.0%) |
| 10:00 AM to 10:59 AM | 0 (0.0%) | 7 (100.0%) |
| 11:00 AM to 11:59 AM | 0 (0.0%) | 0 (0.0%) |
| 12:00 PM to 3:59 PM | 0 (0.0%) | 0 (0.0%) |
| 4:00 PM to 11:59 PM | 0 (0.0%) | 0 (0.0%) |
| Total | 27 (100.0%) | 7 (100.0%) |
Housing Occupancy in Skamokawa Valley
Occupancy by Ownership in Skamokawa Valley
Of the total 134 dwellings in Skamokawa Valley, owner-occupied units account for 121 (90.3%), while renter-occupied units make up 13 (9.7%).
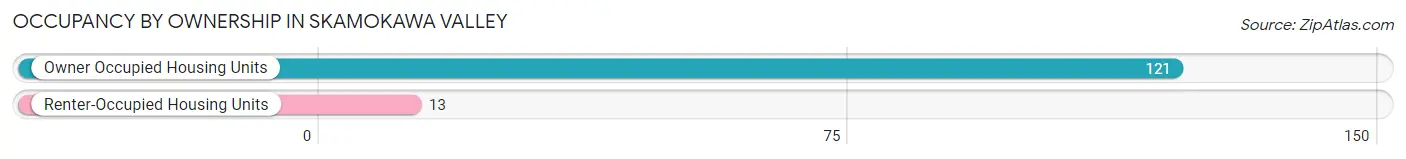
| Occupancy | # Housing Units | % Housing Units |
| Owner Occupied Housing Units | 121 | 90.3% |
| Renter-Occupied Housing Units | 13 | 9.7% |
| Total Occupied Housing Units | 134 | 100.0% |
Occupancy by Household Size in Skamokawa Valley
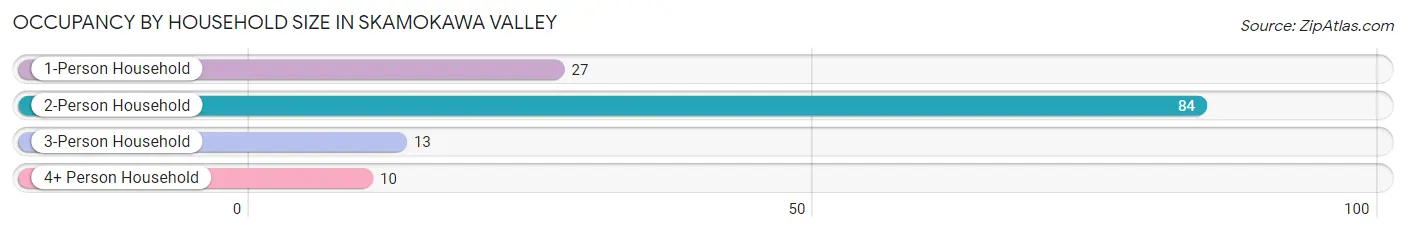
| Household Size | # Housing Units | % Housing Units |
| 1-Person Household | 27 | 20.2% |
| 2-Person Household | 84 | 62.7% |
| 3-Person Household | 13 | 9.7% |
| 4+ Person Household | 10 | 7.5% |
| Total Housing Units | 134 | 100.0% |
Occupancy by Ownership by Household Size in Skamokawa Valley
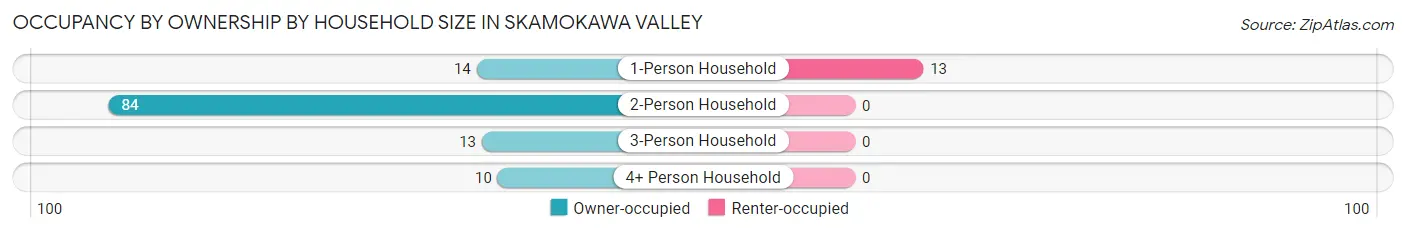
| Household Size | Owner-occupied | Renter-occupied |
| 1-Person Household | 14 (51.8%) | 13 (48.1%) |
| 2-Person Household | 84 (100.0%) | 0 (0.0%) |
| 3-Person Household | 13 (100.0%) | 0 (0.0%) |
| 4+ Person Household | 10 (100.0%) | 0 (0.0%) |
| Total Housing Units | 121 (90.3%) | 13 (9.7%) |
Occupancy by Educational Attainment in Skamokawa Valley
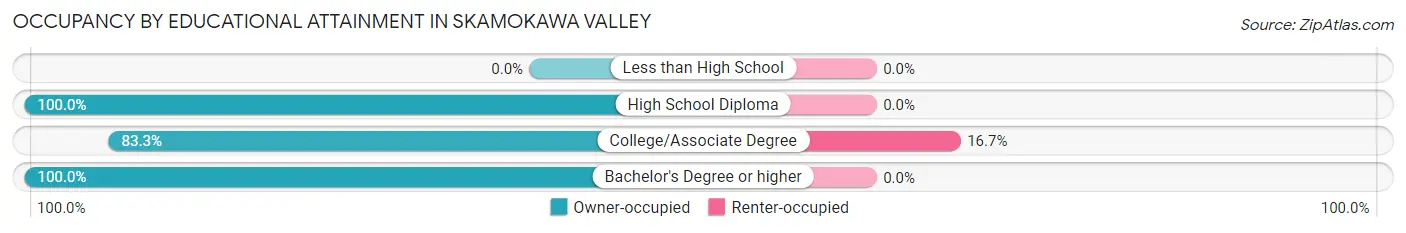
| Household Size | Owner-occupied | Renter-occupied |
| Less than High School | 0 (0.0%) | 0 (0.0%) |
| High School Diploma | 13 (100.0%) | 0 (0.0%) |
| College/Associate Degree | 65 (83.3%) | 13 (16.7%) |
| Bachelor's Degree or higher | 43 (100.0%) | 0 (0.0%) |
Occupancy by Age of Householder in Skamokawa Valley
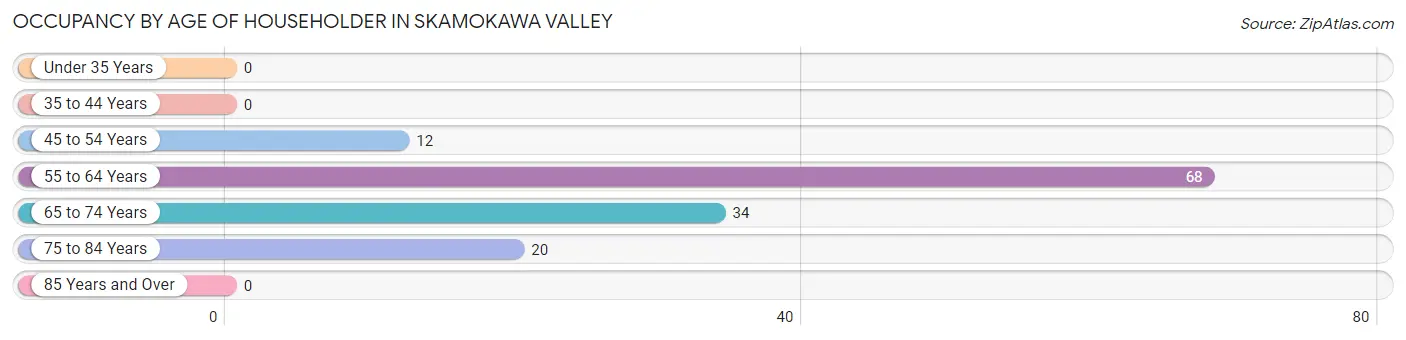
| Age Bracket | # Households | % Households |
| Under 35 Years | 0 | 0.0% |
| 35 to 44 Years | 0 | 0.0% |
| 45 to 54 Years | 12 | 9.0% |
| 55 to 64 Years | 68 | 50.7% |
| 65 to 74 Years | 34 | 25.4% |
| 75 to 84 Years | 20 | 14.9% |
| 85 Years and Over | 0 | 0.0% |
| Total | 134 | 100.0% |
Housing Finances in Skamokawa Valley
Median Income by Occupancy in Skamokawa Valley
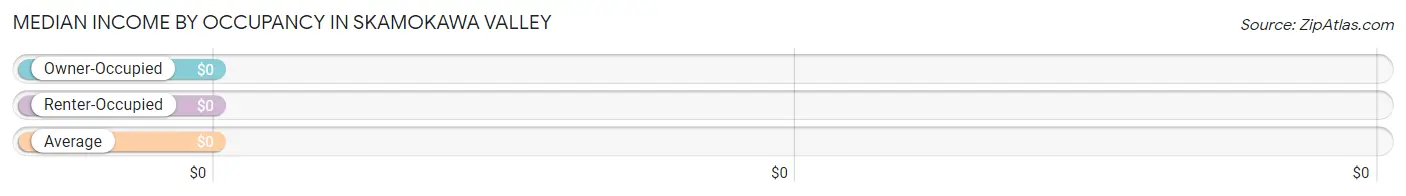
| Occupancy Type | # Households | Median Income |
| Owner-Occupied | 121 (90.3%) | $0 |
| Renter-Occupied | 13 (9.7%) | $0 |
| Average | 134 (100.0%) | $0 |
Occupancy by Householder Income Bracket in Skamokawa Valley
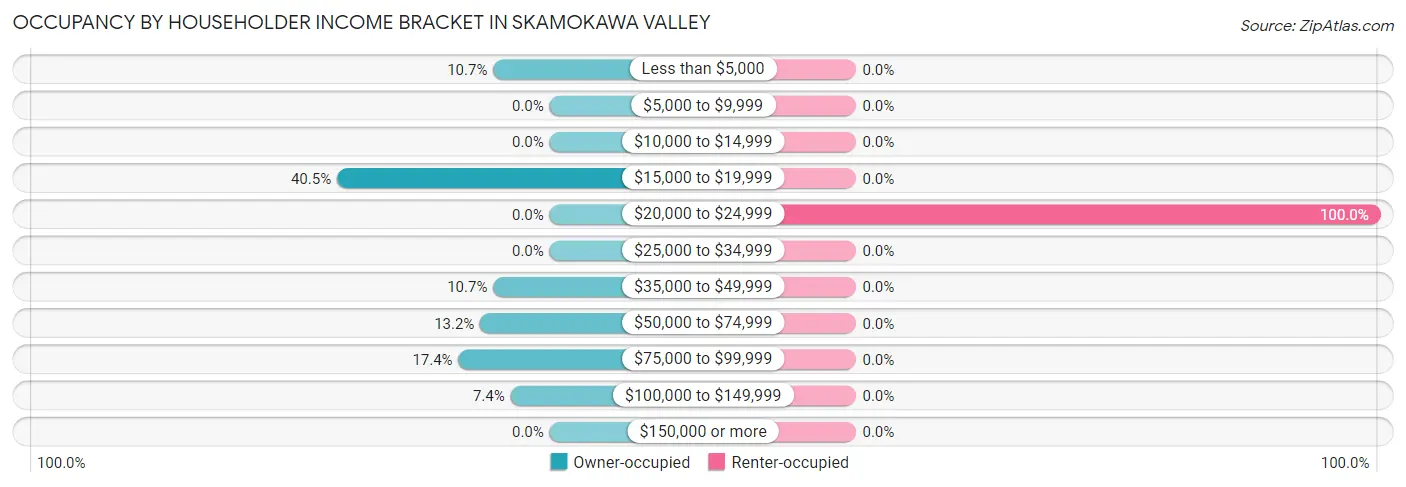
| Income Bracket | Owner-occupied | Renter-occupied |
| Less than $5,000 | 13 (10.7%) | 0 (0.0%) |
| $5,000 to $9,999 | 0 (0.0%) | 0 (0.0%) |
| $10,000 to $14,999 | 0 (0.0%) | 0 (0.0%) |
| $15,000 to $19,999 | 49 (40.5%) | 0 (0.0%) |
| $20,000 to $24,999 | 0 (0.0%) | 13 (100.0%) |
| $25,000 to $34,999 | 0 (0.0%) | 0 (0.0%) |
| $35,000 to $49,999 | 13 (10.7%) | 0 (0.0%) |
| $50,000 to $74,999 | 16 (13.2%) | 0 (0.0%) |
| $75,000 to $99,999 | 21 (17.4%) | 0 (0.0%) |
| $100,000 to $149,999 | 9 (7.4%) | 0 (0.0%) |
| $150,000 or more | 0 (0.0%) | 0 (0.0%) |
| Total | 121 (100.0%) | 13 (100.0%) |
Monthly Housing Cost Tiers in Skamokawa Valley
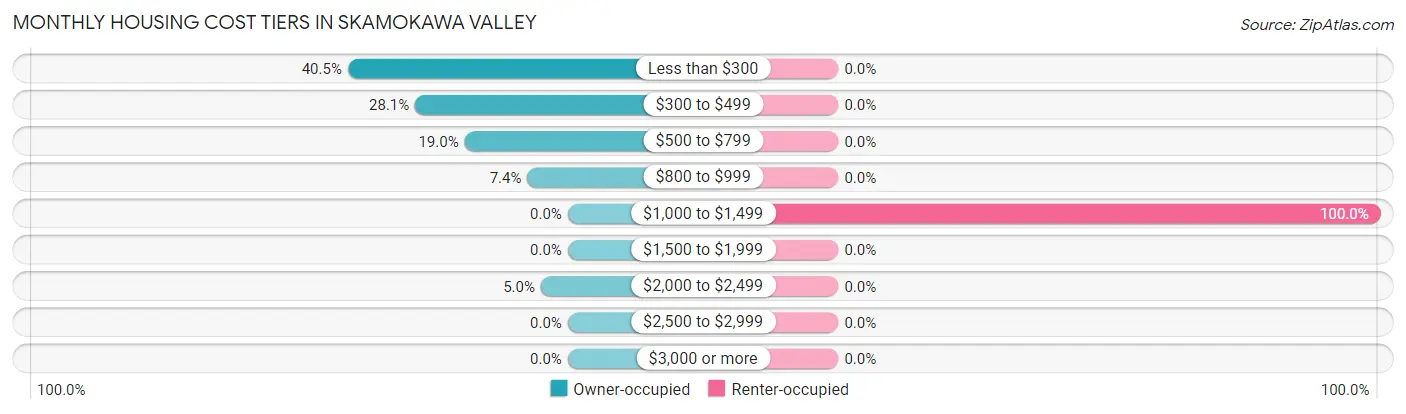
| Monthly Cost | Owner-occupied | Renter-occupied |
| Less than $300 | 49 (40.5%) | 0 (0.0%) |
| $300 to $499 | 34 (28.1%) | 0 (0.0%) |
| $500 to $799 | 23 (19.0%) | 0 (0.0%) |
| $800 to $999 | 9 (7.4%) | 0 (0.0%) |
| $1,000 to $1,499 | 0 (0.0%) | 13 (100.0%) |
| $1,500 to $1,999 | 0 (0.0%) | 0 (0.0%) |
| $2,000 to $2,499 | 6 (5.0%) | 0 (0.0%) |
| $2,500 to $2,999 | 0 (0.0%) | 0 (0.0%) |
| $3,000 or more | 0 (0.0%) | 0 (0.0%) |
| Total | 121 (100.0%) | 13 (100.0%) |
Physical Housing Characteristics in Skamokawa Valley
Housing Structures in Skamokawa Valley
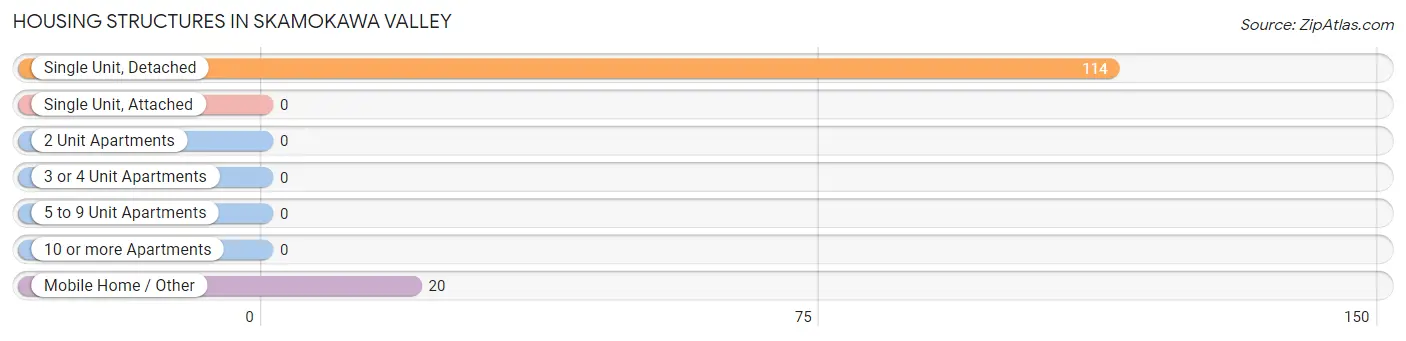
| Structure Type | # Housing Units | % Housing Units |
| Single Unit, Detached | 114 | 85.1% |
| Single Unit, Attached | 0 | 0.0% |
| 2 Unit Apartments | 0 | 0.0% |
| 3 or 4 Unit Apartments | 0 | 0.0% |
| 5 to 9 Unit Apartments | 0 | 0.0% |
| 10 or more Apartments | 0 | 0.0% |
| Mobile Home / Other | 20 | 14.9% |
| Total | 134 | 100.0% |
Housing Structures by Occupancy in Skamokawa Valley
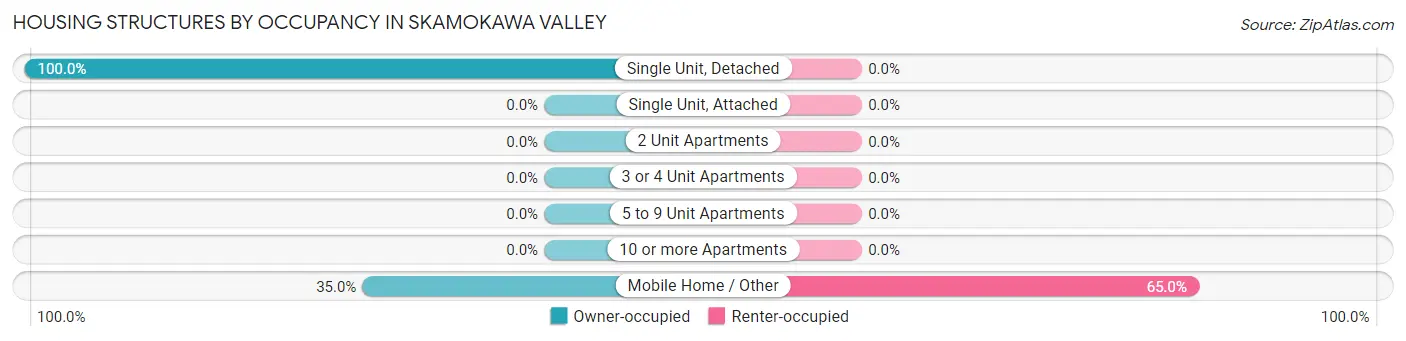
| Structure Type | Owner-occupied | Renter-occupied |
| Single Unit, Detached | 114 (100.0%) | 0 (0.0%) |
| Single Unit, Attached | 0 (0.0%) | 0 (0.0%) |
| 2 Unit Apartments | 0 (0.0%) | 0 (0.0%) |
| 3 or 4 Unit Apartments | 0 (0.0%) | 0 (0.0%) |
| 5 to 9 Unit Apartments | 0 (0.0%) | 0 (0.0%) |
| 10 or more Apartments | 0 (0.0%) | 0 (0.0%) |
| Mobile Home / Other | 7 (35.0%) | 13 (65.0%) |
| Total | 121 (90.3%) | 13 (9.7%) |
Housing Structures by Number of Rooms in Skamokawa Valley
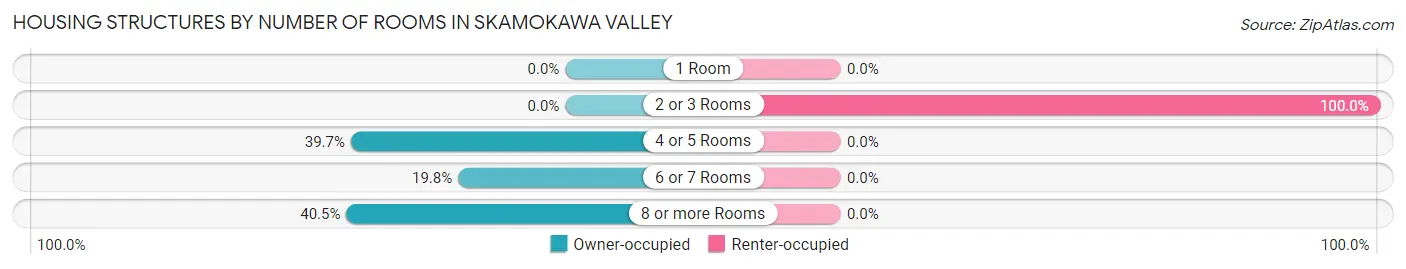
| Number of Rooms | Owner-occupied | Renter-occupied |
| 1 Room | 0 (0.0%) | 0 (0.0%) |
| 2 or 3 Rooms | 0 (0.0%) | 13 (100.0%) |
| 4 or 5 Rooms | 48 (39.7%) | 0 (0.0%) |
| 6 or 7 Rooms | 24 (19.8%) | 0 (0.0%) |
| 8 or more Rooms | 49 (40.5%) | 0 (0.0%) |
| Total | 121 (100.0%) | 13 (100.0%) |
Housing Structure by Heating Type in Skamokawa Valley
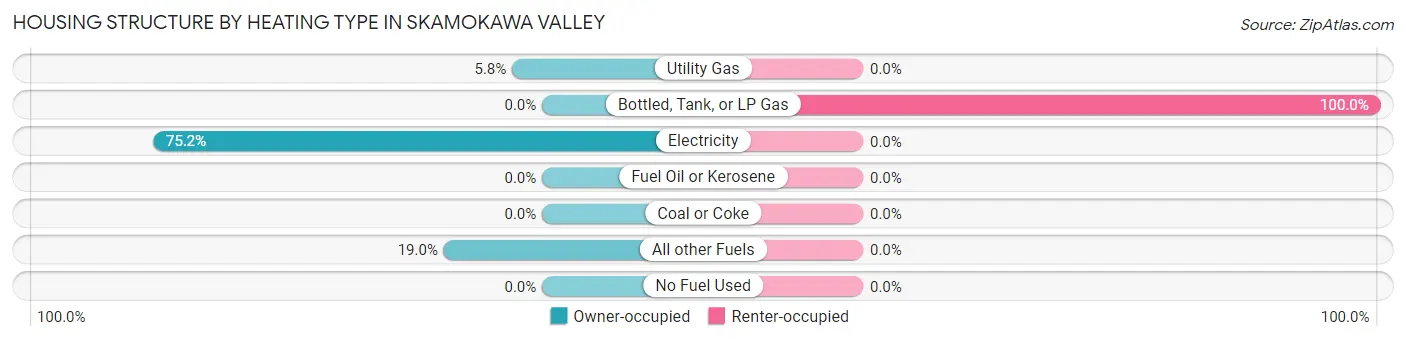
| Heating Type | Owner-occupied | Renter-occupied |
| Utility Gas | 7 (5.8%) | 0 (0.0%) |
| Bottled, Tank, or LP Gas | 0 (0.0%) | 13 (100.0%) |
| Electricity | 91 (75.2%) | 0 (0.0%) |
| Fuel Oil or Kerosene | 0 (0.0%) | 0 (0.0%) |
| Coal or Coke | 0 (0.0%) | 0 (0.0%) |
| All other Fuels | 23 (19.0%) | 0 (0.0%) |
| No Fuel Used | 0 (0.0%) | 0 (0.0%) |
| Total | 121 (100.0%) | 13 (100.0%) |
Household Vehicle Usage in Skamokawa Valley
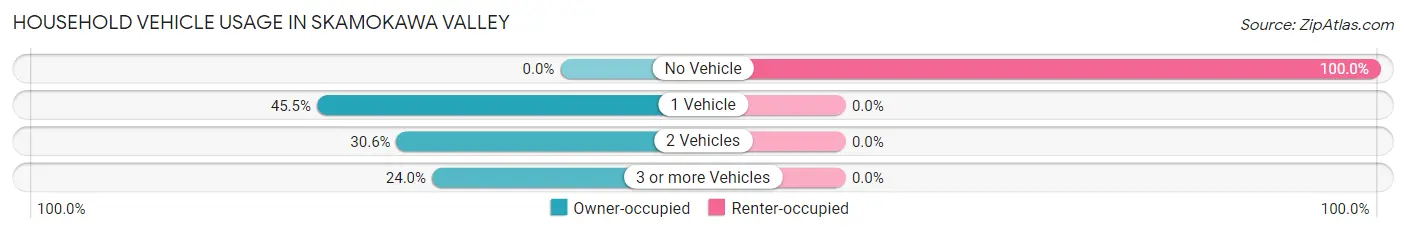
| Vehicles per Household | Owner-occupied | Renter-occupied |
| No Vehicle | 0 (0.0%) | 13 (100.0%) |
| 1 Vehicle | 55 (45.5%) | 0 (0.0%) |
| 2 Vehicles | 37 (30.6%) | 0 (0.0%) |
| 3 or more Vehicles | 29 (24.0%) | 0 (0.0%) |
| Total | 121 (100.0%) | 13 (100.0%) |
Real Estate & Mortgages in Skamokawa Valley
Real Estate and Mortgage Overview in Skamokawa Valley
| Characteristic | Without Mortgage | With Mortgage |
| Housing Units | 109 | 12 |
| Median Property Value | - | - |
| Median Household Income | - | - |
| Monthly Housing Costs | $416 | $0 |
| Real Estate Taxes | - | - |
Property Value by Mortgage Status in Skamokawa Valley
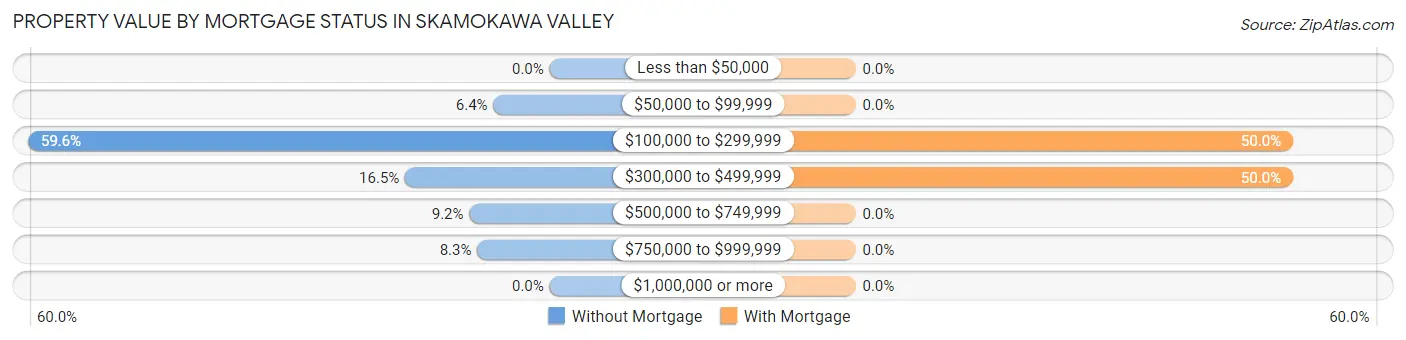
| Property Value | Without Mortgage | With Mortgage |
| Less than $50,000 | 0 (0.0%) | 0 (0.0%) |
| $50,000 to $99,999 | 7 (6.4%) | 0 (0.0%) |
| $100,000 to $299,999 | 65 (59.6%) | 6 (50.0%) |
| $300,000 to $499,999 | 18 (16.5%) | 6 (50.0%) |
| $500,000 to $749,999 | 10 (9.2%) | 0 (0.0%) |
| $750,000 to $999,999 | 9 (8.3%) | 0 (0.0%) |
| $1,000,000 or more | 0 (0.0%) | 0 (0.0%) |
| Total | 109 (100.0%) | 12 (100.0%) |
Household Income by Mortgage Status in Skamokawa Valley
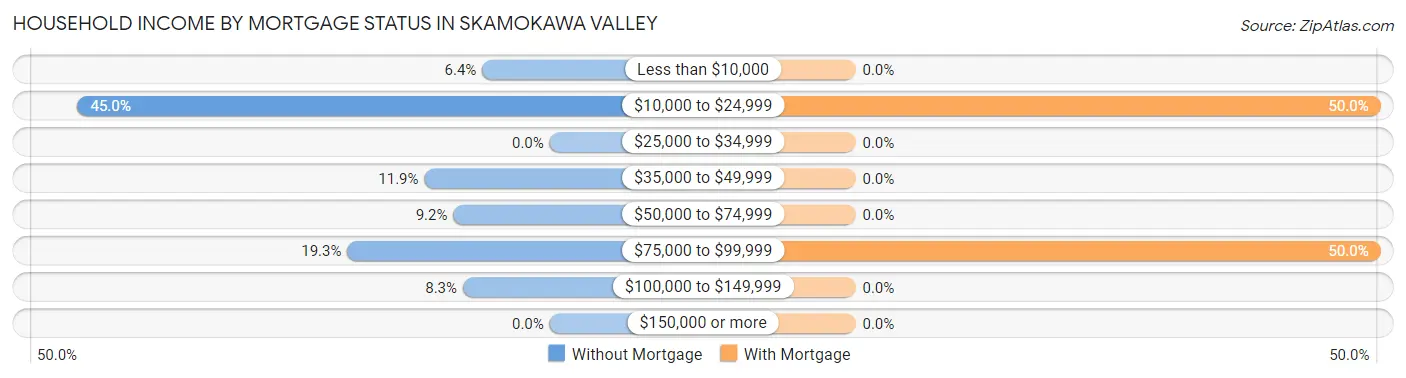
| Household Income | Without Mortgage | With Mortgage |
| Less than $10,000 | 7 (6.4%) | 0 (0.0%) |
| $10,000 to $24,999 | 49 (45.0%) | 6 (50.0%) |
| $25,000 to $34,999 | 0 (0.0%) | 0 (0.0%) |
| $35,000 to $49,999 | 13 (11.9%) | 0 (0.0%) |
| $50,000 to $74,999 | 10 (9.2%) | 0 (0.0%) |
| $75,000 to $99,999 | 21 (19.3%) | 6 (50.0%) |
| $100,000 to $149,999 | 9 (8.3%) | 0 (0.0%) |
| $150,000 or more | 0 (0.0%) | 0 (0.0%) |
| Total | 109 (100.0%) | 12 (100.0%) |
Property Value to Household Income Ratio in Skamokawa Valley
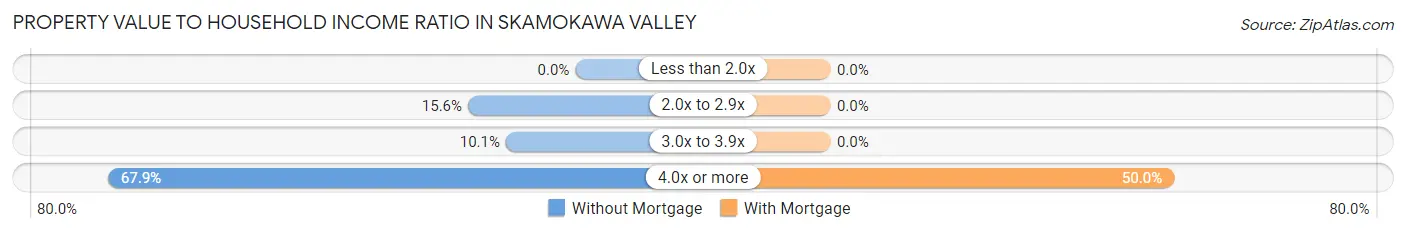
| Value-to-Income Ratio | Without Mortgage | With Mortgage |
| Less than 2.0x | 0 (0.0%) | 0 (0.0%) |
| 2.0x to 2.9x | 17 (15.6%) | 0 (0.0%) |
| 3.0x to 3.9x | 11 (10.1%) | 0 (0.0%) |
| 4.0x or more | 74 (67.9%) | 6 (50.0%) |
| Total | 109 (100.0%) | 12 (100.0%) |
Real Estate Taxes by Mortgage Status in Skamokawa Valley
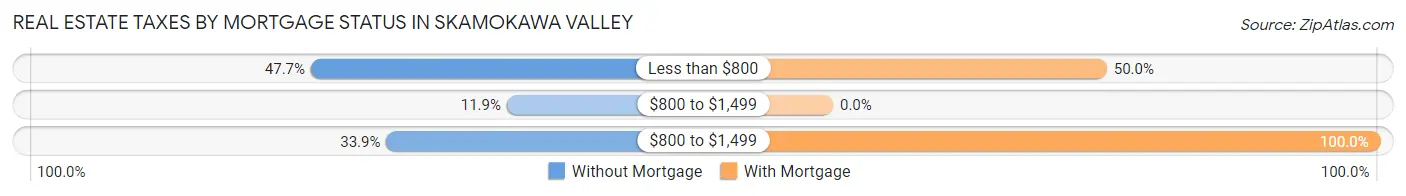
| Property Taxes | Without Mortgage | With Mortgage |
| Less than $800 | 52 (47.7%) | 6 (50.0%) |
| $800 to $1,499 | 13 (11.9%) | 0 (0.0%) |
| $800 to $1,499 | 37 (33.9%) | 12 (100.0%) |
| Total | 109 (100.0%) | 12 (100.0%) |
Health & Disability in Skamokawa Valley
Health Insurance Coverage by Age in Skamokawa Valley
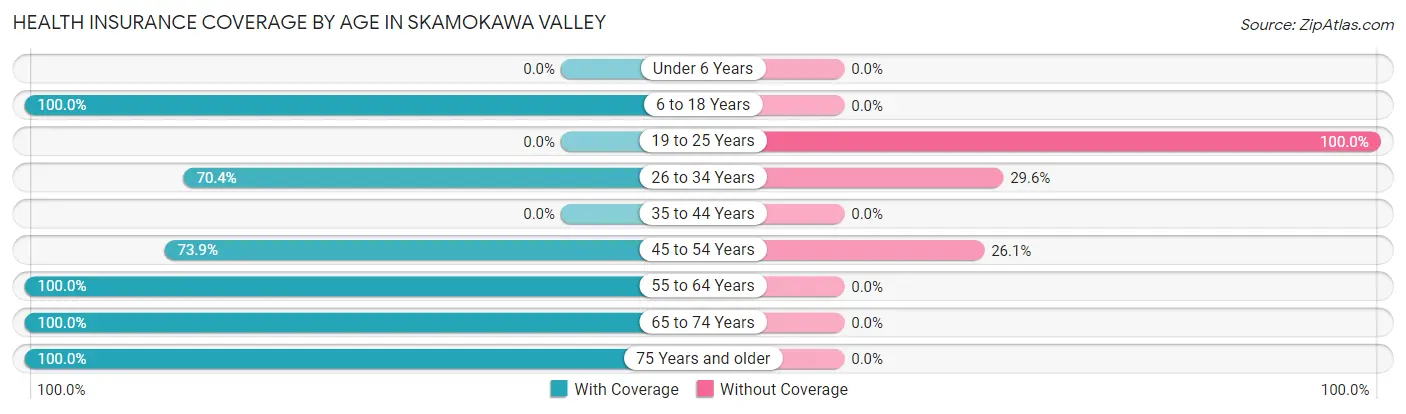
| Age Bracket | With Coverage | Without Coverage |
| Under 6 Years | 0 (0.0%) | 0 (0.0%) |
| 6 to 18 Years | 32 (100.0%) | 0 (0.0%) |
| 19 to 25 Years | 0 (0.0%) | 8 (100.0%) |
| 26 to 34 Years | 19 (70.4%) | 8 (29.6%) |
| 35 to 44 Years | 0 (0.0%) | 0 (0.0%) |
| 45 to 54 Years | 17 (73.9%) | 6 (26.1%) |
| 55 to 64 Years | 130 (100.0%) | 0 (0.0%) |
| 65 to 74 Years | 48 (100.0%) | 0 (0.0%) |
| 75 Years and older | 20 (100.0%) | 0 (0.0%) |
| Total | 266 (92.4%) | 22 (7.6%) |
Health Insurance Coverage by Citizenship Status in Skamokawa Valley
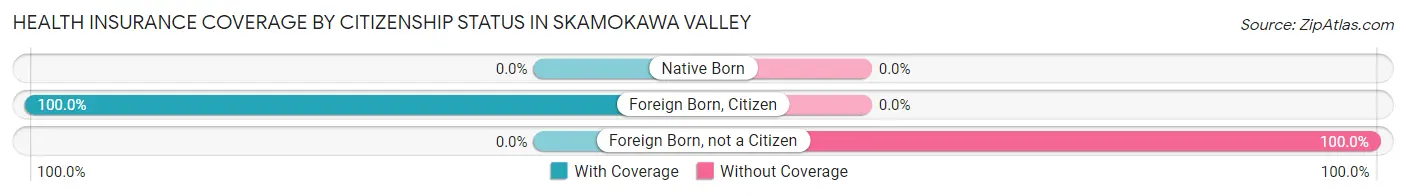
| Citizenship Status | With Coverage | Without Coverage |
| Native Born | 0 (0.0%) | 0 (0.0%) |
| Foreign Born, Citizen | 32 (100.0%) | 0 (0.0%) |
| Foreign Born, not a Citizen | 0 (0.0%) | 8 (100.0%) |
Health Insurance Coverage by Household Income in Skamokawa Valley
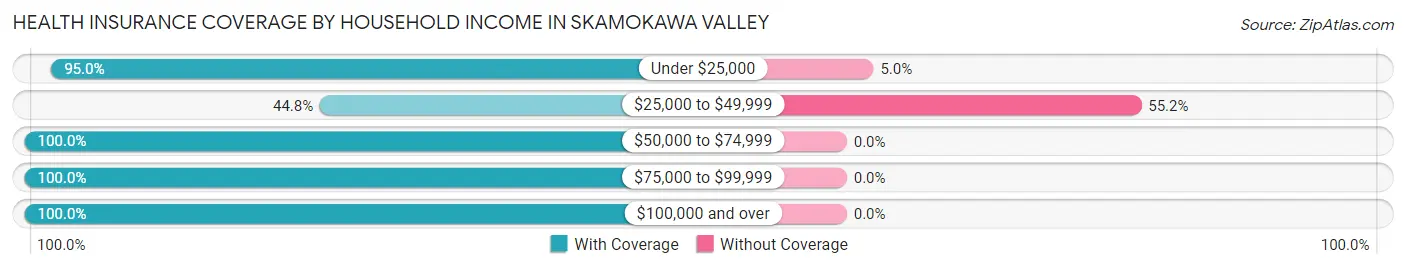
| Household Income | With Coverage | Without Coverage |
| Under $25,000 | 114 (95.0%) | 6 (5.0%) |
| $25,000 to $49,999 | 13 (44.8%) | 16 (55.2%) |
| $50,000 to $74,999 | 78 (100.0%) | 0 (0.0%) |
| $75,000 to $99,999 | 45 (100.0%) | 0 (0.0%) |
| $100,000 and over | 16 (100.0%) | 0 (0.0%) |
Public vs Private Health Insurance Coverage by Age in Skamokawa Valley
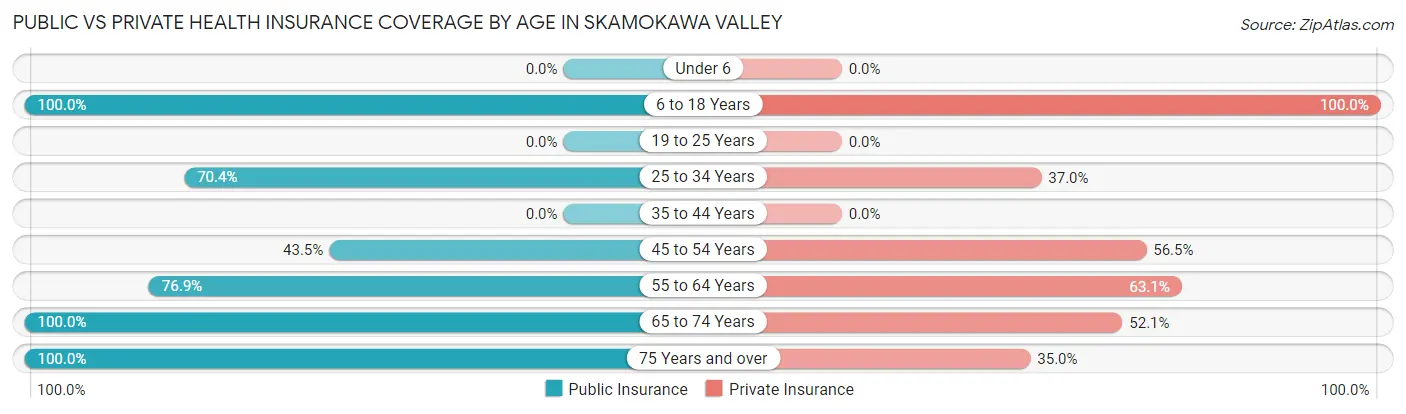
| Age Bracket | Public Insurance | Private Insurance |
| Under 6 | 0 (0.0%) | 0 (0.0%) |
| 6 to 18 Years | 32 (100.0%) | 32 (100.0%) |
| 19 to 25 Years | 0 (0.0%) | 0 (0.0%) |
| 25 to 34 Years | 19 (70.4%) | 10 (37.0%) |
| 35 to 44 Years | 0 (0.0%) | 0 (0.0%) |
| 45 to 54 Years | 10 (43.5%) | 13 (56.5%) |
| 55 to 64 Years | 100 (76.9%) | 82 (63.1%) |
| 65 to 74 Years | 48 (100.0%) | 25 (52.1%) |
| 75 Years and over | 20 (100.0%) | 7 (35.0%) |
| Total | 229 (79.5%) | 169 (58.7%) |
Disability Status by Sex by Age in Skamokawa Valley
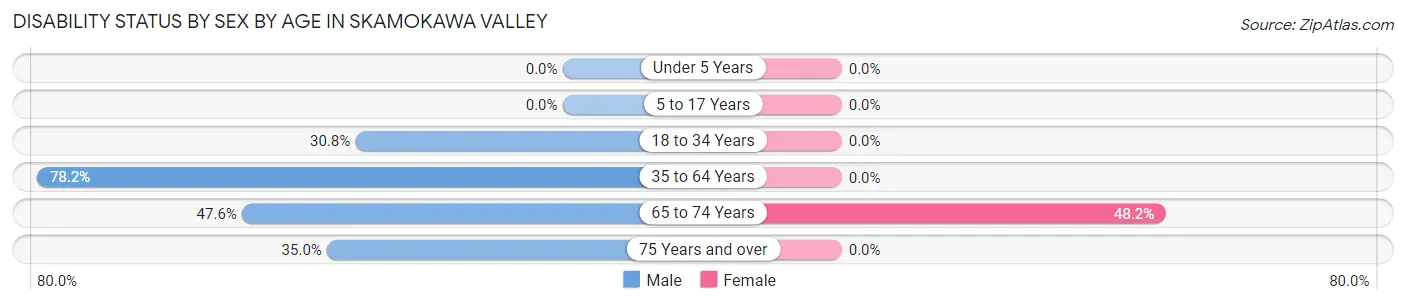
| Age Bracket | Male | Female |
| Under 5 Years | 0 (0.0%) | 0 (0.0%) |
| 5 to 17 Years | 0 (0.0%) | 0 (0.0%) |
| 18 to 34 Years | 8 (30.8%) | 0 (0.0%) |
| 35 to 64 Years | 68 (78.2%) | 0 (0.0%) |
| 65 to 74 Years | 10 (47.6%) | 13 (48.1%) |
| 75 Years and over | 7 (35.0%) | 0 (0.0%) |
Disability Class by Sex by Age in Skamokawa Valley
Disability Class: Hearing Difficulty
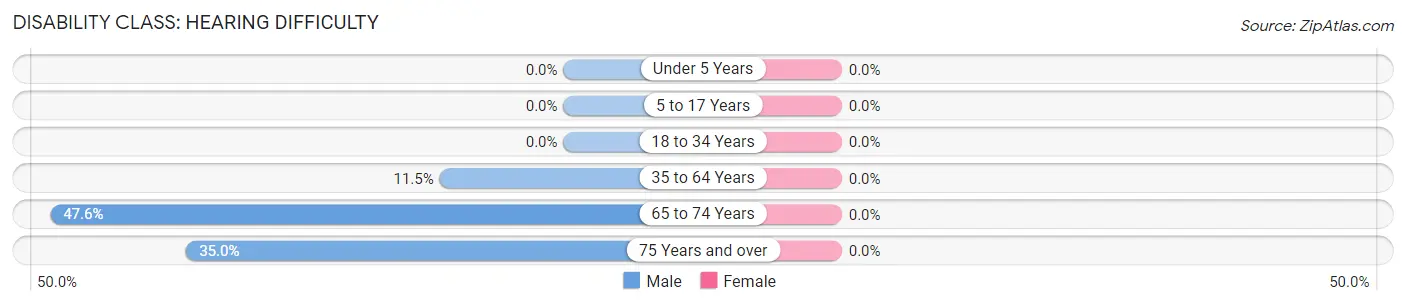
| Age Bracket | Male | Female |
| Under 5 Years | 0 (0.0%) | 0 (0.0%) |
| 5 to 17 Years | 0 (0.0%) | 0 (0.0%) |
| 18 to 34 Years | 0 (0.0%) | 0 (0.0%) |
| 35 to 64 Years | 10 (11.5%) | 0 (0.0%) |
| 65 to 74 Years | 10 (47.6%) | 0 (0.0%) |
| 75 Years and over | 7 (35.0%) | 0 (0.0%) |
Disability Class: Vision Difficulty
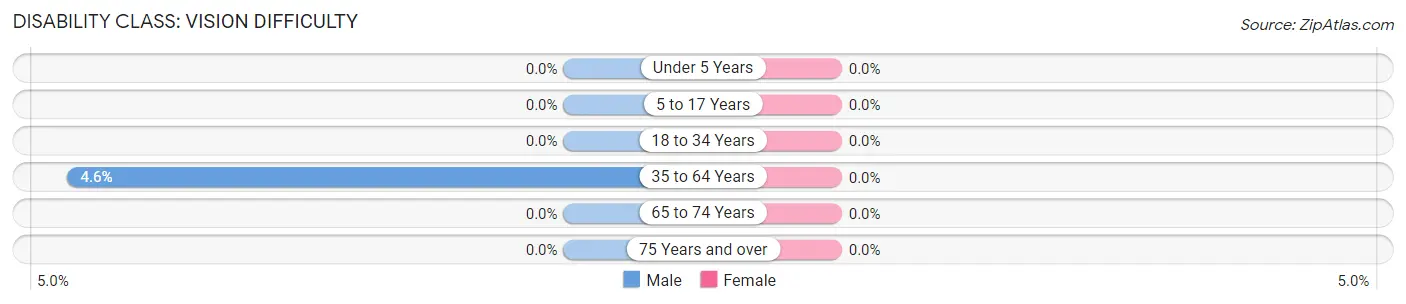
| Age Bracket | Male | Female |
| Under 5 Years | 0 (0.0%) | 0 (0.0%) |
| 5 to 17 Years | 0 (0.0%) | 0 (0.0%) |
| 18 to 34 Years | 0 (0.0%) | 0 (0.0%) |
| 35 to 64 Years | 4 (4.6%) | 0 (0.0%) |
| 65 to 74 Years | 0 (0.0%) | 0 (0.0%) |
| 75 Years and over | 0 (0.0%) | 0 (0.0%) |
Disability Class: Cognitive Difficulty
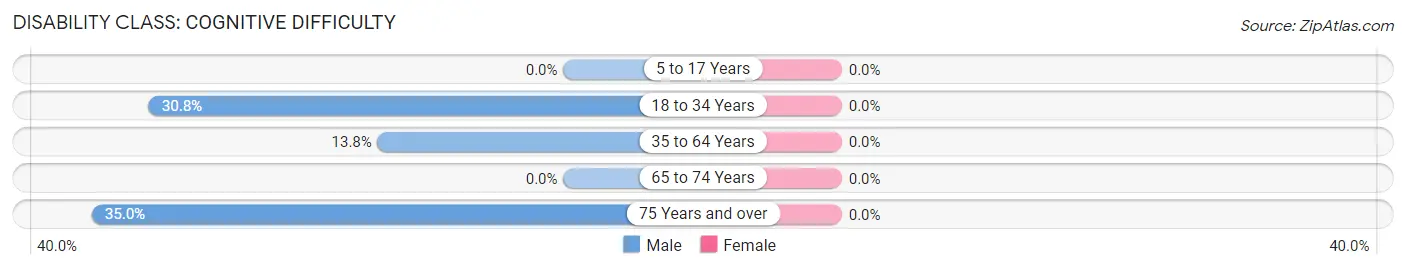
| Age Bracket | Male | Female |
| 5 to 17 Years | 0 (0.0%) | 0 (0.0%) |
| 18 to 34 Years | 8 (30.8%) | 0 (0.0%) |
| 35 to 64 Years | 12 (13.8%) | 0 (0.0%) |
| 65 to 74 Years | 0 (0.0%) | 0 (0.0%) |
| 75 Years and over | 7 (35.0%) | 0 (0.0%) |
Disability Class: Ambulatory Difficulty
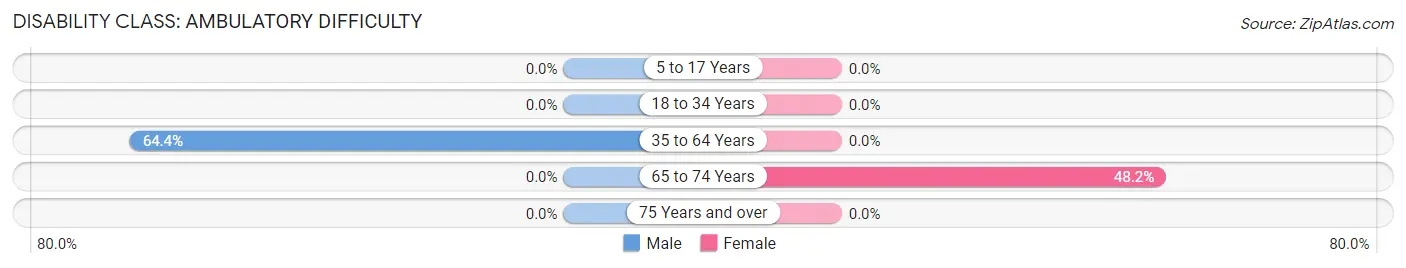
| Age Bracket | Male | Female |
| 5 to 17 Years | 0 (0.0%) | 0 (0.0%) |
| 18 to 34 Years | 0 (0.0%) | 0 (0.0%) |
| 35 to 64 Years | 56 (64.4%) | 0 (0.0%) |
| 65 to 74 Years | 0 (0.0%) | 13 (48.1%) |
| 75 Years and over | 0 (0.0%) | 0 (0.0%) |
Disability Class: Self-Care Difficulty
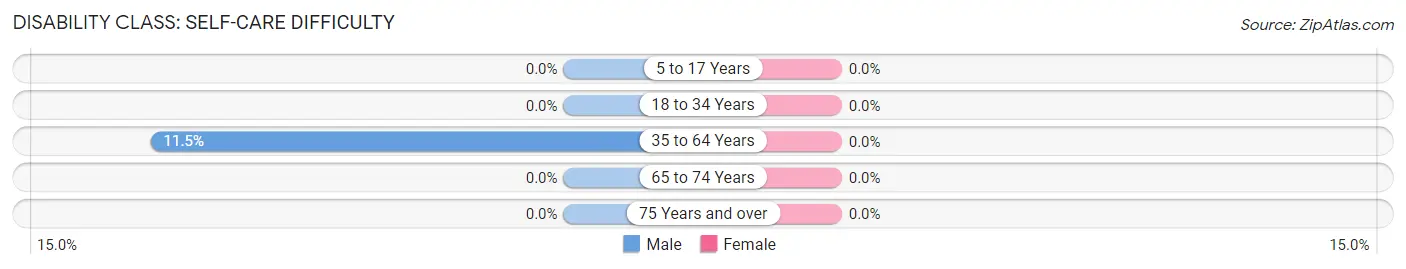
| Age Bracket | Male | Female |
| 5 to 17 Years | 0 (0.0%) | 0 (0.0%) |
| 18 to 34 Years | 0 (0.0%) | 0 (0.0%) |
| 35 to 64 Years | 10 (11.5%) | 0 (0.0%) |
| 65 to 74 Years | 0 (0.0%) | 0 (0.0%) |
| 75 Years and over | 0 (0.0%) | 0 (0.0%) |
Technology Access in Skamokawa Valley
Computing Device Access in Skamokawa Valley
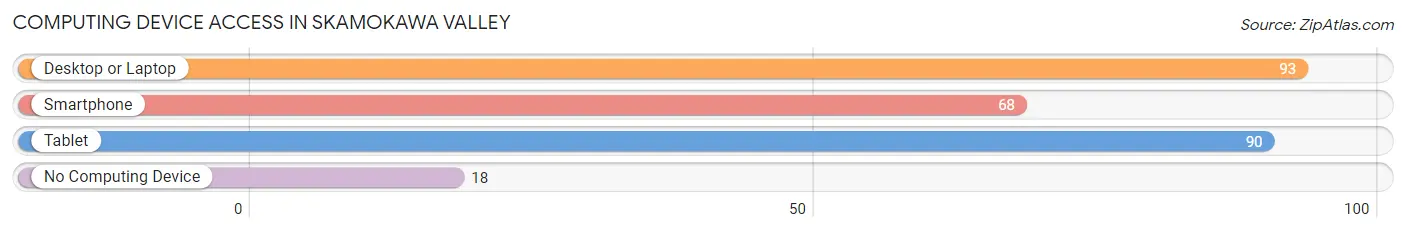
| Device Type | # Households | % Households |
| Desktop or Laptop | 93 | 69.4% |
| Smartphone | 68 | 50.7% |
| Tablet | 90 | 67.2% |
| No Computing Device | 18 | 13.4% |
| Total | 134 | 100.0% |
Internet Access in Skamokawa Valley
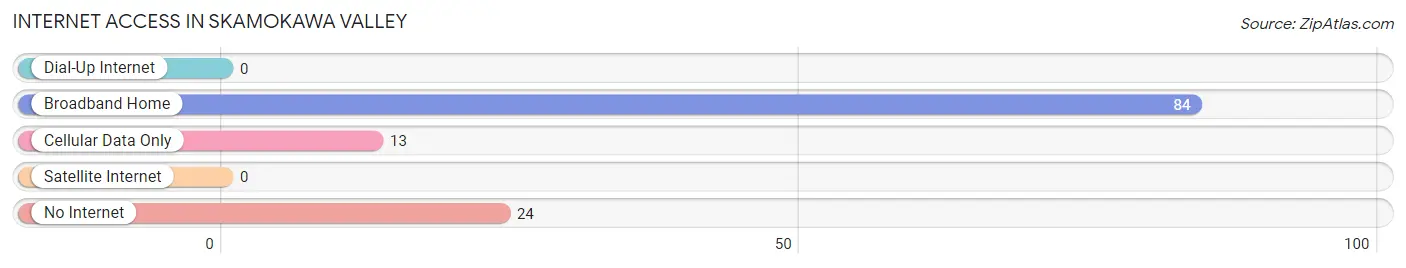
| Internet Type | # Households | % Households |
| Dial-Up Internet | 0 | 0.0% |
| Broadband Home | 84 | 62.7% |
| Cellular Data Only | 13 | 9.7% |
| Satellite Internet | 0 | 0.0% |
| No Internet | 24 | 17.9% |
| Total | 134 | 100.0% |
Skamokawa Valley Summary
Skamokawa Valley is a small rural community located in the Pacific Northwest region of Washington State. It is situated in the lower Columbia River Gorge, approximately 30 miles east of Astoria, Oregon and 30 miles west of Longview, Washington. The valley is home to a population of approximately 500 people, and is surrounded by lush forests, rolling hills, and the Columbia River.
History
The Skamokawa Valley has a long and rich history, dating back to the early 1800s when the area was inhabited by the Chinook and Clatsop Native American tribes. The first European settlers arrived in the area in the 1840s, and the area was officially established as a town in 1851. The town was named after the Chinook word for “place of the wild geese”, and was initially a trading post for the local Native American tribes.
In the late 1800s, the area experienced a period of rapid growth as the timber industry began to take off. The town was home to several sawmills, and the population grew to over 1,000 people. The town also became a popular destination for tourists, who came to enjoy the area’s natural beauty and outdoor activities.
In the early 1900s, the timber industry began to decline, and the population of the town began to decrease. The town was eventually incorporated in 1951, and the population has remained relatively stable since then.
Geography
The Skamokawa Valley is located in the lower Columbia River Gorge, approximately 30 miles east of Astoria, Oregon and 30 miles west of Longview, Washington. The valley is surrounded by lush forests, rolling hills, and the Columbia River. The area is known for its mild climate, with temperatures rarely dropping below freezing in the winter and rarely exceeding 90 degrees in the summer.
The valley is home to several parks and recreational areas, including the Skamokawa Vista Park, which offers stunning views of the Columbia River and the surrounding area. The park also features a variety of outdoor activities, including hiking, biking, fishing, and camping.
Economy
The economy of the Skamokawa Valley is largely based on tourism and agriculture. The area is home to several wineries, and the local farms produce a variety of fruits and vegetables. The area is also home to several small businesses, including restaurants, shops, and galleries.
The area is also home to several logging and timber companies, which provide employment for many of the local residents. The timber industry has been in decline in recent years, however, due to environmental regulations and the increasing cost of timber.
Demographics
As of the 2010 census, the population of the Skamokawa Valley was 498 people. The population is largely white (93.2%), with small percentages of Native American (2.2%), Asian (1.2%), and African American (0.4%) residents. The median household income is $41,250, and the median age is 44.
Conclusion
The Skamokawa Valley is a small rural community located in the Pacific Northwest region of Washington State. It is situated in the lower Columbia River Gorge, and is home to a population of approximately 500 people. The area has a long and rich history, and is known for its mild climate and stunning natural beauty. The economy of the area is largely based on tourism and agriculture, and the area is home to several small businesses, wineries, and logging and timber companies. The population is largely white, with small percentages of Native American, Asian, and African American residents.
Common Questions
What is Per Capita Income in Skamokawa Valley?
Per Capita income in Skamokawa Valley is $20,798.
What is Inequality or Gini Index in Skamokawa Valley?
Inequality or Gini Index in Skamokawa Valley is 0.46.
What is the Total Population of Skamokawa Valley?
Total Population of Skamokawa Valley is 288.
What is the Total Male Population of Skamokawa Valley?
Total Male Population of Skamokawa Valley is 167.
What is the Total Female Population of Skamokawa Valley?
Total Female Population of Skamokawa Valley is 121.
What is the Ratio of Males per 100 Females in Skamokawa Valley?
There are 138.02 Males per 100 Females in Skamokawa Valley.
What is the Ratio of Females per 100 Males in Skamokawa Valley?
There are 72.46 Females per 100 Males in Skamokawa Valley.
What is the Median Population Age in Skamokawa Valley?
Median Population Age in Skamokawa Valley is 61.8 Years.
What is the Average Family Size in Skamokawa Valley
Average Family Size in Skamokawa Valley is 2.5 People.
What is the Average Household Size in Skamokawa Valley
Average Household Size in Skamokawa Valley is 2.1 People.
How Large is the Labor Force in Skamokawa Valley?
There are 34 People in the Labor Forcein in Skamokawa Valley.
What is the Percentage of People in the Labor Force in Skamokawa Valley?
13.3% of People are in the Labor Force in Skamokawa Valley.