Zip Codes with the Highest Percentage of Population with a Degree in Liberal Arts and History in Richland, WA
RELATED REPORTS & OPTIONS
Liberal Arts and History
Richland
Compare Zip Codes
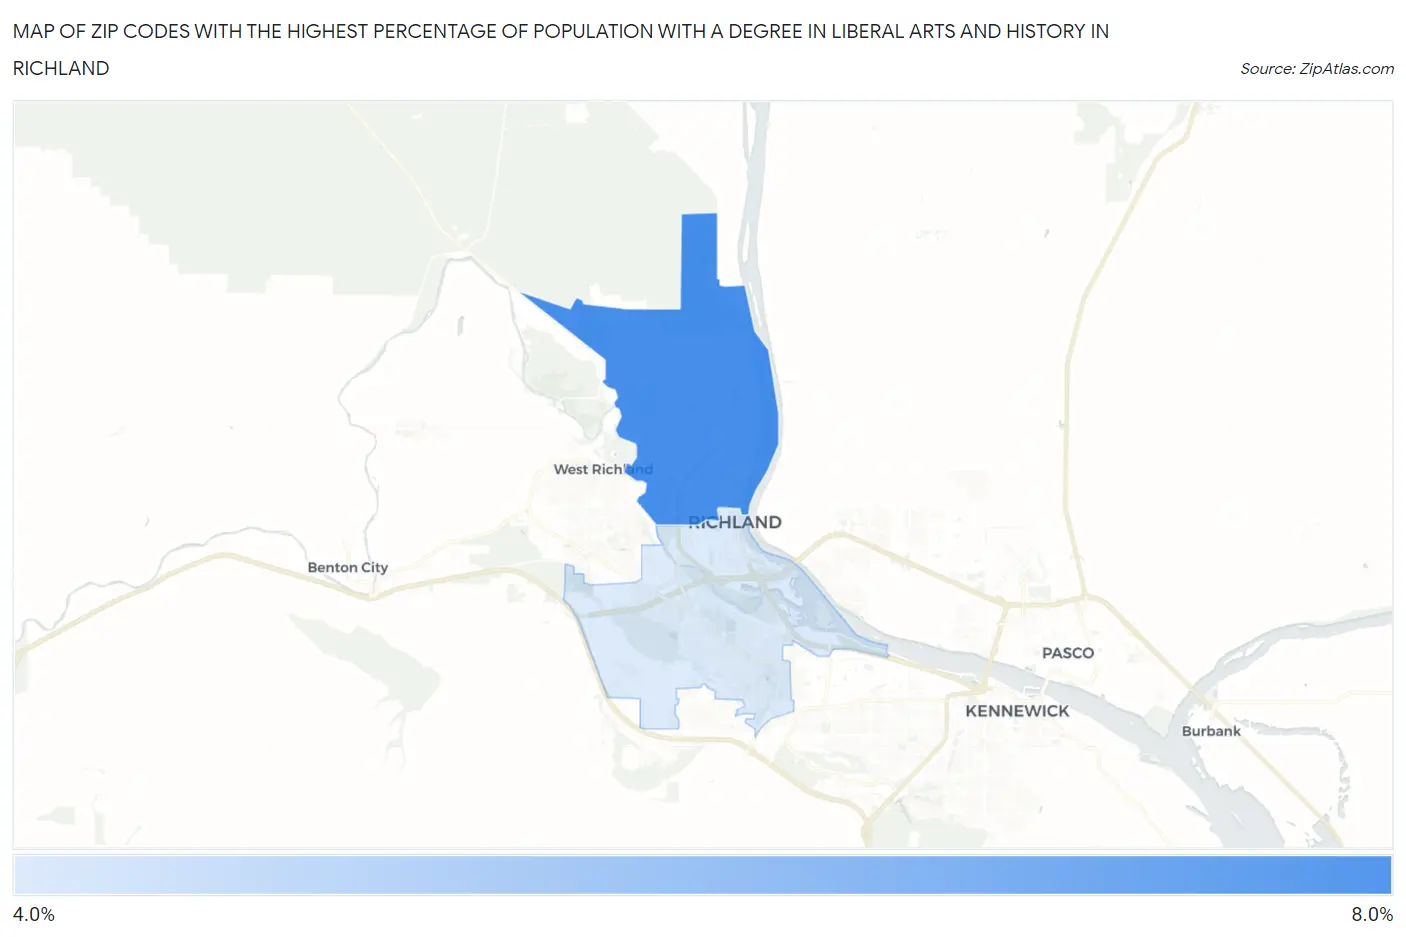
Map of Zip Codes with the Highest Percentage of Population with a Degree in Liberal Arts and History in Richland
4.1%
7.1%
Zip Codes with the Highest Percentage of Population with a Degree in Liberal Arts and History in Richland, WA
| Zip Code | % Graduates | vs State | vs National | |
| 1. | 99354 | 7.1% | 5.1%(+1.96)#123 | 4.9%(+2.24)#6,221 |
| 2. | 99352 | 4.1% | 5.1%(-1.00)#326 | 4.9%(-0.729)#14,229 |
1
Common Questions
What are the Top Zip Codes with the Highest Percentage of Population with a Degree in Liberal Arts and History in Richland, WA?
Top Zip Codes with the Highest Percentage of Population with a Degree in Liberal Arts and History in Richland, WA are:
What zip code has the Highest Percentage of Population with a Degree in Liberal Arts and History in Richland, WA?
99354 has the Highest Percentage of Population with a Degree in Liberal Arts and History in Richland, WA with 7.1%.
What is the Percentage of Population with a Degree in Liberal Arts and History in Richland, WA?
Percentage of Population with a Degree in Liberal Arts and History in Richland is 5.2%.
What is the Percentage of Population with a Degree in Liberal Arts and History in Washington?
Percentage of Population with a Degree in Liberal Arts and History in Washington is 5.1%.
What is the Percentage of Population with a Degree in Liberal Arts and History in the United States?
Percentage of Population with a Degree in Liberal Arts and History in the United States is 4.9%.