Zip Codes with the Highest Percentage of Population with a Degree in Liberal Arts and History in Port Angeles, WA
RELATED REPORTS & OPTIONS
Liberal Arts and History
Port Angeles
Compare Zip Codes
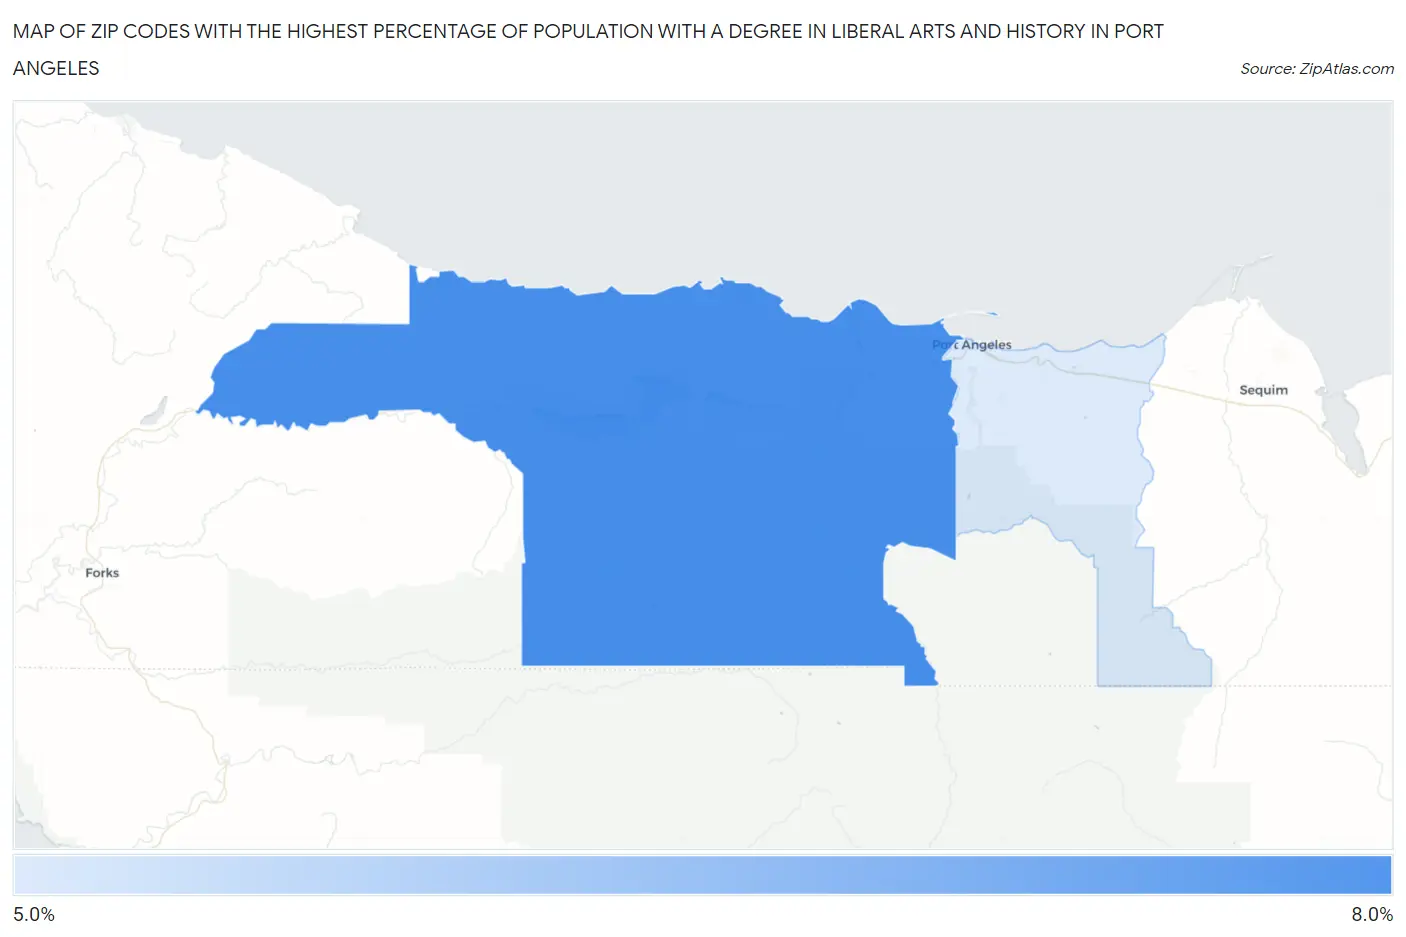
Map of Zip Codes with the Highest Percentage of Population with a Degree in Liberal Arts and History in Port Angeles
5.2%
6.5%
Zip Codes with the Highest Percentage of Population with a Degree in Liberal Arts and History in Port Angeles, WA
| Zip Code | % Graduates | vs State | vs National | |
| 1. | 98363 | 6.5% | 5.1%(+1.32)#161 | 4.9%(+1.60)#7,407 |
| 2. | 98362 | 5.2% | 5.1%(+0.014)#245 | 4.9%(+0.289)#10,841 |
1
Common Questions
What are the Top Zip Codes with the Highest Percentage of Population with a Degree in Liberal Arts and History in Port Angeles, WA?
Top Zip Codes with the Highest Percentage of Population with a Degree in Liberal Arts and History in Port Angeles, WA are:
What zip code has the Highest Percentage of Population with a Degree in Liberal Arts and History in Port Angeles, WA?
98363 has the Highest Percentage of Population with a Degree in Liberal Arts and History in Port Angeles, WA with 6.5%.
What is the Percentage of Population with a Degree in Liberal Arts and History in Port Angeles, WA?
Percentage of Population with a Degree in Liberal Arts and History in Port Angeles is 4.0%.
What is the Percentage of Population with a Degree in Liberal Arts and History in Washington?
Percentage of Population with a Degree in Liberal Arts and History in Washington is 5.1%.
What is the Percentage of Population with a Degree in Liberal Arts and History in the United States?
Percentage of Population with a Degree in Liberal Arts and History in the United States is 4.9%.